Building a workflow
With our data platform, the goal is to clean and transform data from different sources or database easily to have accurate and quick access to data faster. Irrespective of your role, data analyst, data engineers, business analyst, data scientist, or a member of the sales or operation team, you can easily build a workflow, integrate data, perform data transformation process, store data in a repository (cloud warehouse) for further analysis.
This section describes how to easily build a data pipeline workflow. After creating a project, the next step is to build a workflow process that will aid your data to be accurate. in this article, you will learn how to Input data from different data sources, perform different transformation processes and store the workflow in a repository that will enable access and collaboration for business analysis, reporting and machine learning
Data
Data is one of the tools in the project workflow which enables you to ingest data from different sources into the project workflow. To connect data from different data connections or sources:
Click on the Name bar at the top-right of the dashboard, an dialog will appear, click on "connection tab" to connect your data to build a data workflow
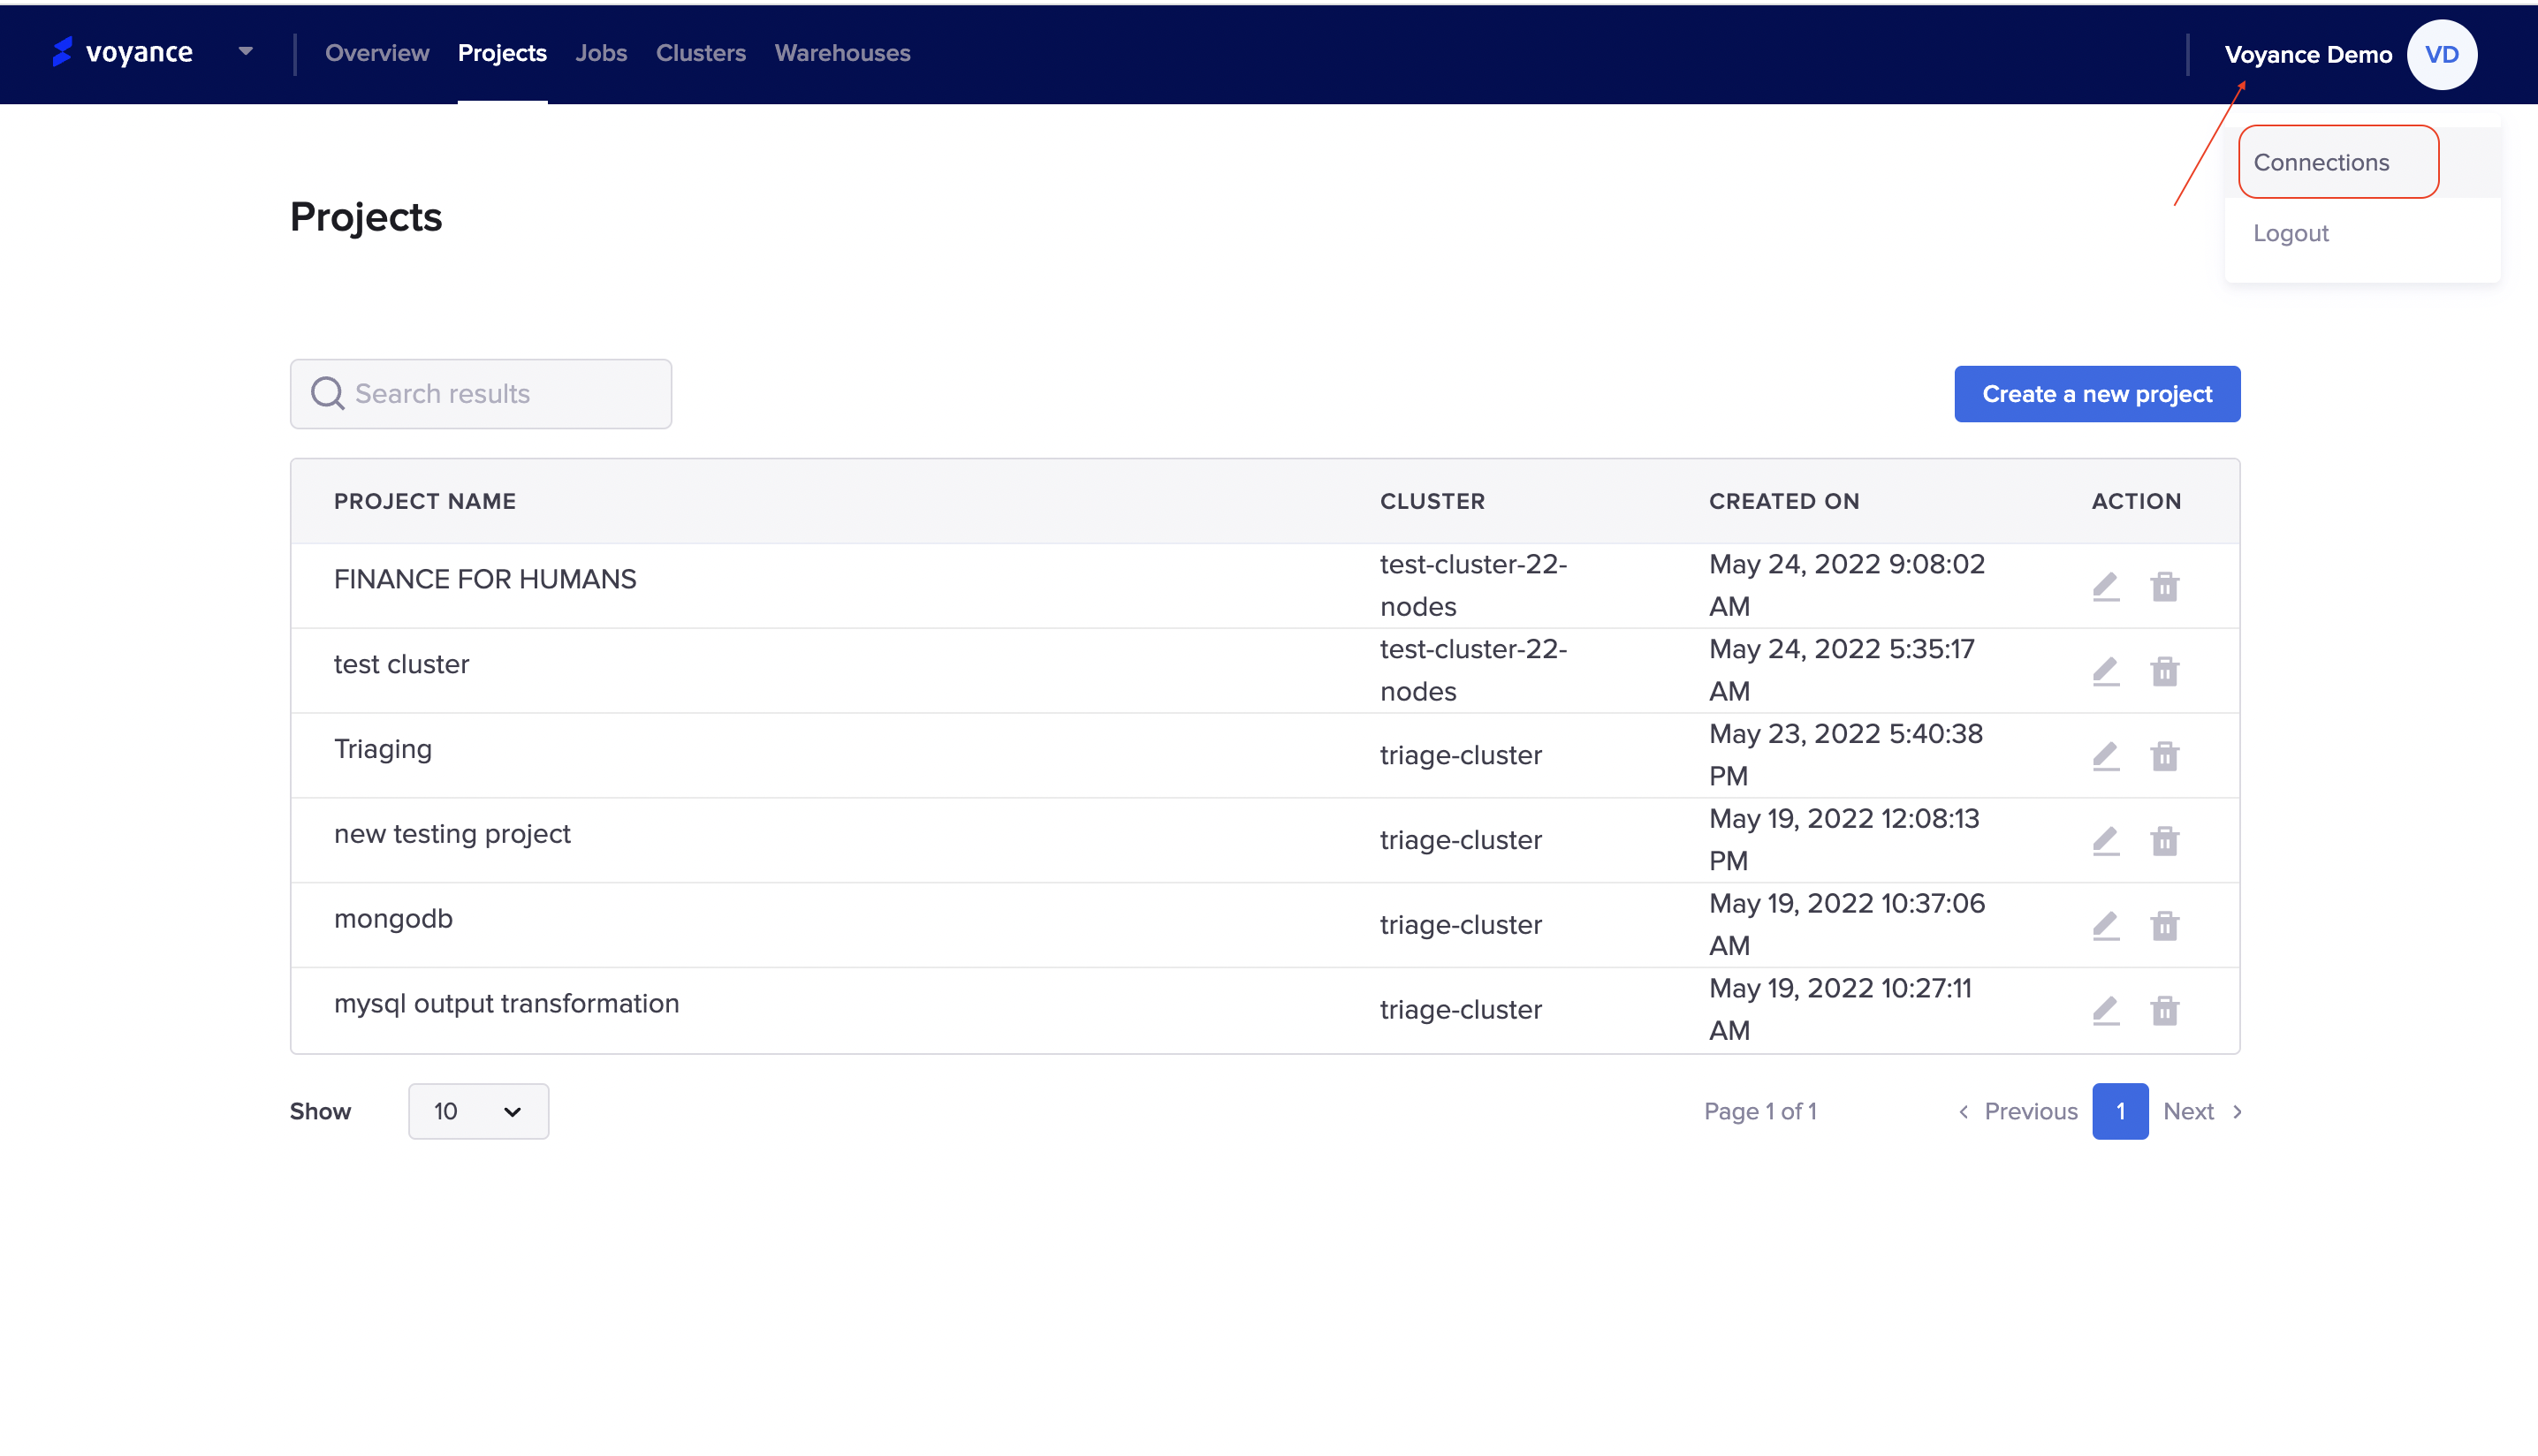
Note
You can create a data connection at anytime
Import Input Data
- To connect input data, click on the "Data" there is a drop-down arrow on the left corner of the project workflow, it shows the “input data operator” that will enable you to connect your data to your workflow.
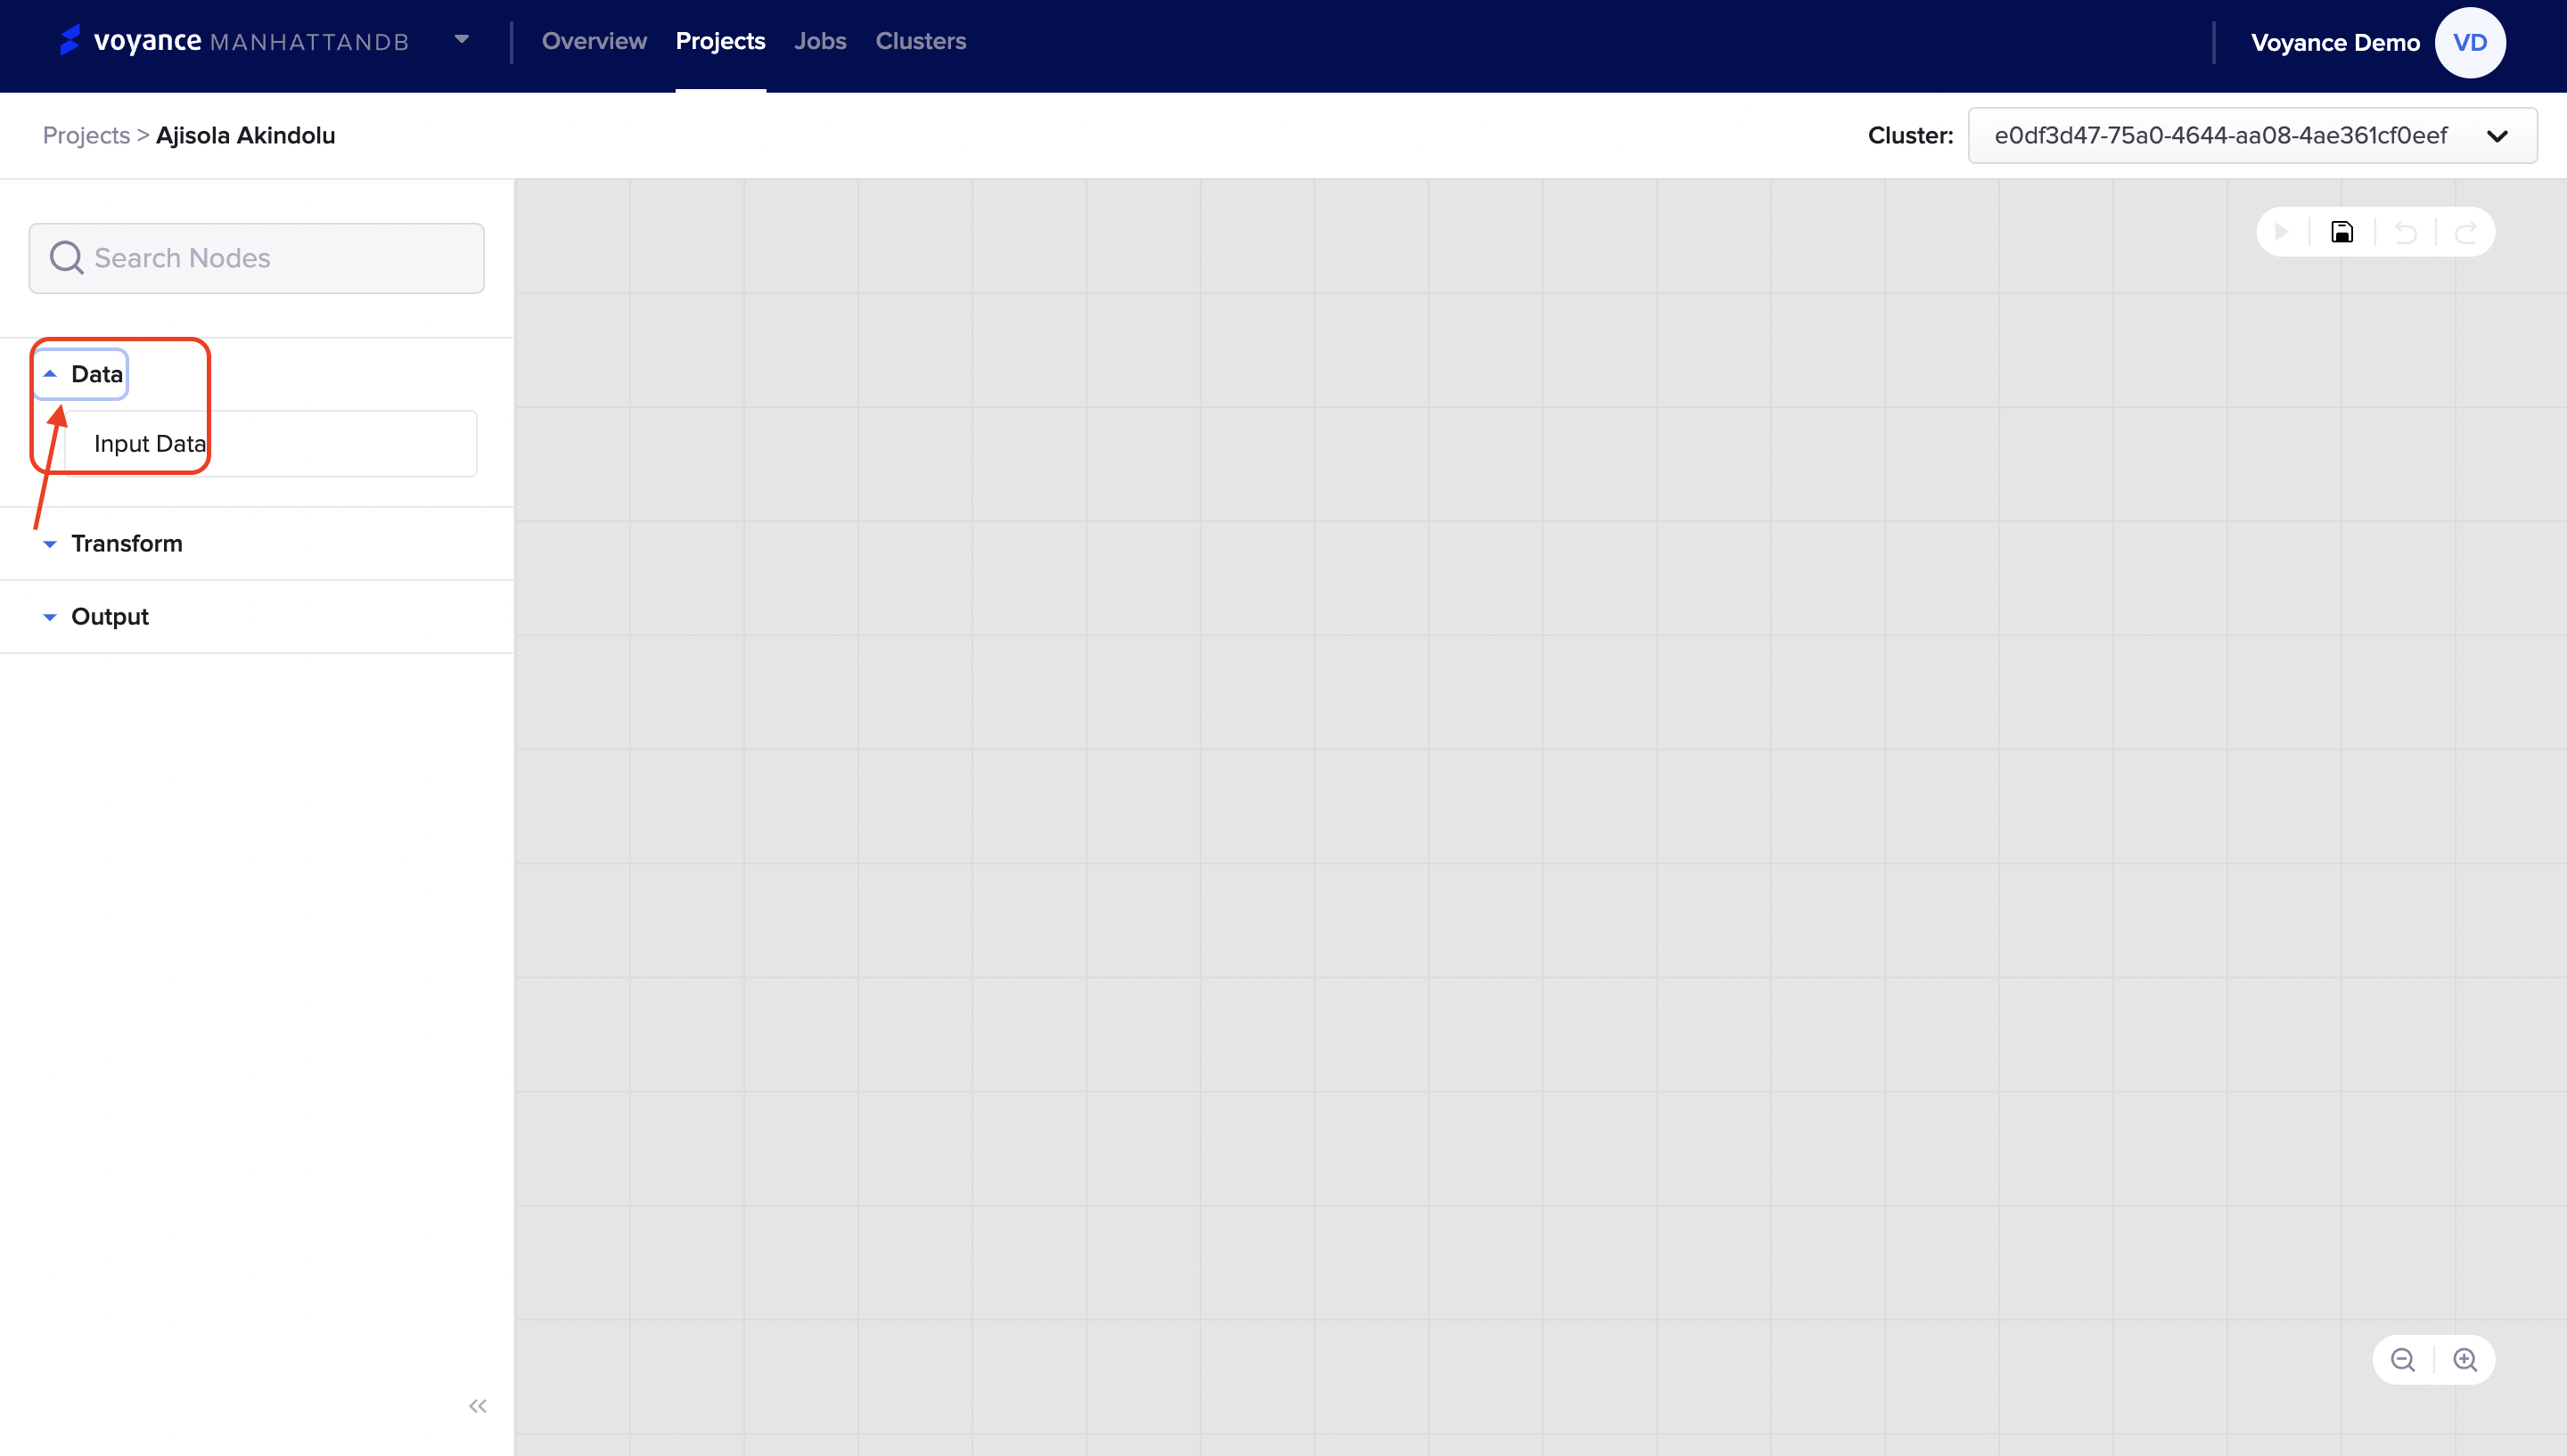
- Click and Drag the “input data operator” to the project canvas dashboard to ingest data from different data connections into the project.
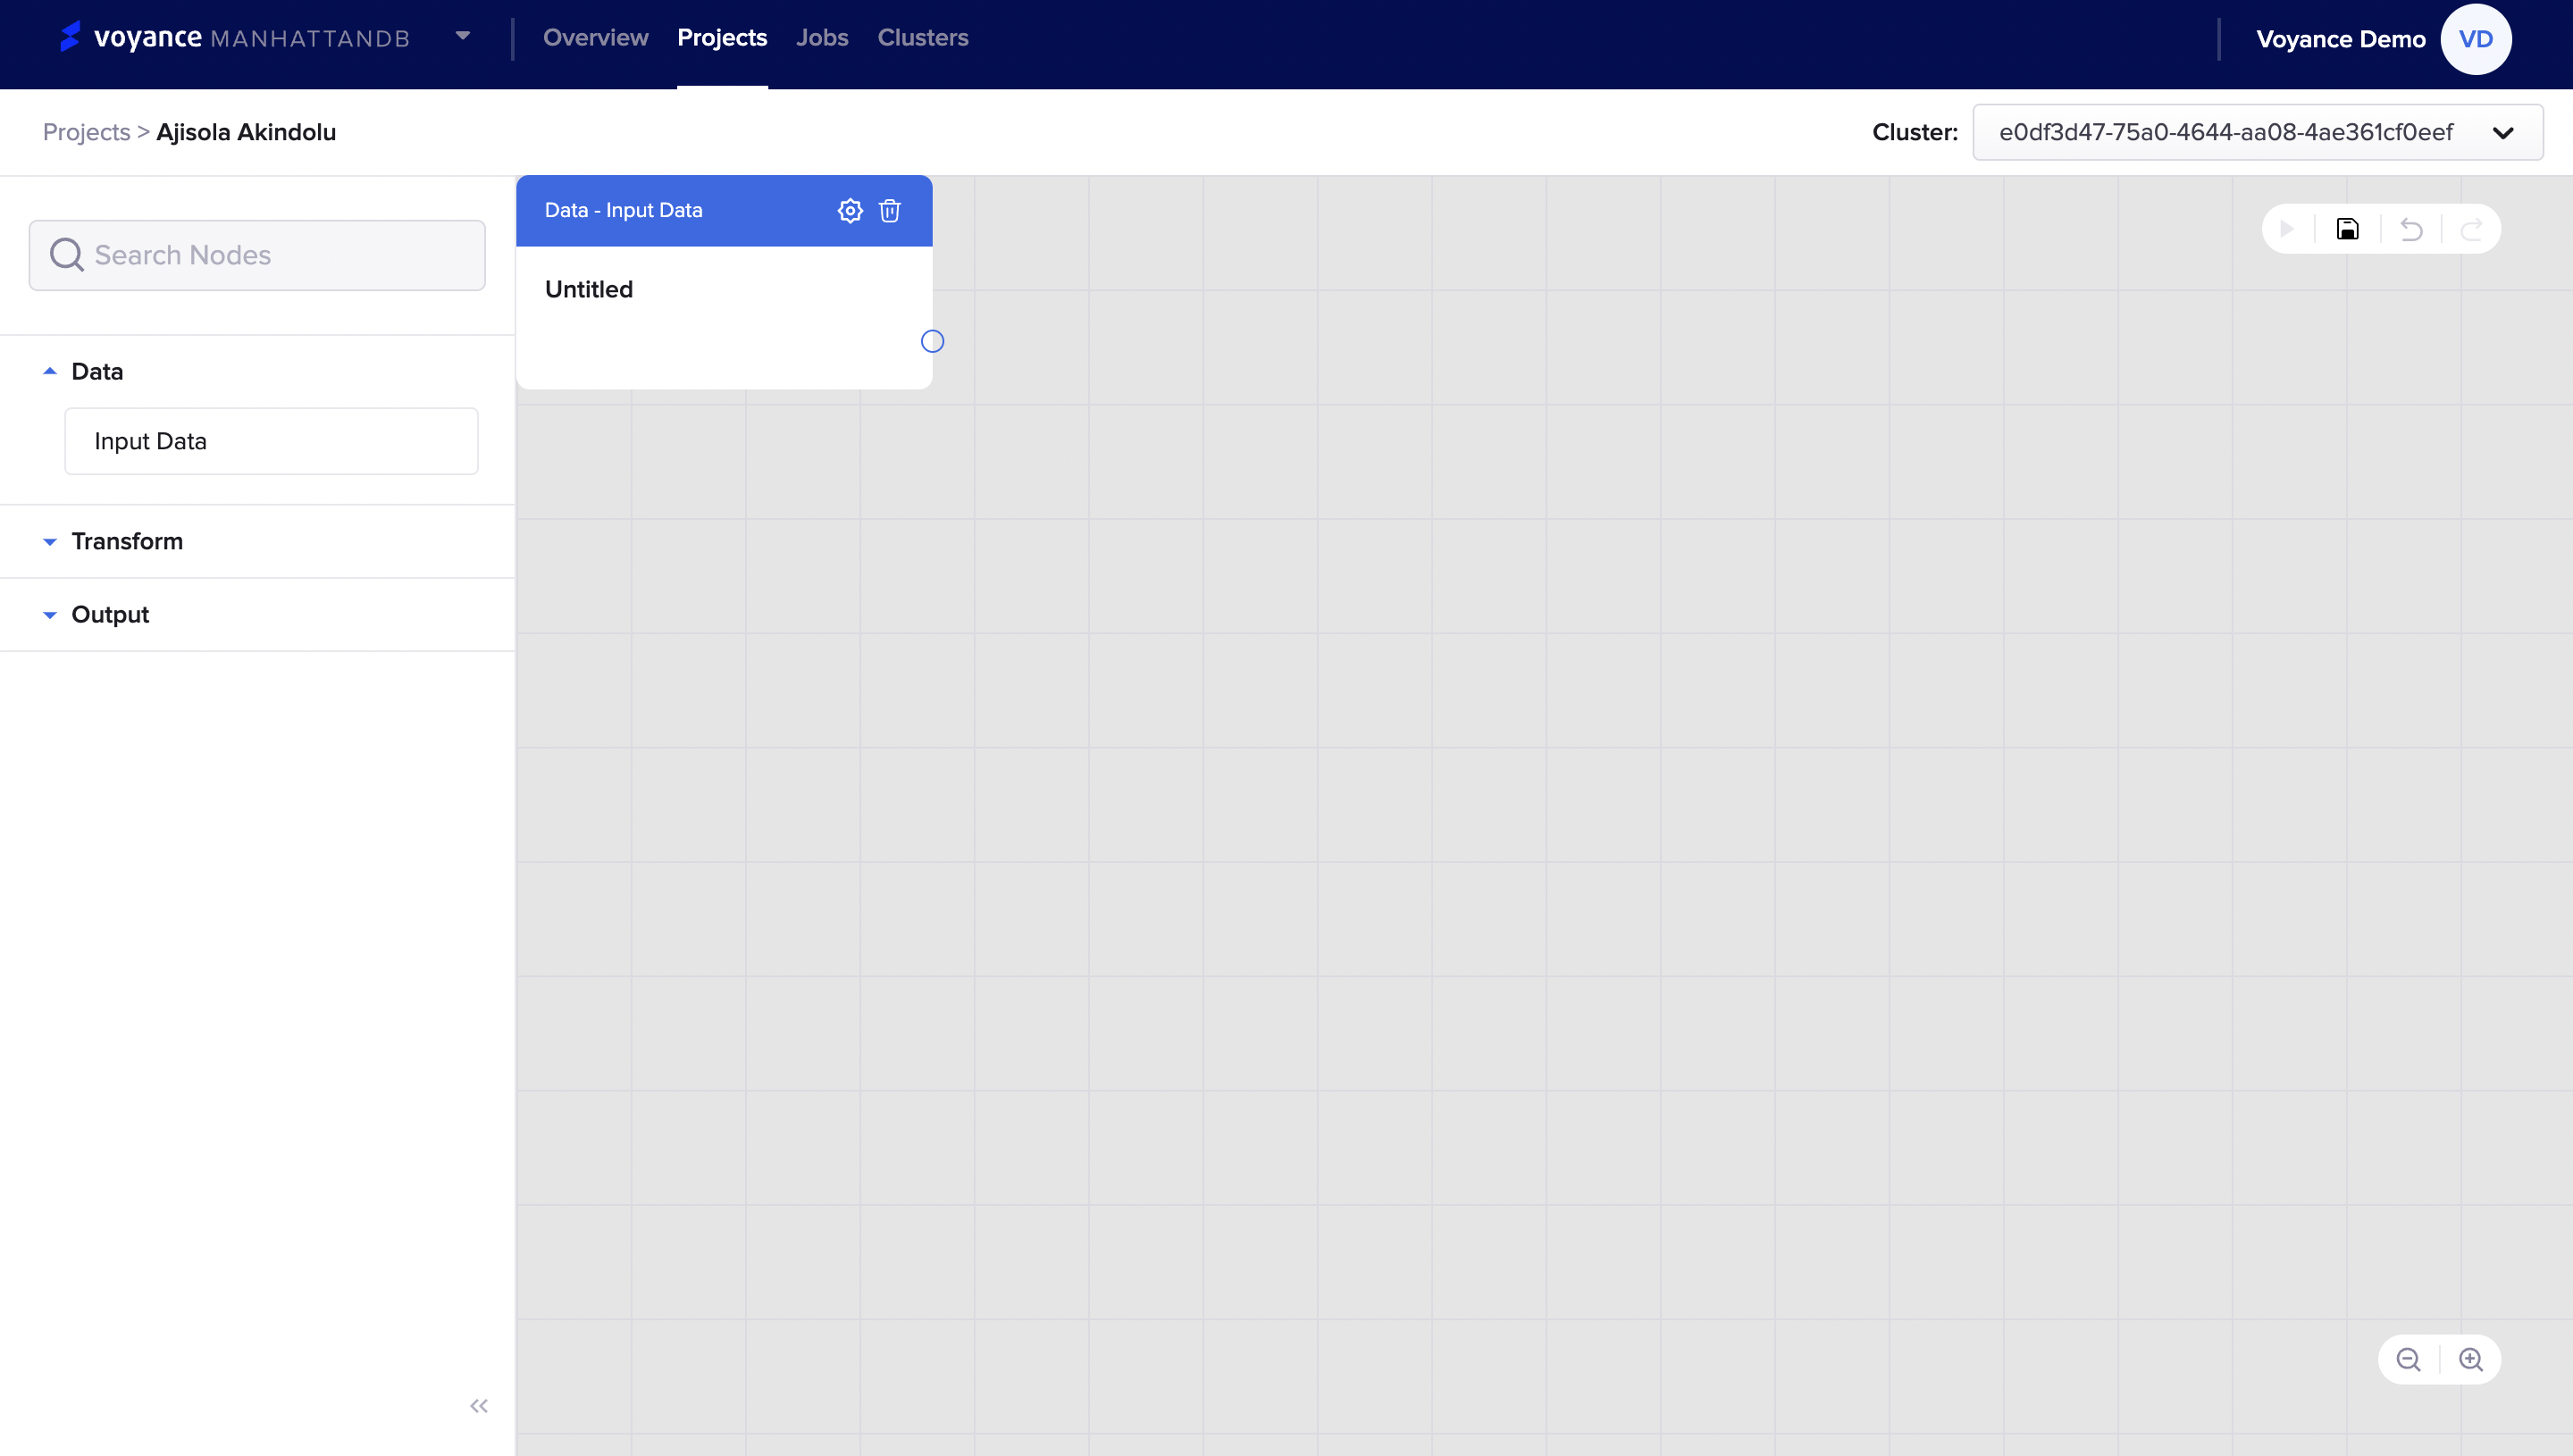
Edit the Data-input data
- To edit the “input data” to ingest data, click on the “Settings icon” at the top-right of the dragged input data dialog box.
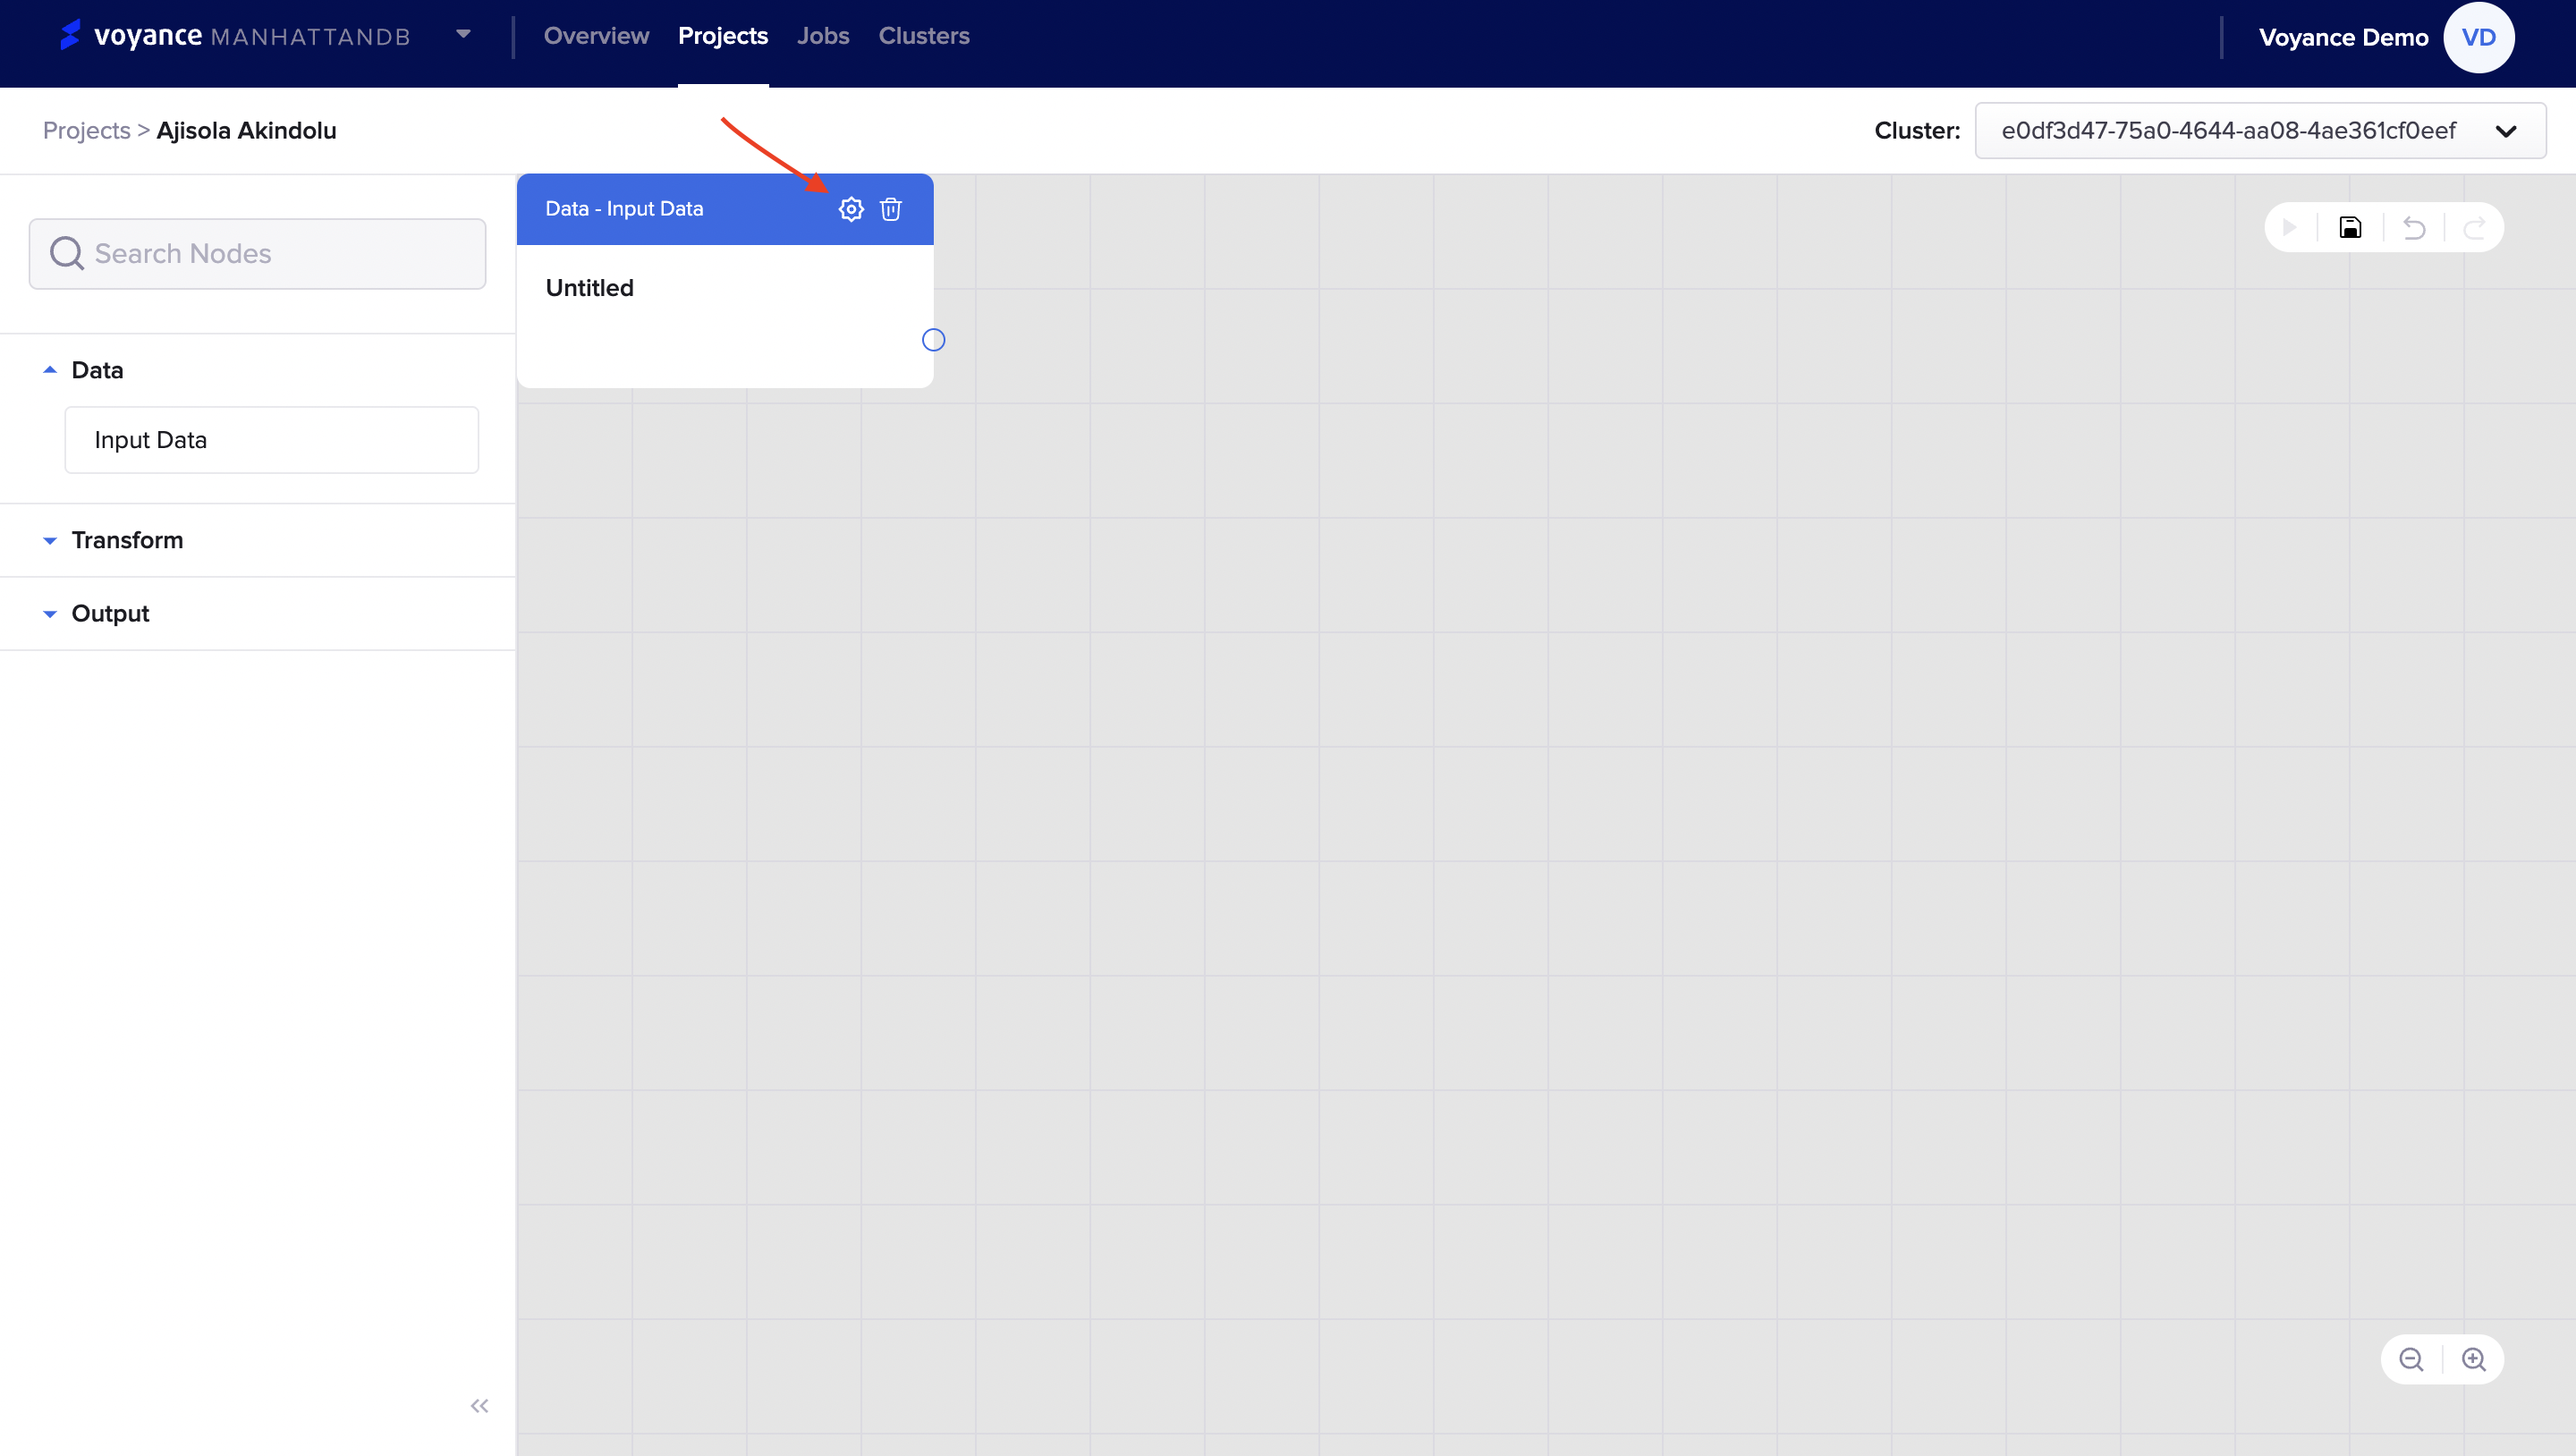
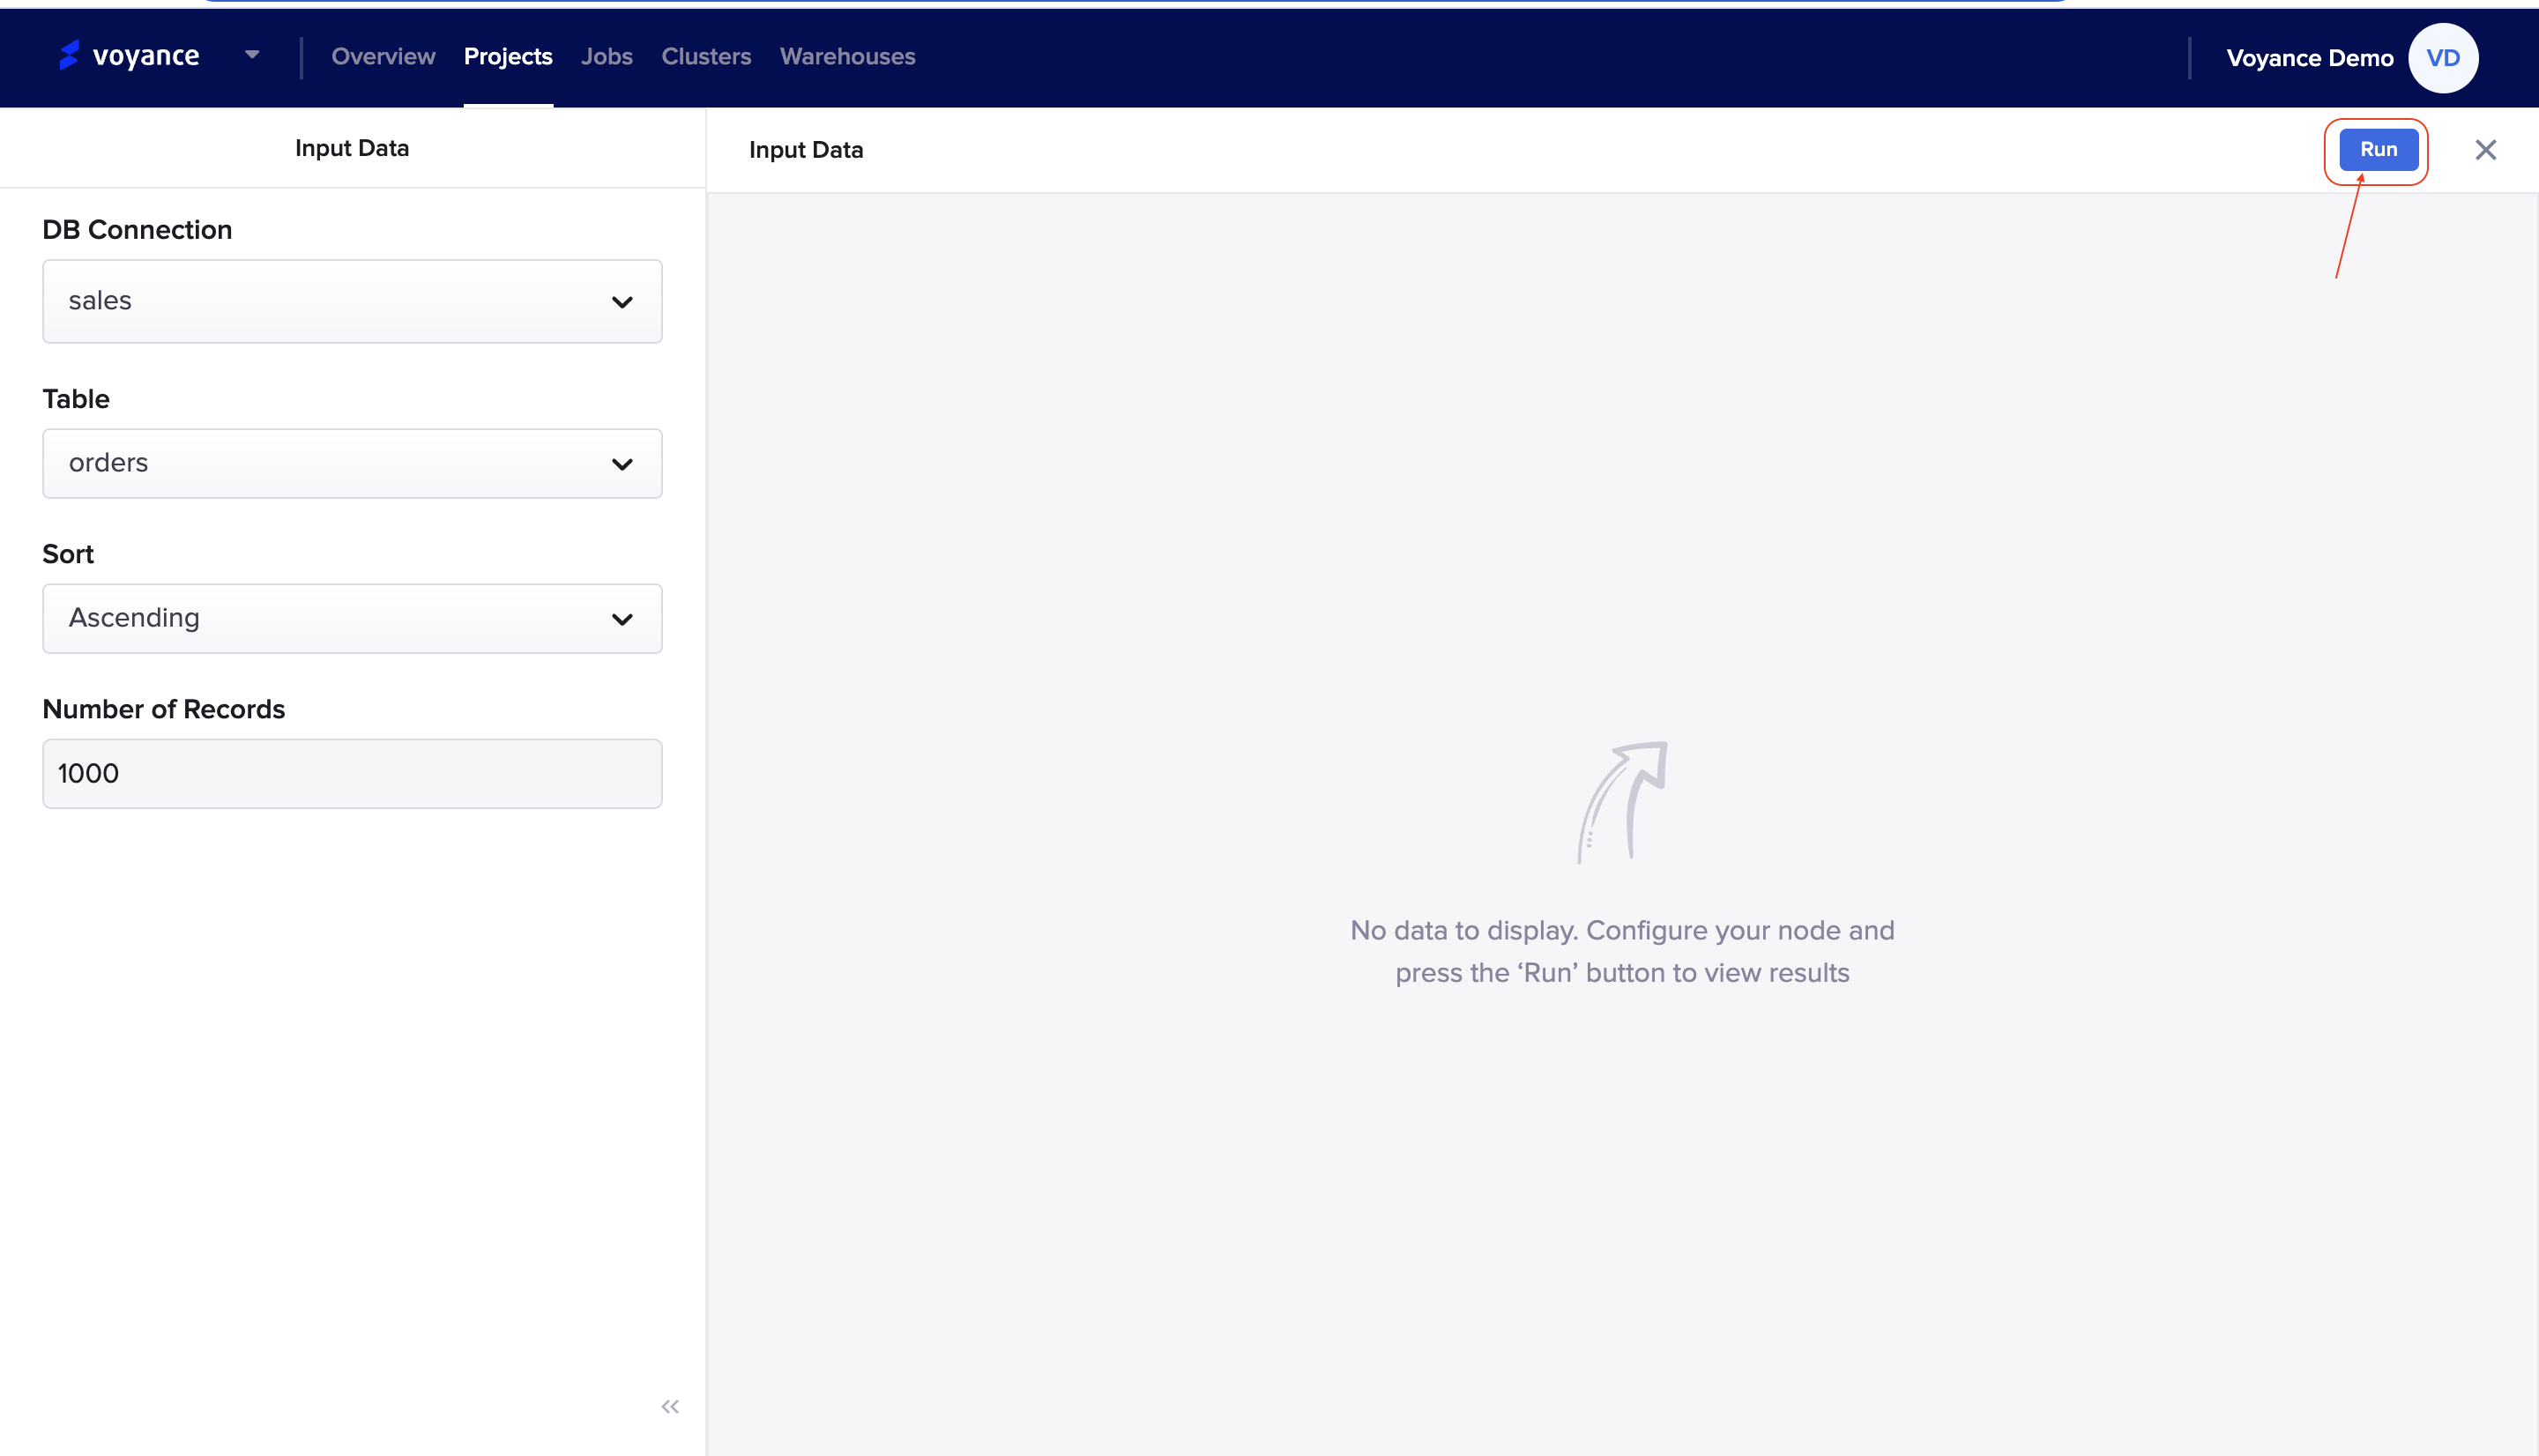
Once you are on the input data page, there are several parameters which will appear for you to be able to successfully input data into your project workflow. You will be redirected to the input data page to connect your data from the connection to the project workflow. Under this page, you will be displayed a “Database connection field” where you can select a database for your workflow.
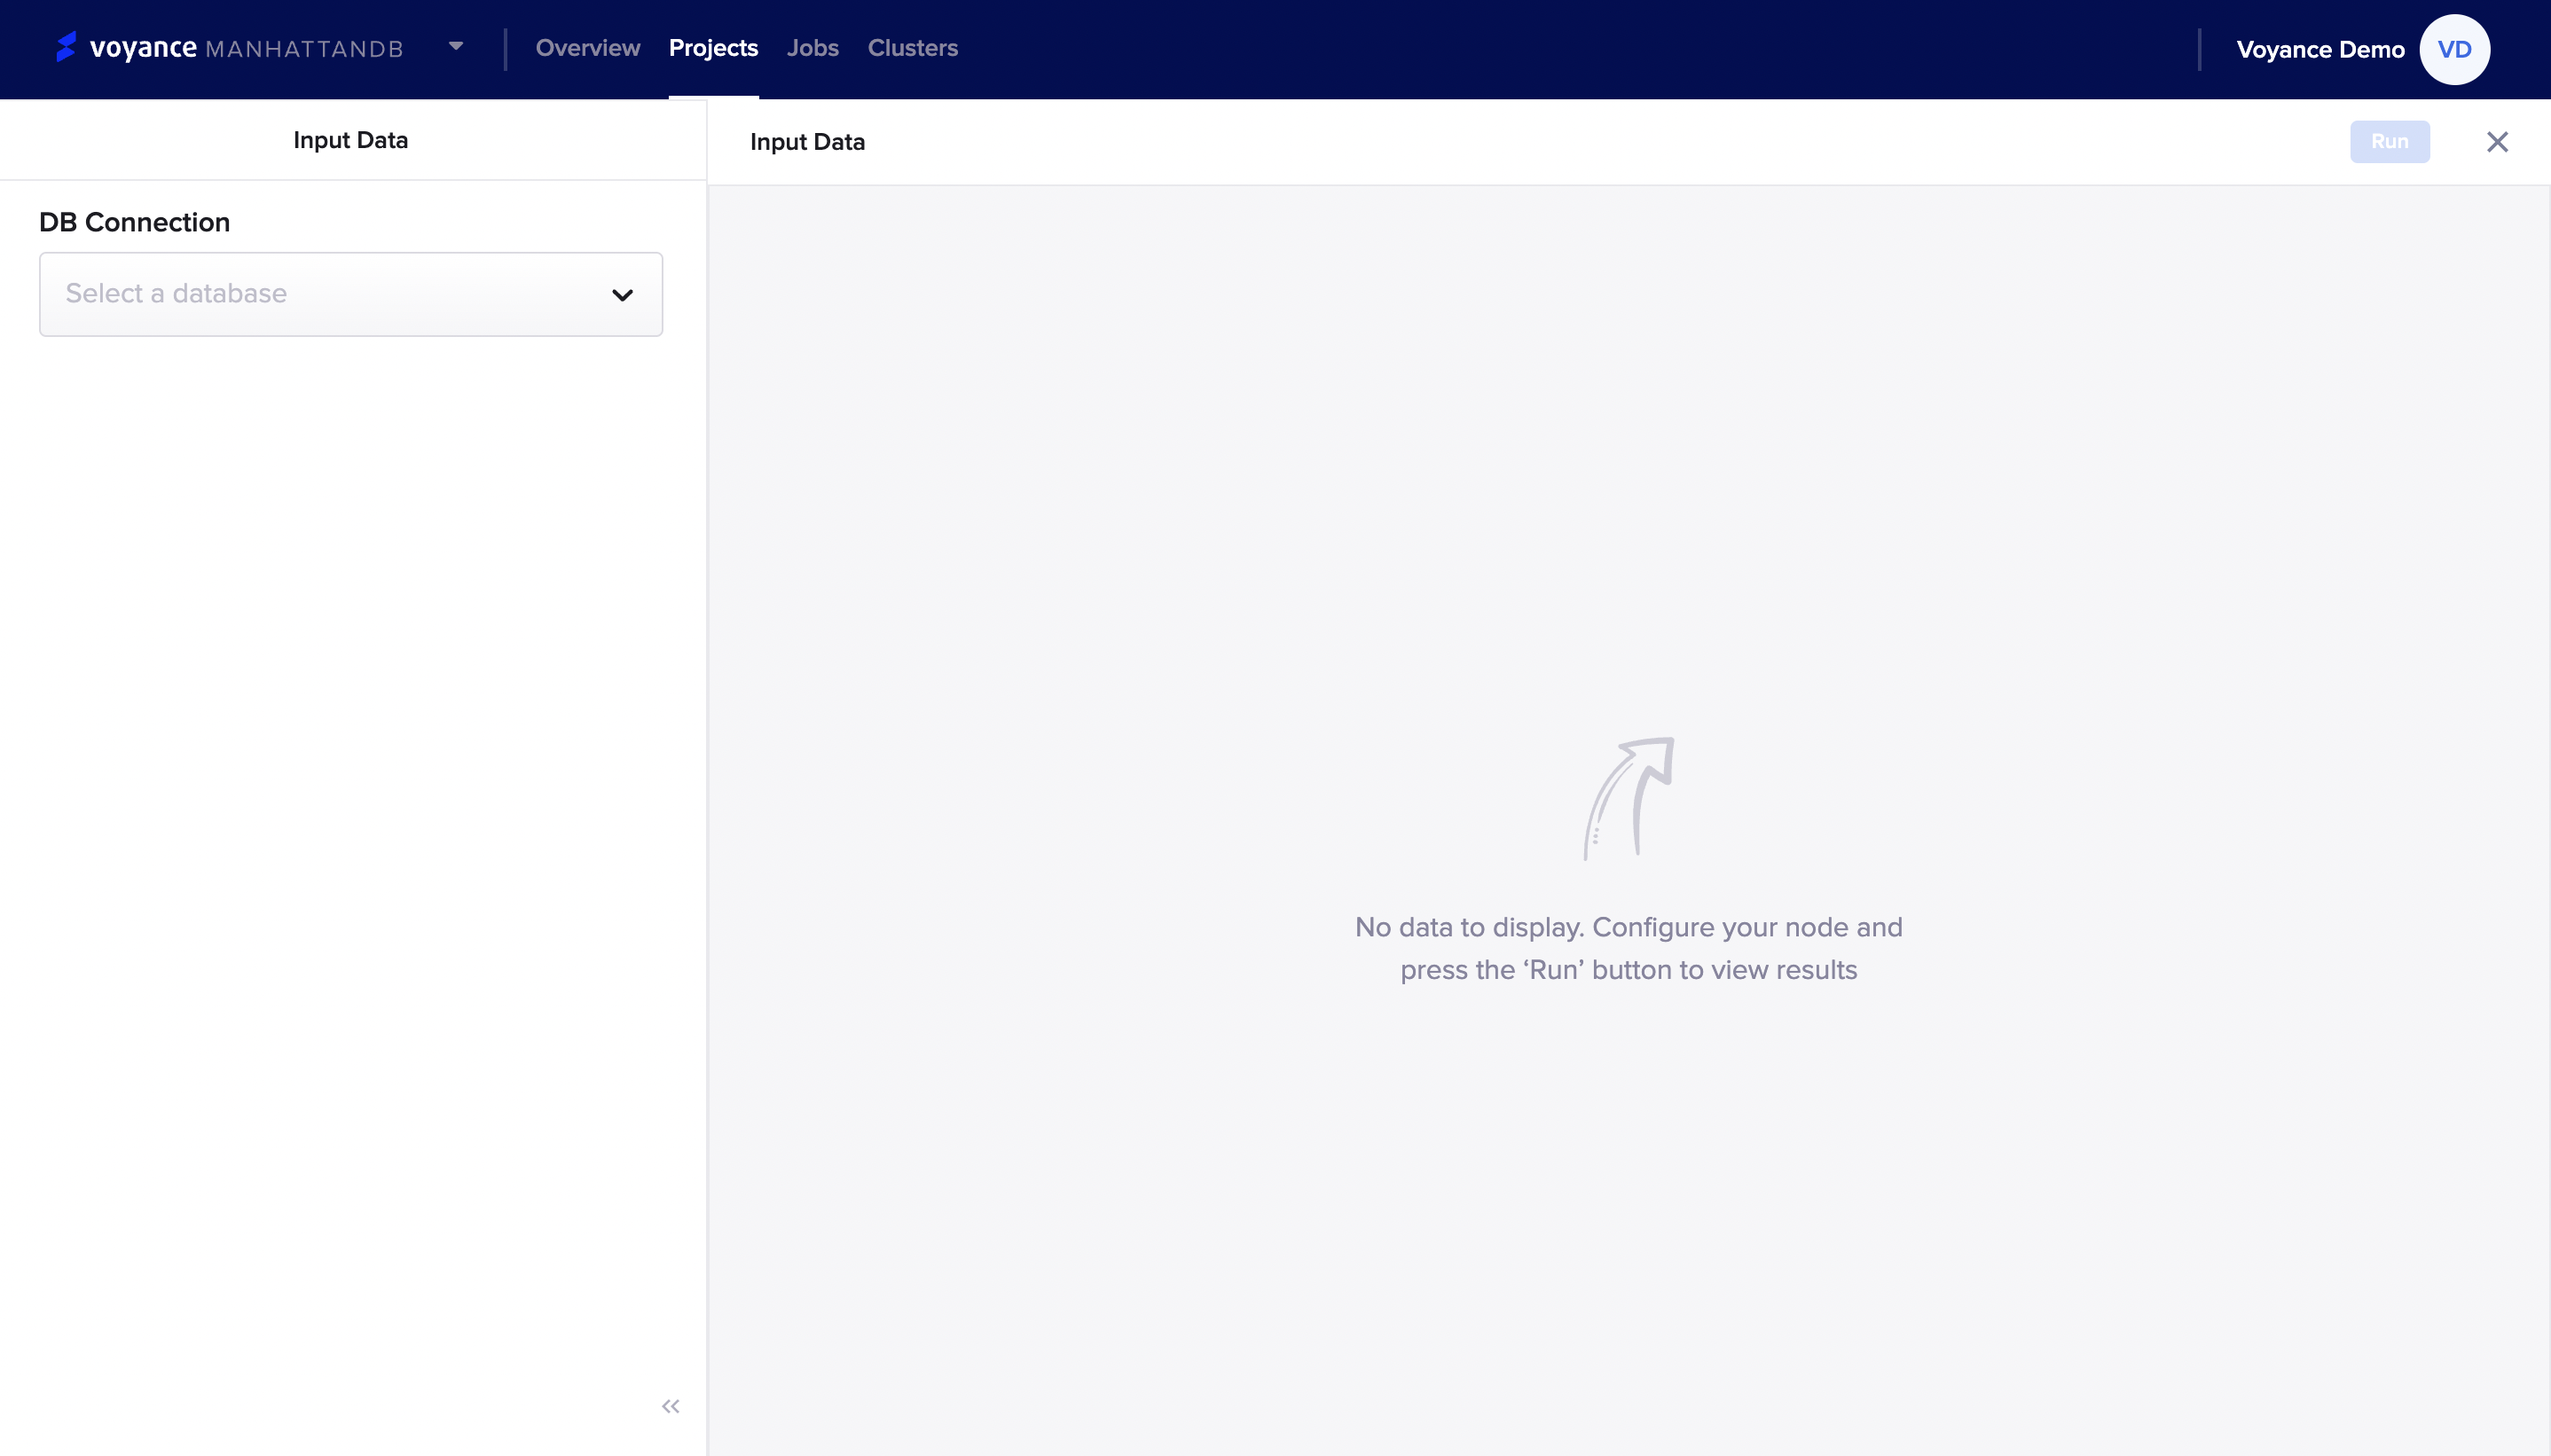
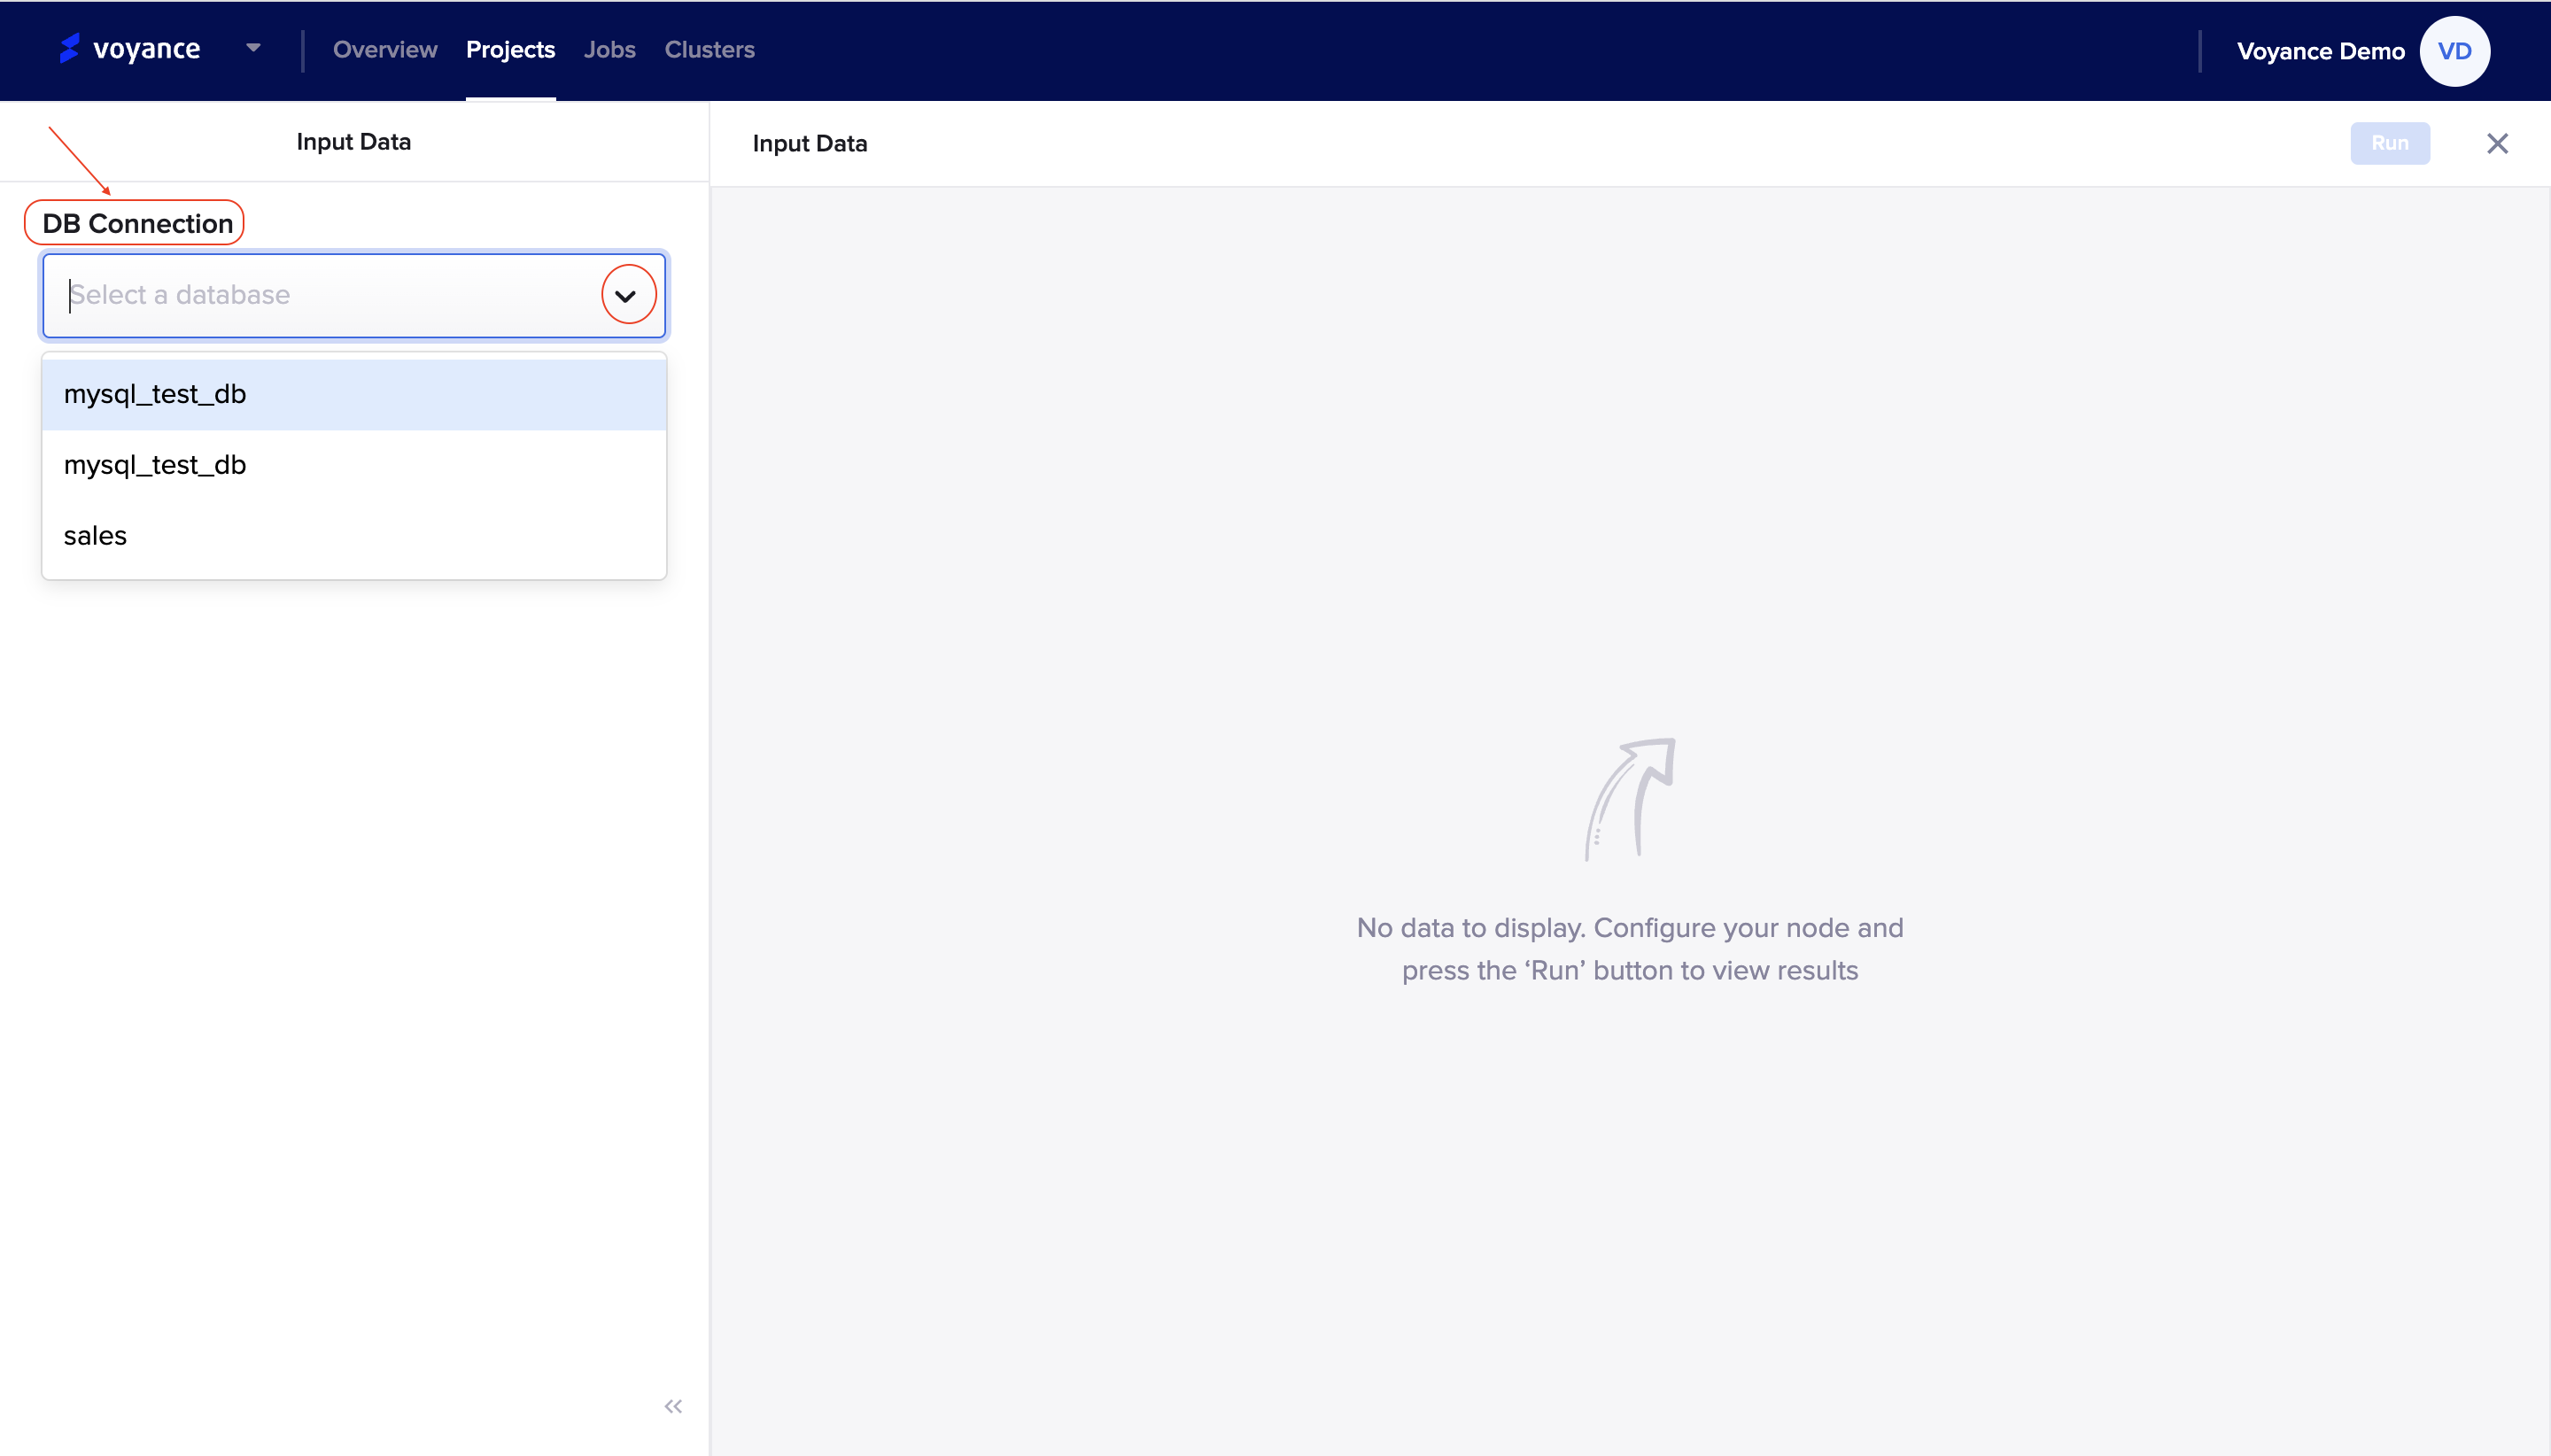
when you click on the "DB connection arrow icon", it displays dropdown of database which are under your data sources to select for the workflow.
once, you select your database, a "Table tab" will appear to select a table for the database you selected. when you click on the table arrow icon, it displays a drop-down of several tables which you can choose.
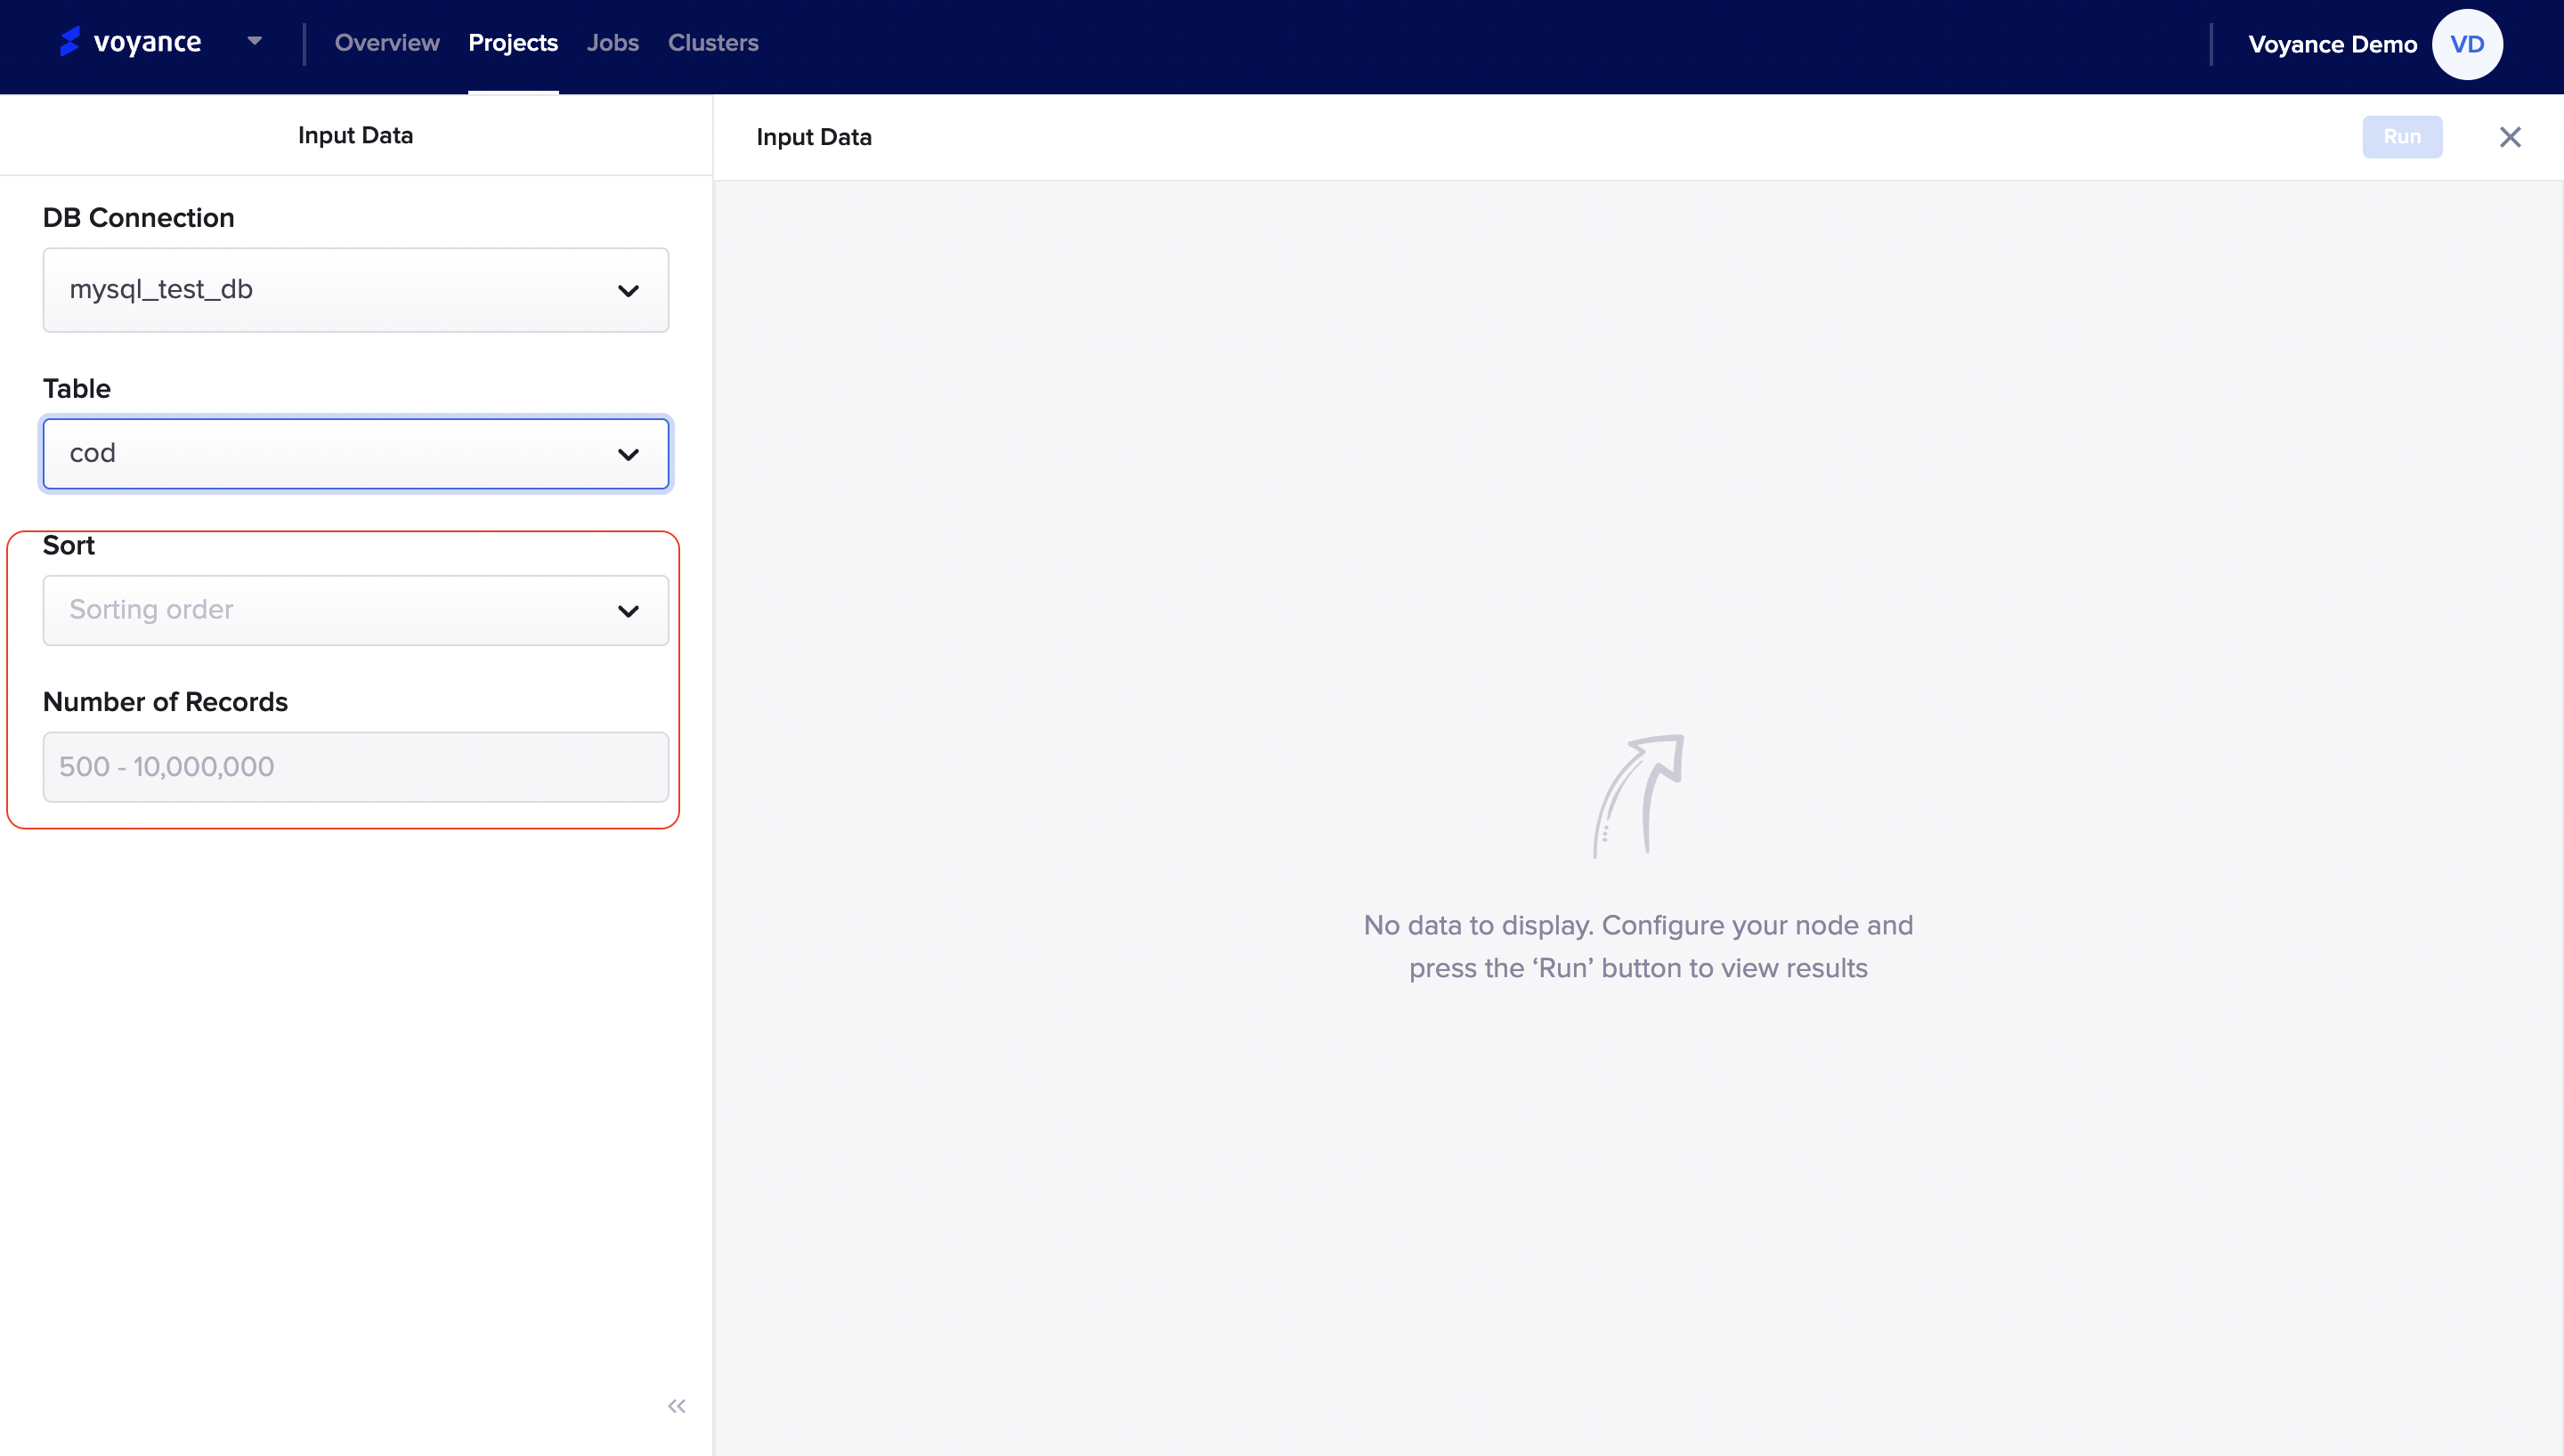
Immediately a table is selected, and the "sorting tab" and the "number of records" tab will appear, which enables you to sort out your data either in an ascending or descending order.
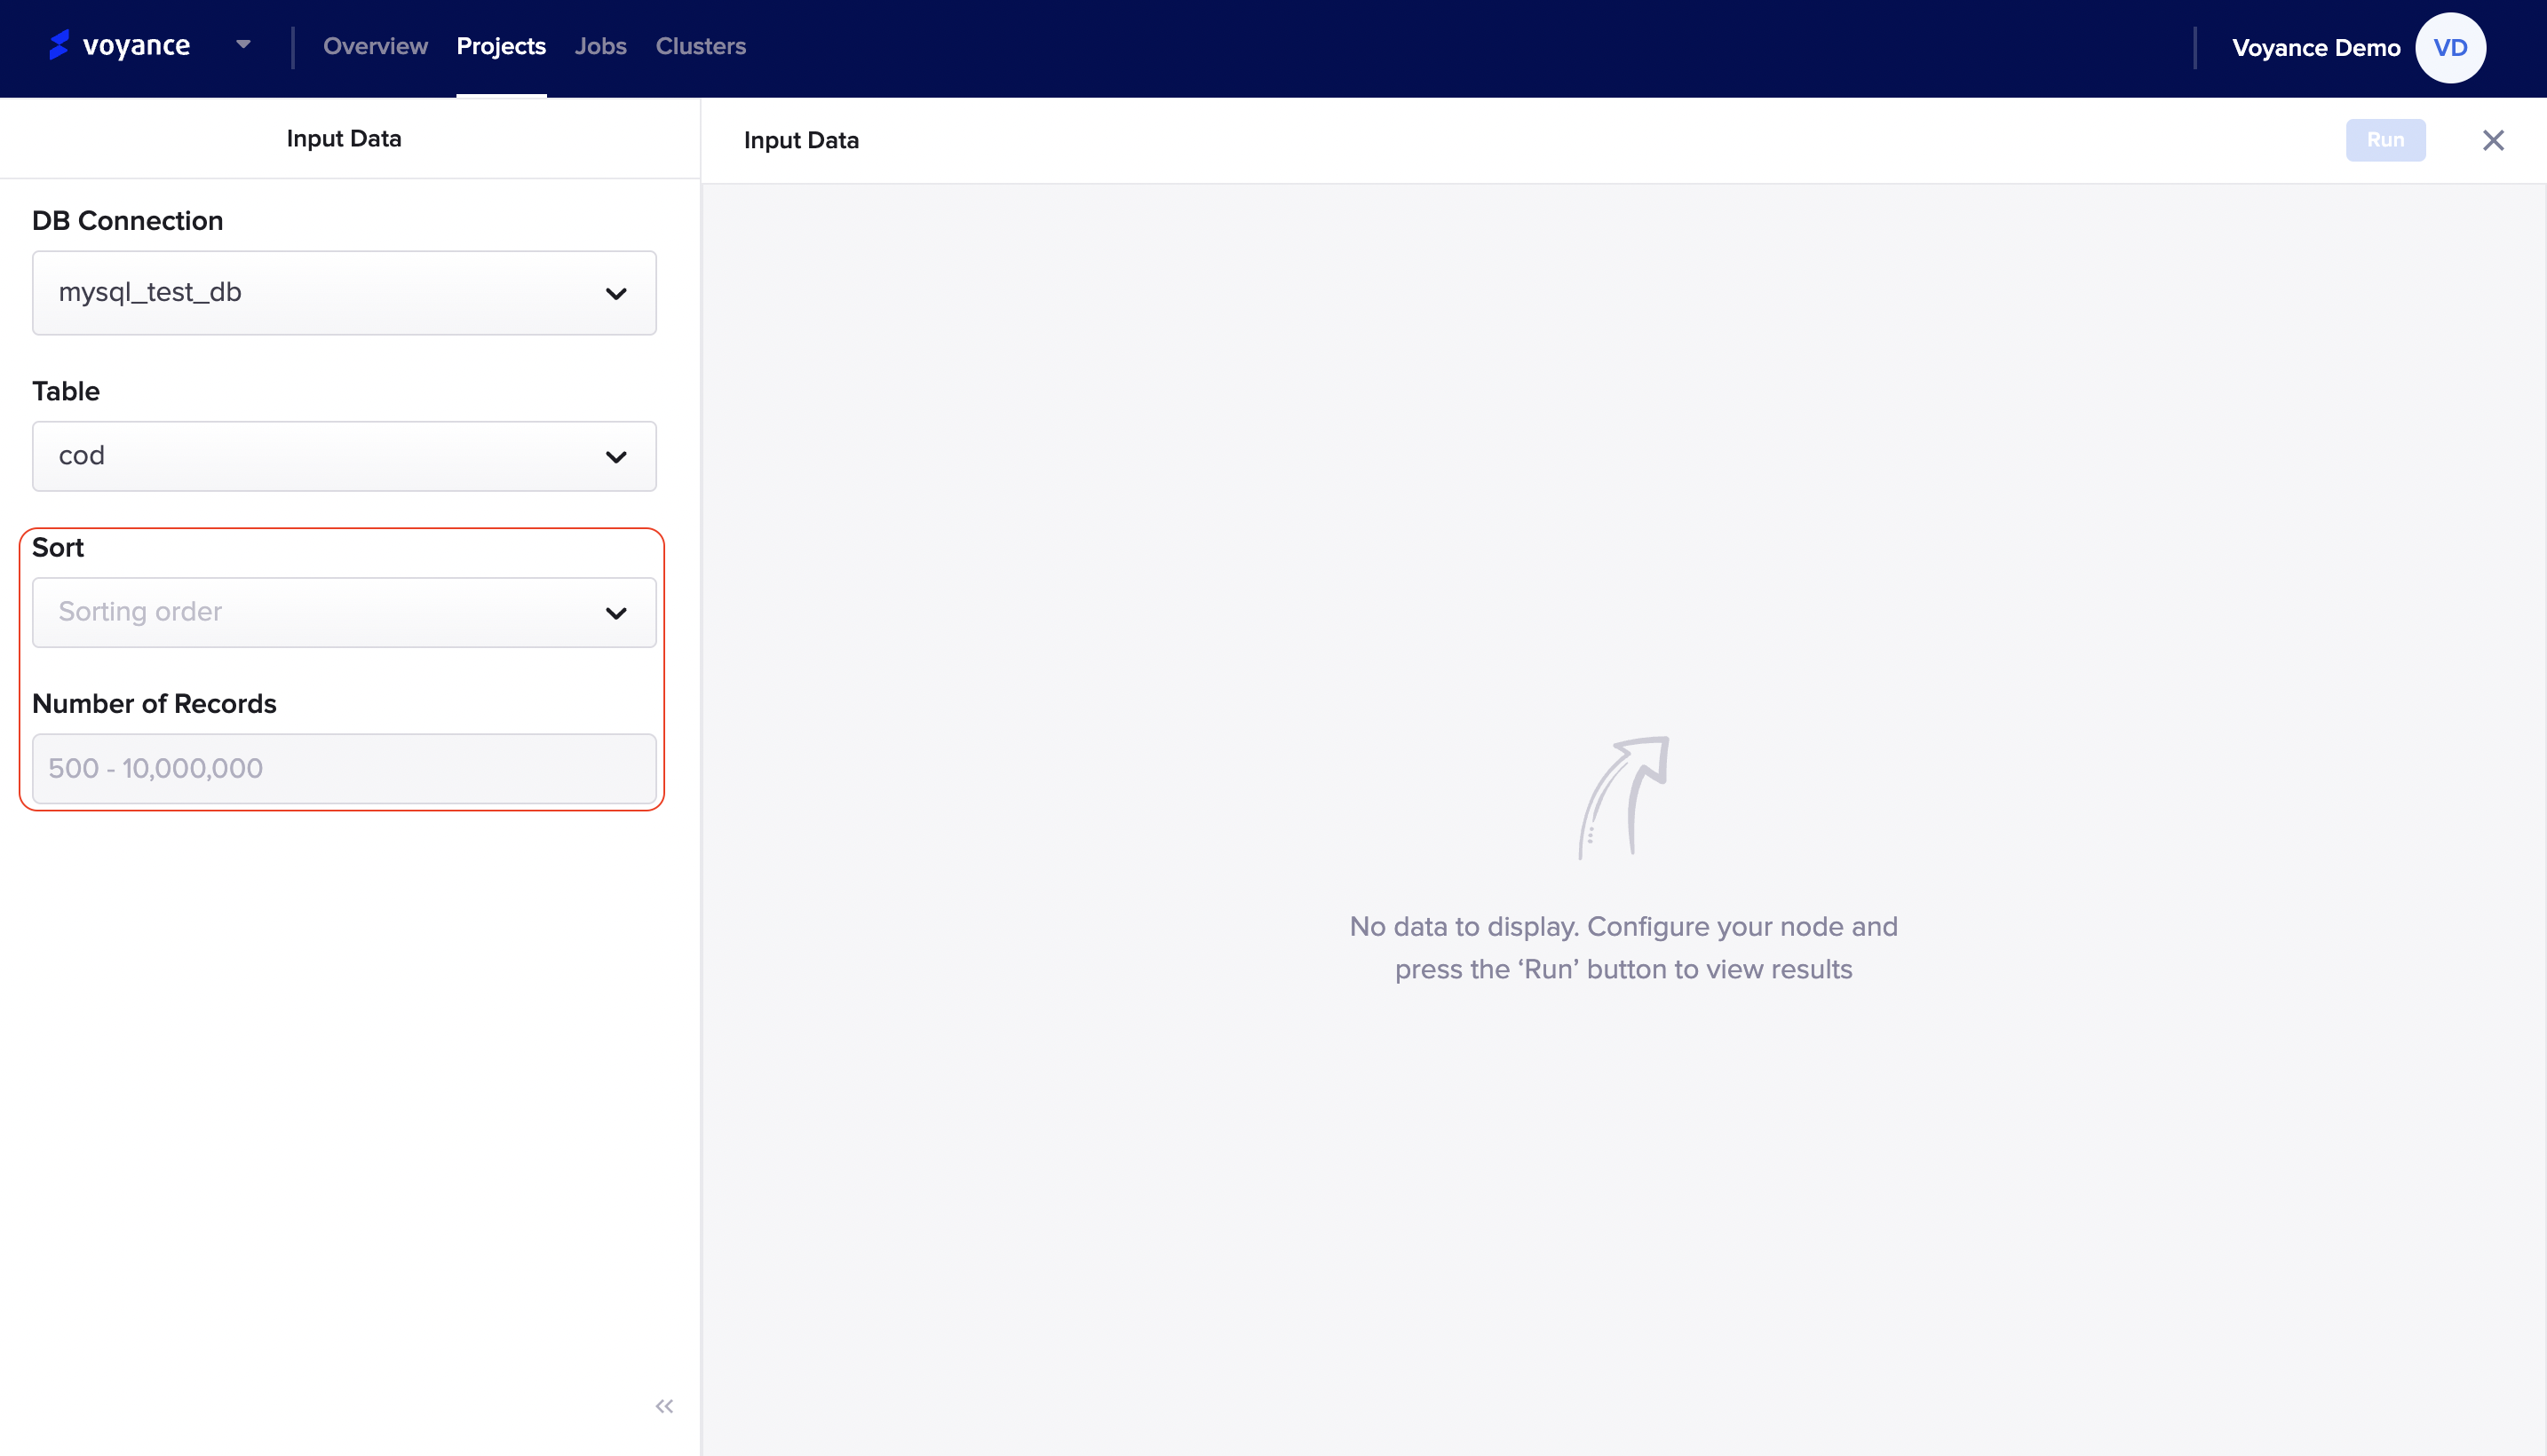
*Run Program
Once you have filled all of the data fields for your workflow for you to be able to perform transformation processes, click on the "Run" tab at the top-right corner of the input data page to analyze data.
Delete Data Card
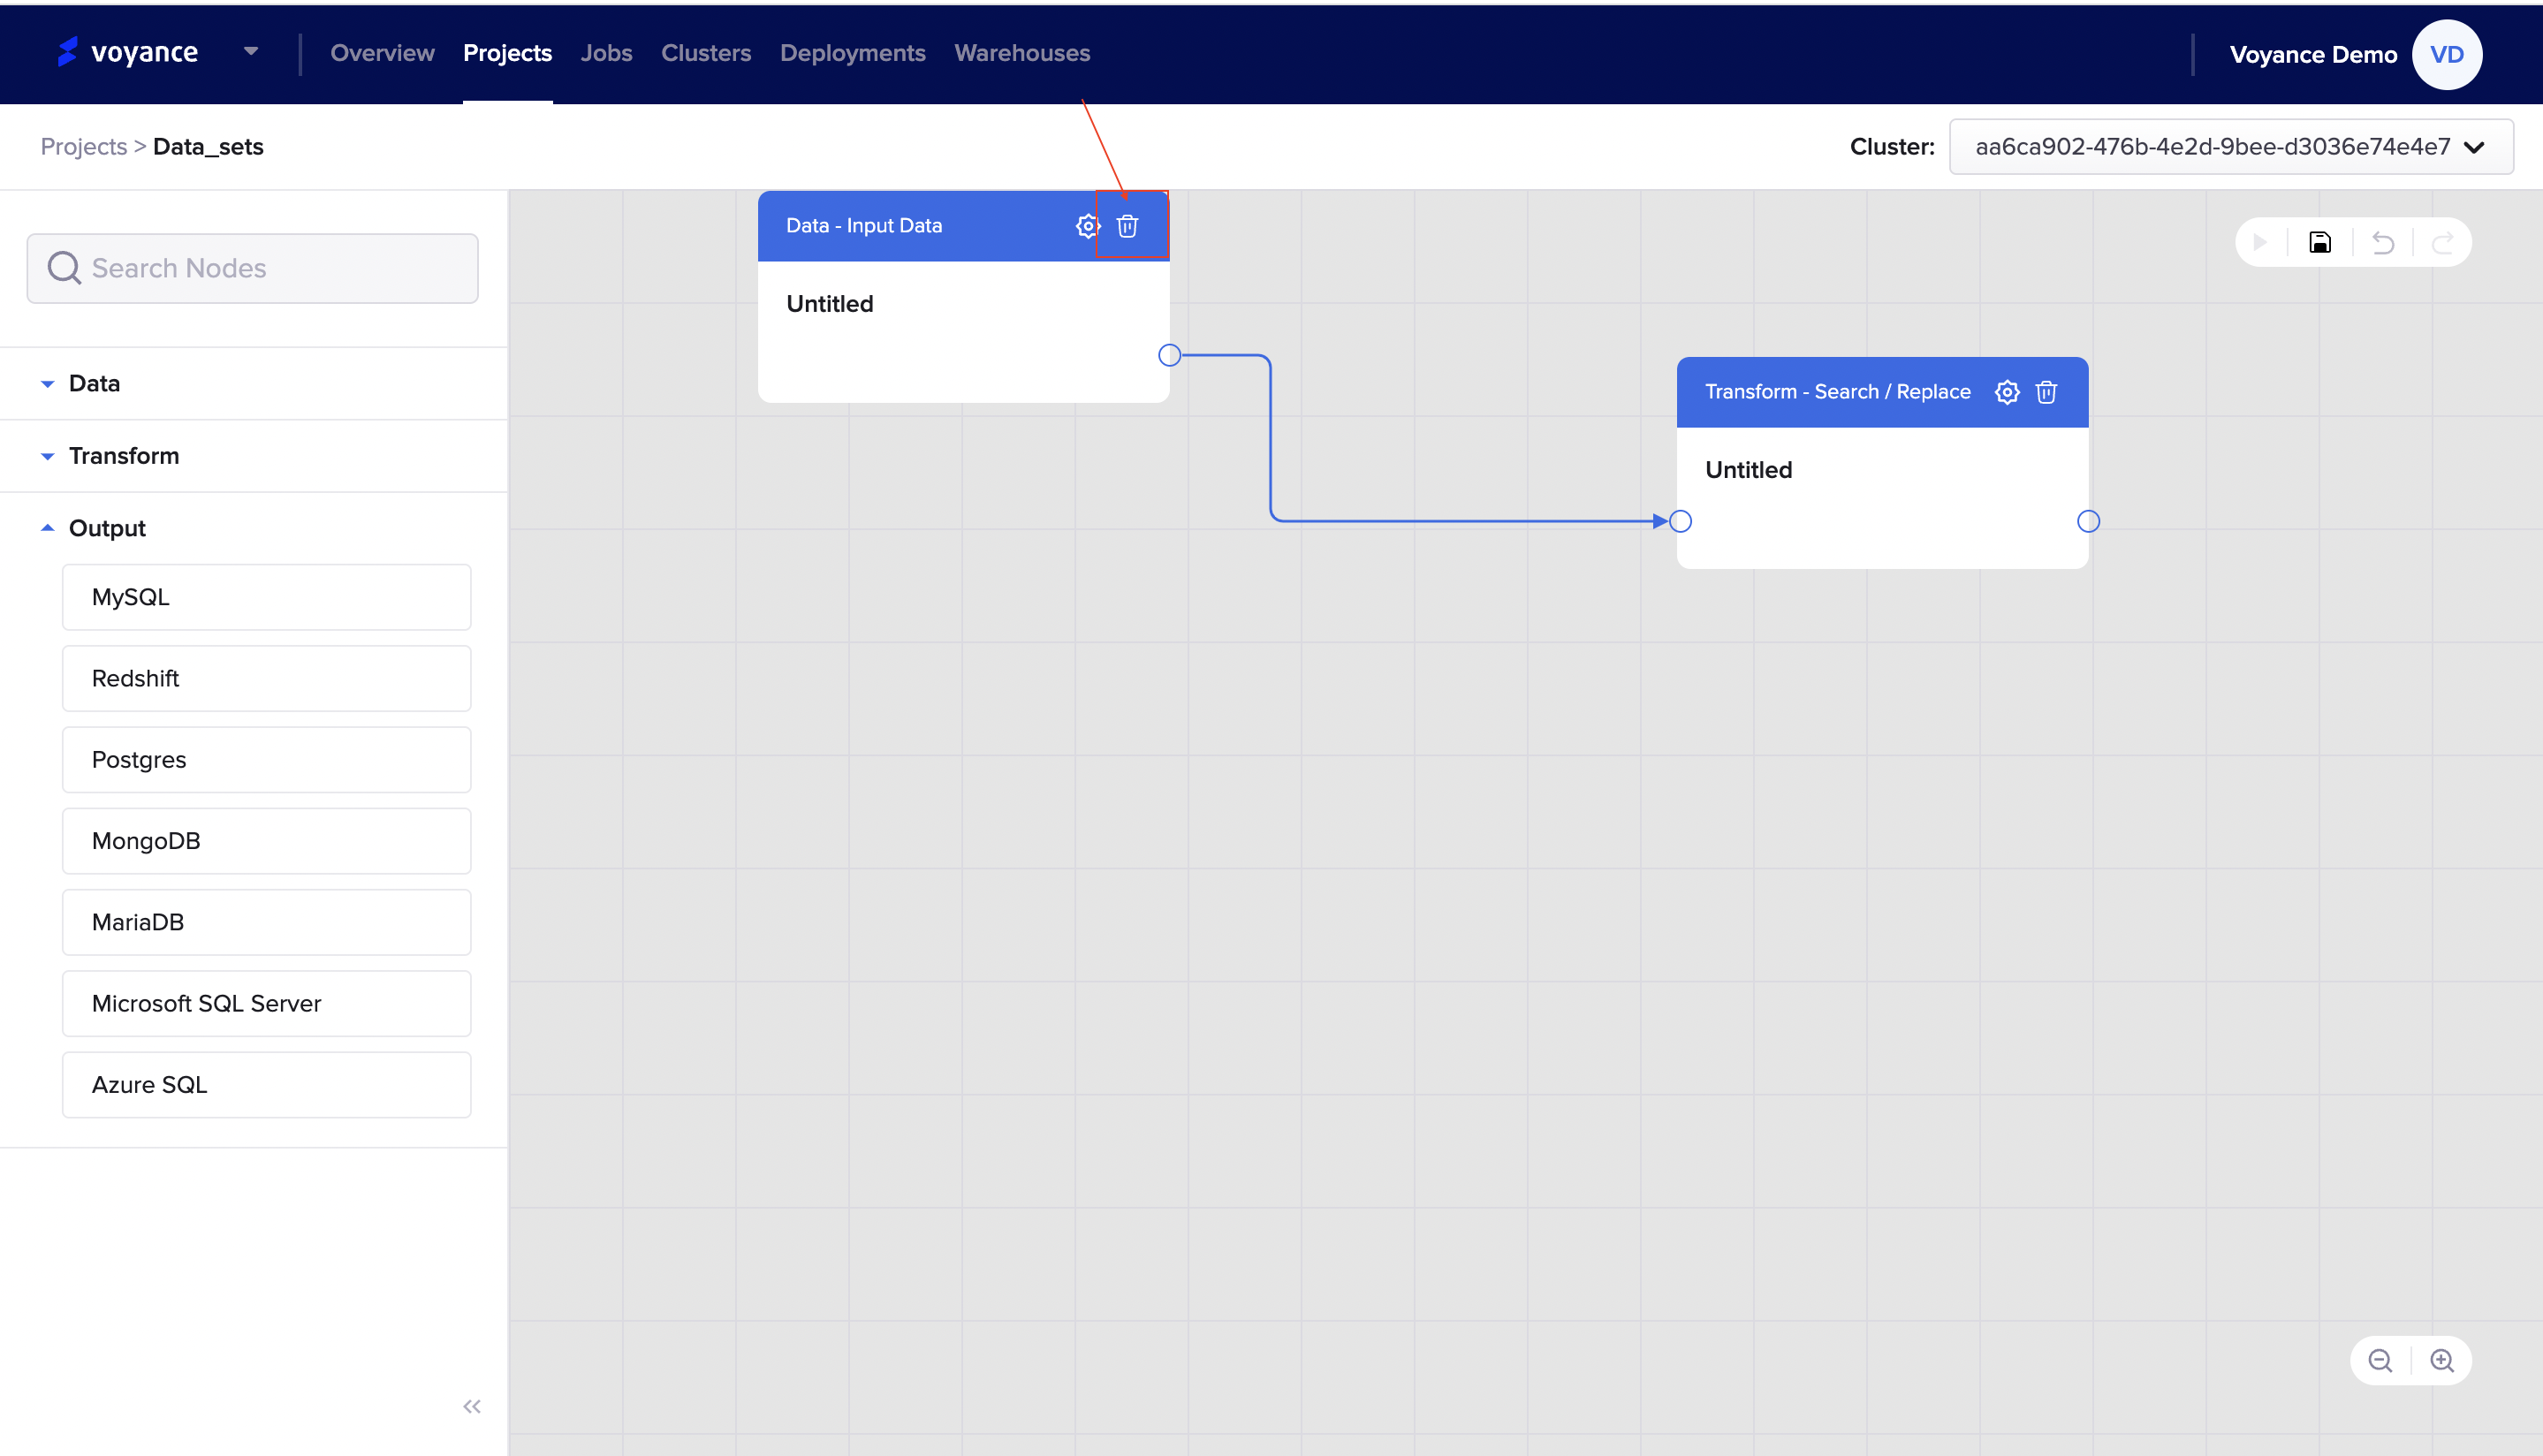
To delete the input data card that was dragged to the workflow, click on the Delete icon at the top of the dragged input data card.
Transform
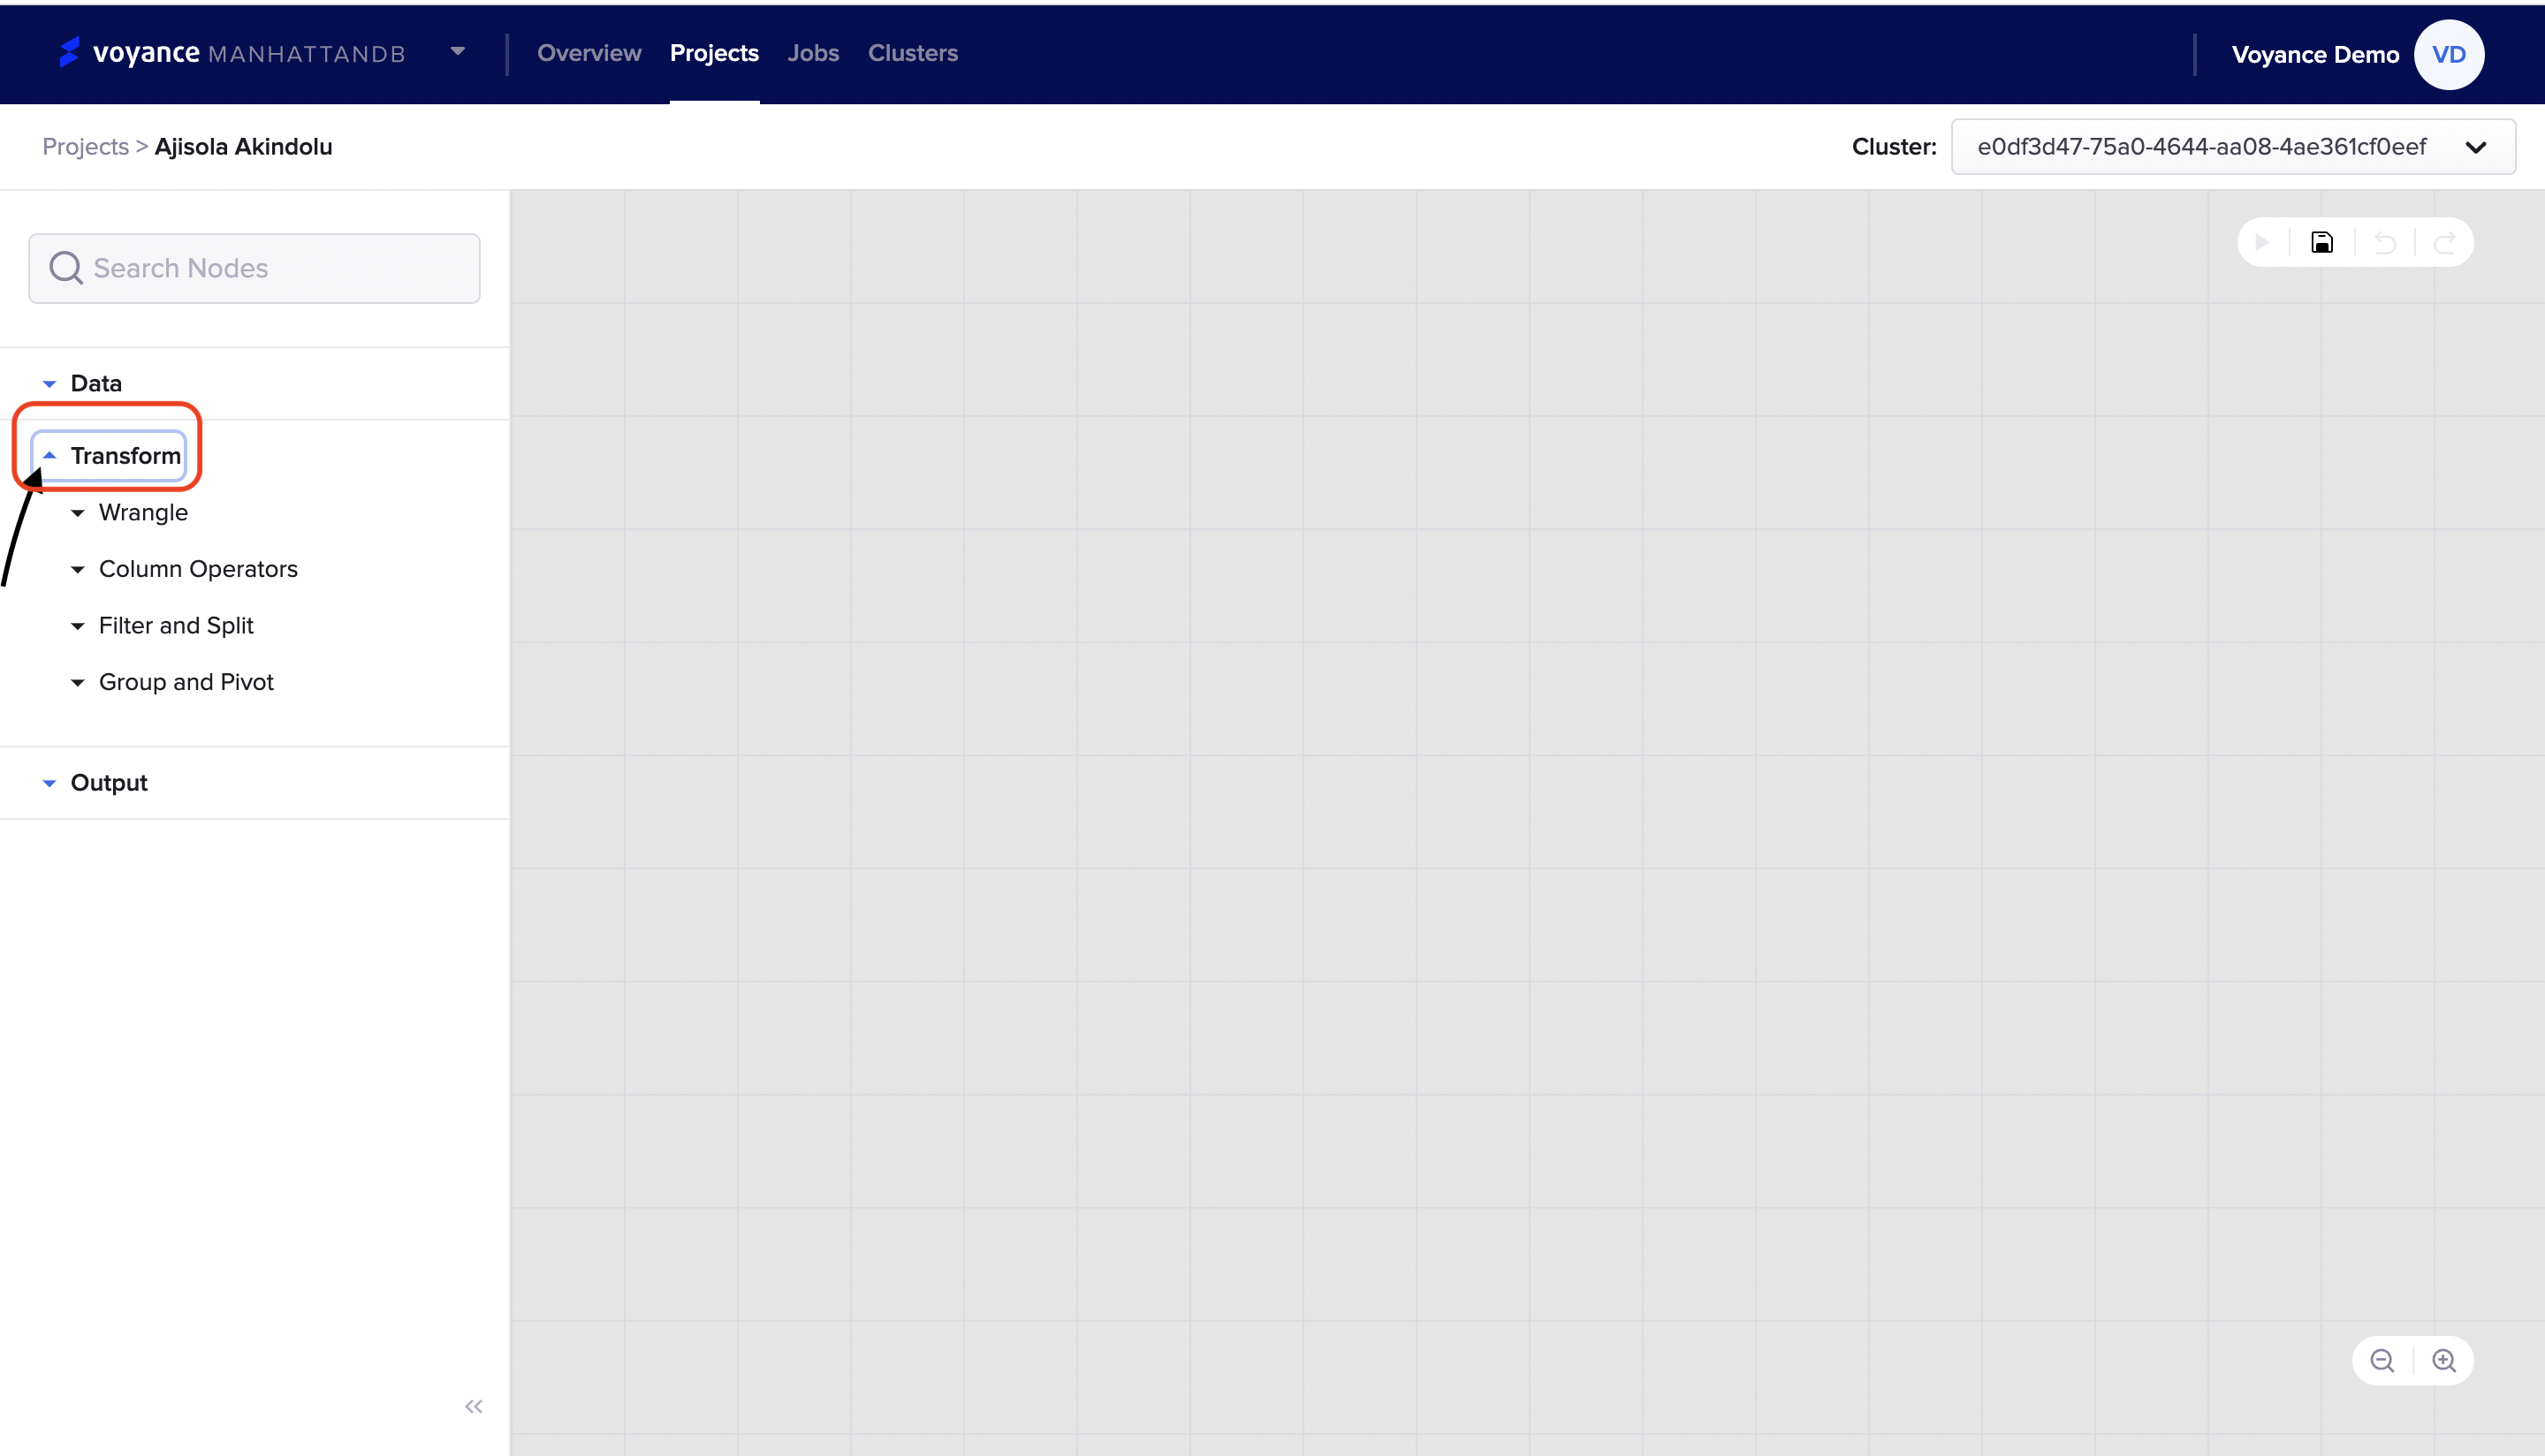
This section describes how to perform different transformation processes to have accurate and consistent data. Here, you can choose the type of transformation process for your data, with our data platform, you can choose from several transformation processes like wrangle, custom operators, filter and split, and Group and pivot
To connect to any of the transform fields/tools, click on the “Transform operator drop-down arrow", there will be a drop-down list of all the transformation tools that can be used to clean your raw data into readily used formats. Learn guidelines on how to transform data using the different transform tools.
Note
The transform feature is sub-divided into different operators
Transform data with Wrangle
With the wrangle transformation tools, you will be able to clean complex and messy data sets. Using the “Wrangle” transform tools, you can remove any data that are duplicated in nature and replace messy data with the correct set of data.
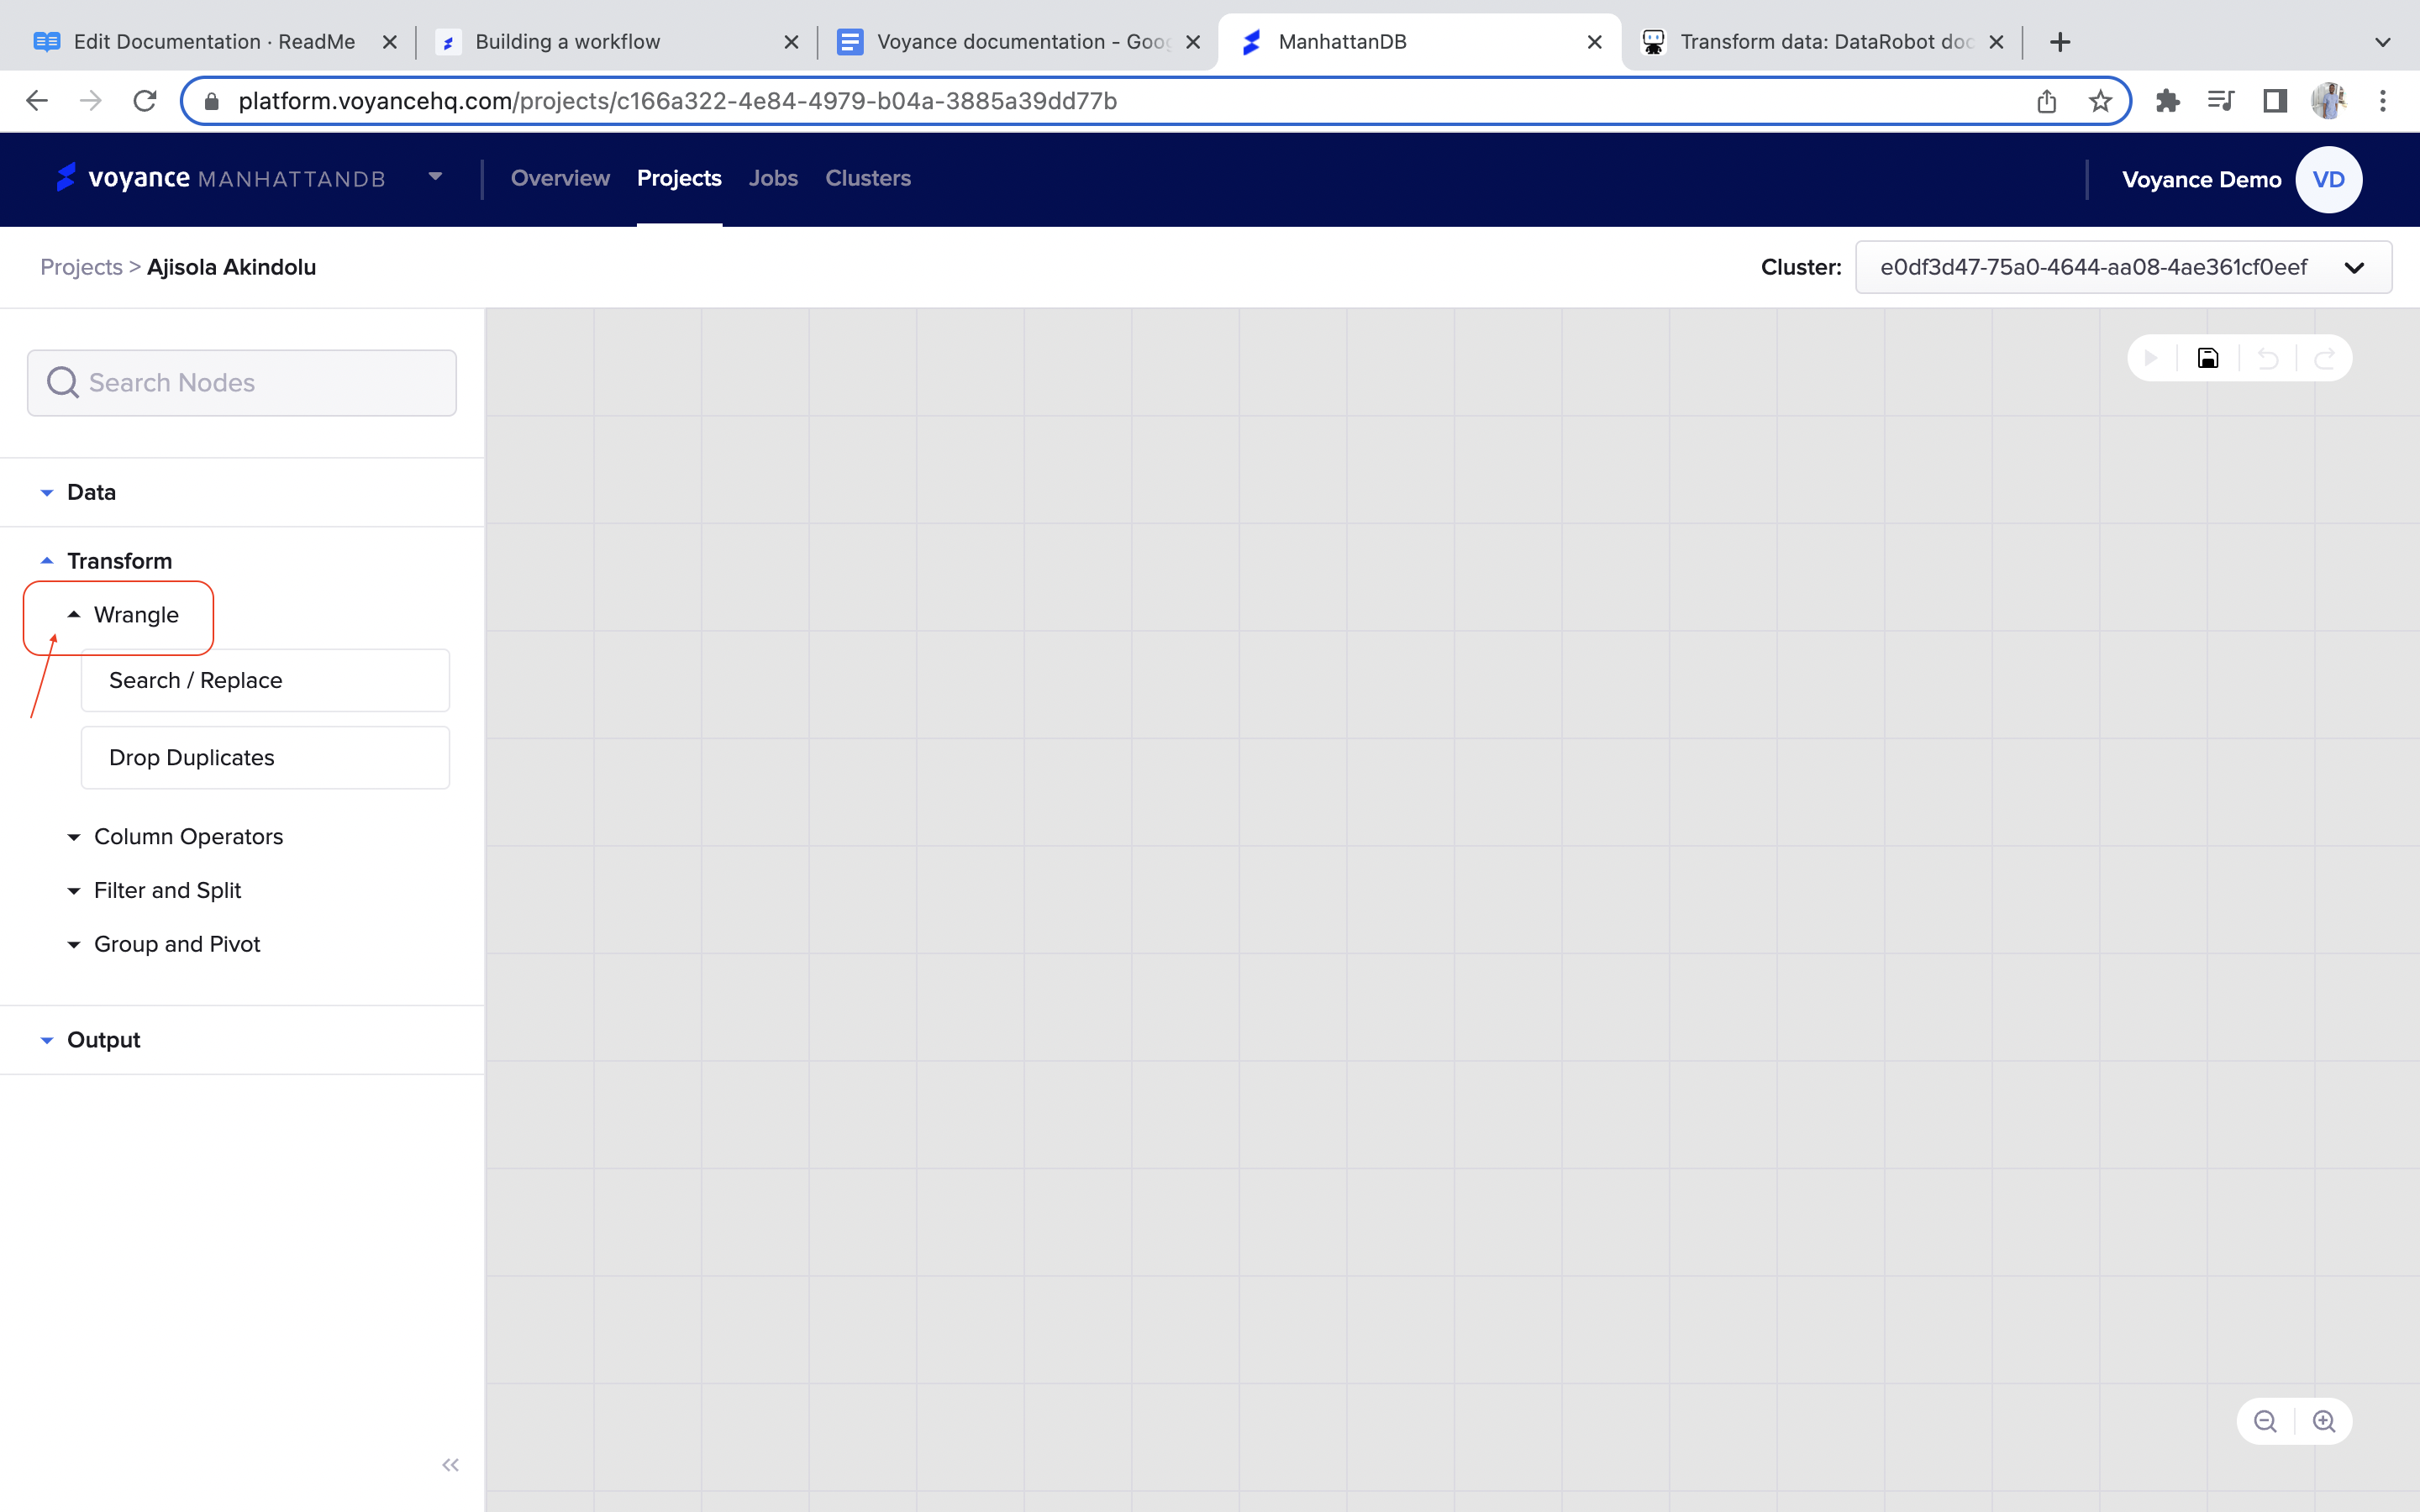
To transform data with the “Wrangle operator tools” click on the “Transform>Wrangle arrow field". Under the “Wrangle” there is some set of drop-down option fields to choose from “Search/ Replace and Drop Duplicates” which you use to clean and structure your data. We will be considering each of these “Wrangle operators fields/parameters” in full detail:
Search/Replace
To search/replace data, click and drag the “Search/Replace” dialog box to the project workflow which enables you to search data from one point to another.
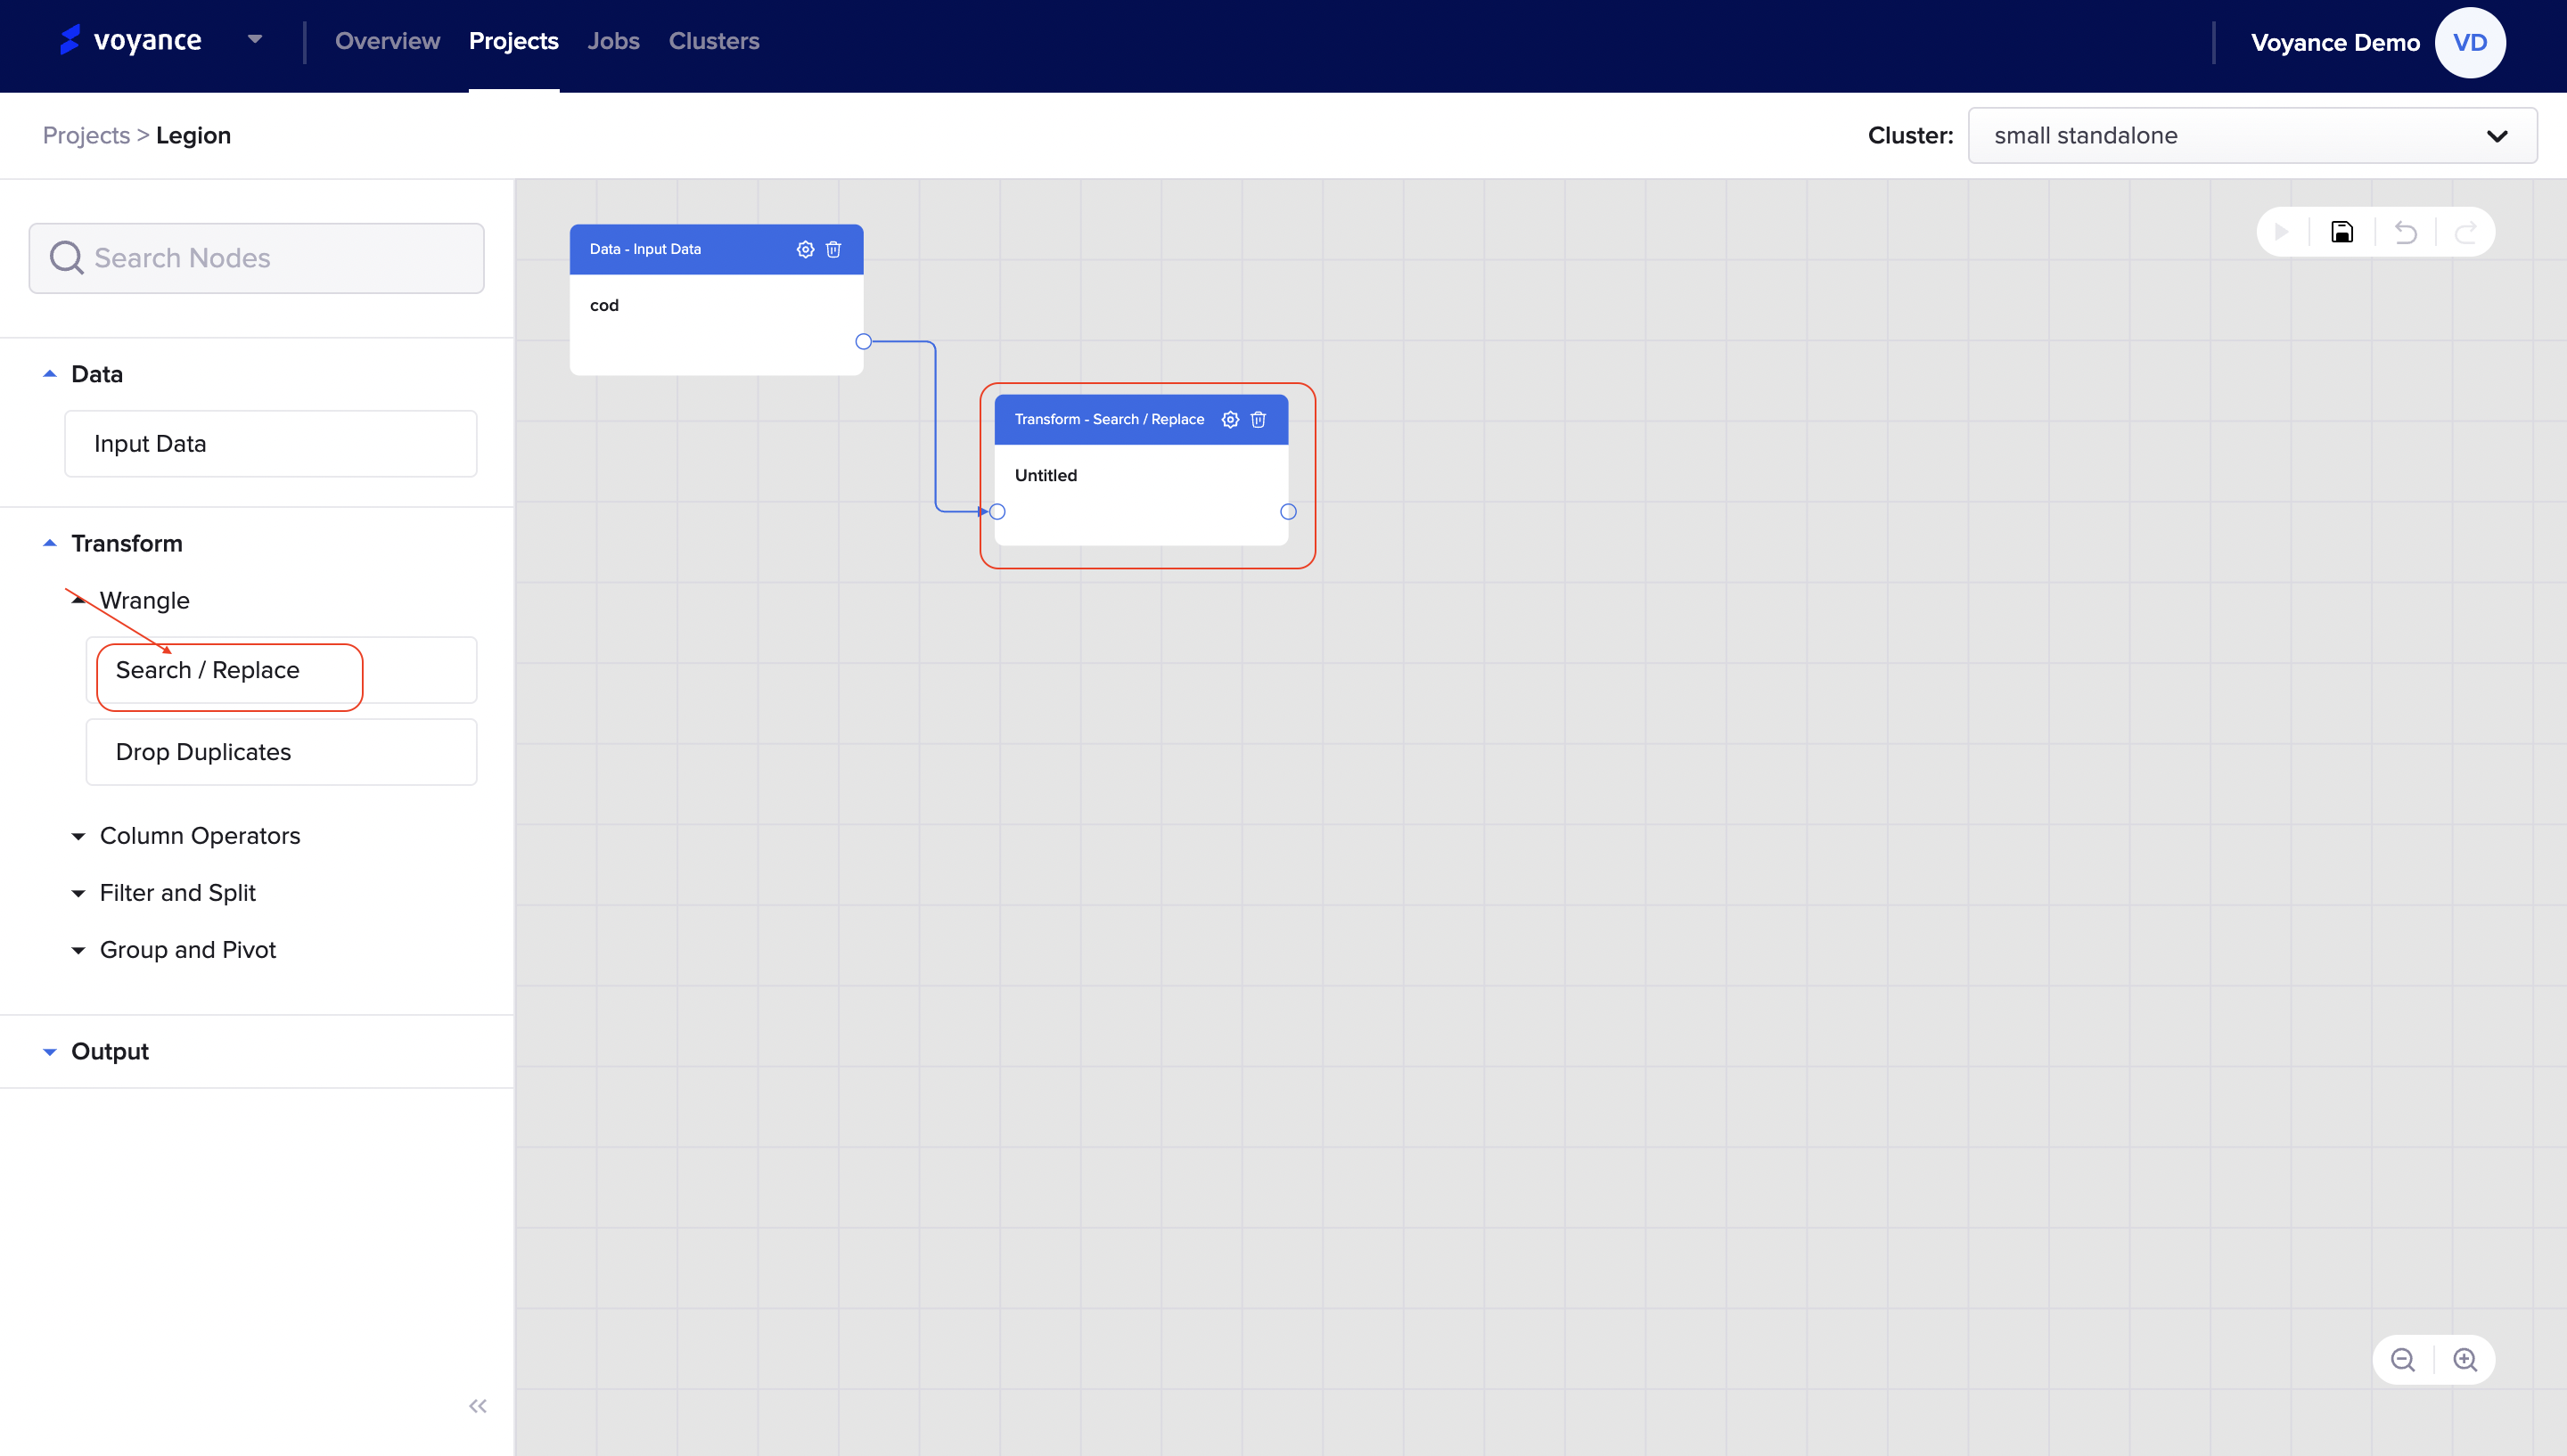
Edit the Search/Replace
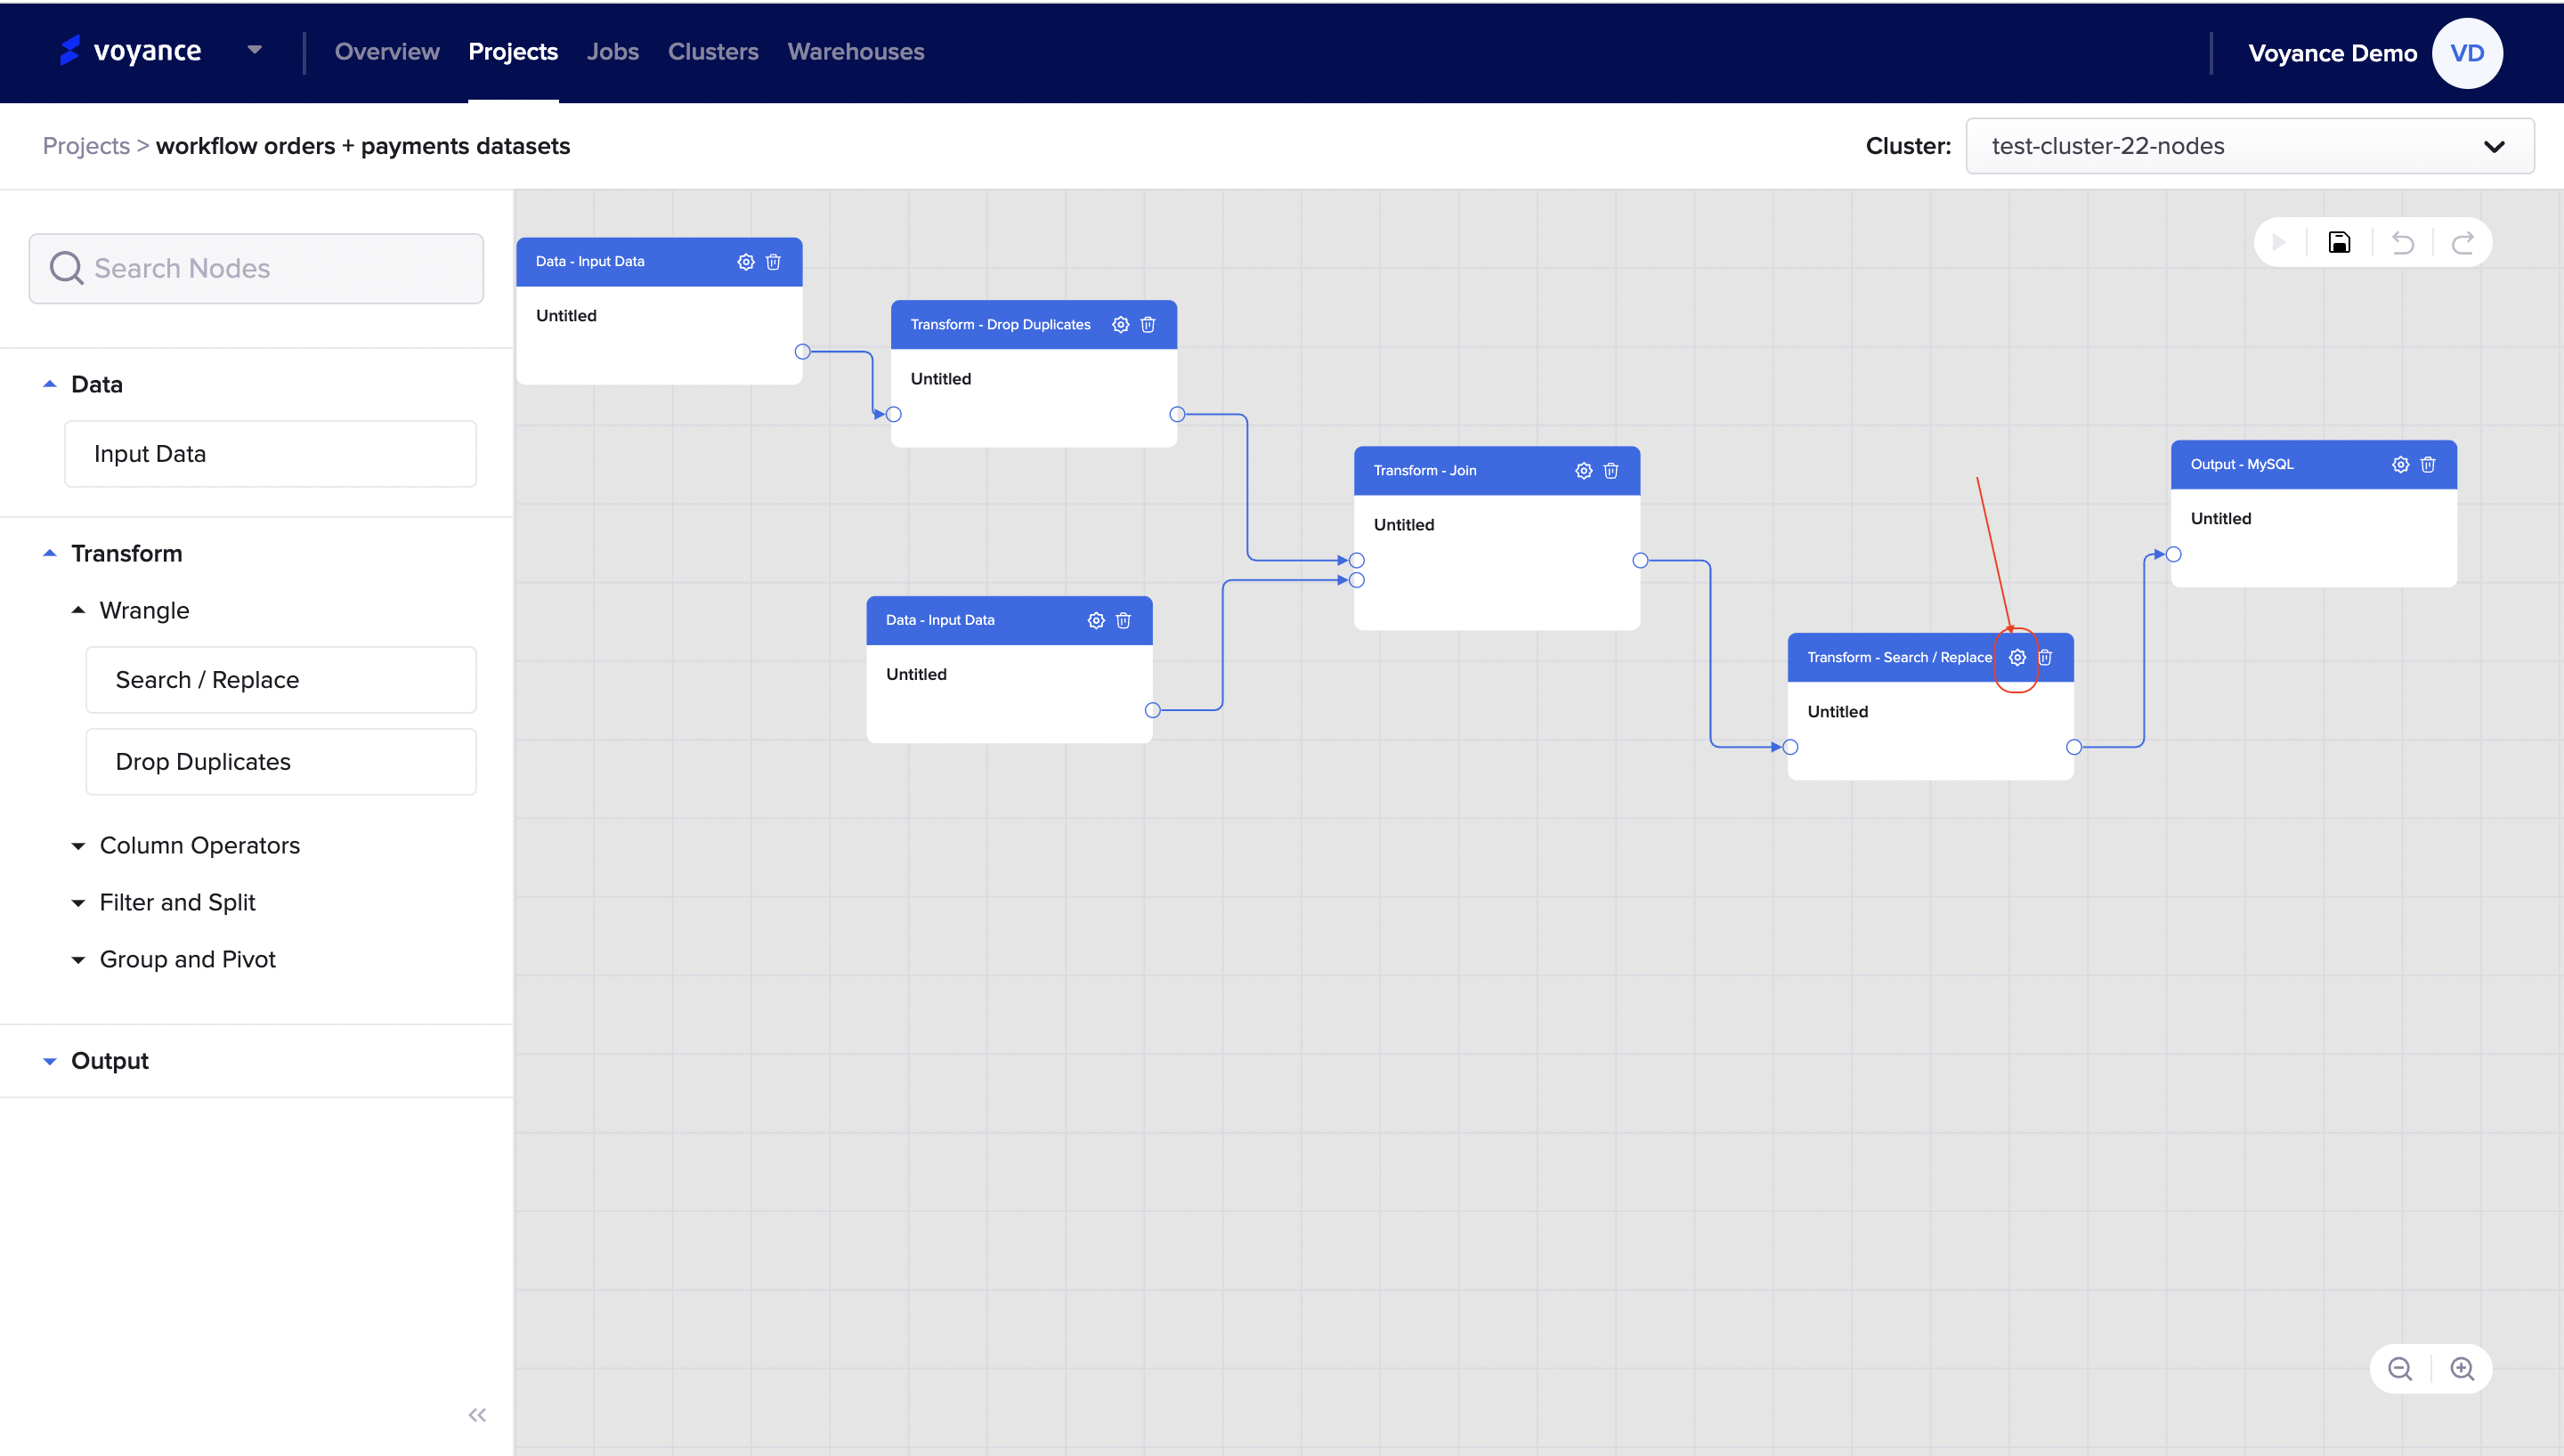
To edit the “search/replace dialog box”, click on the “Settings icon” at the top-right of the dragged “search/replace” dialog box,
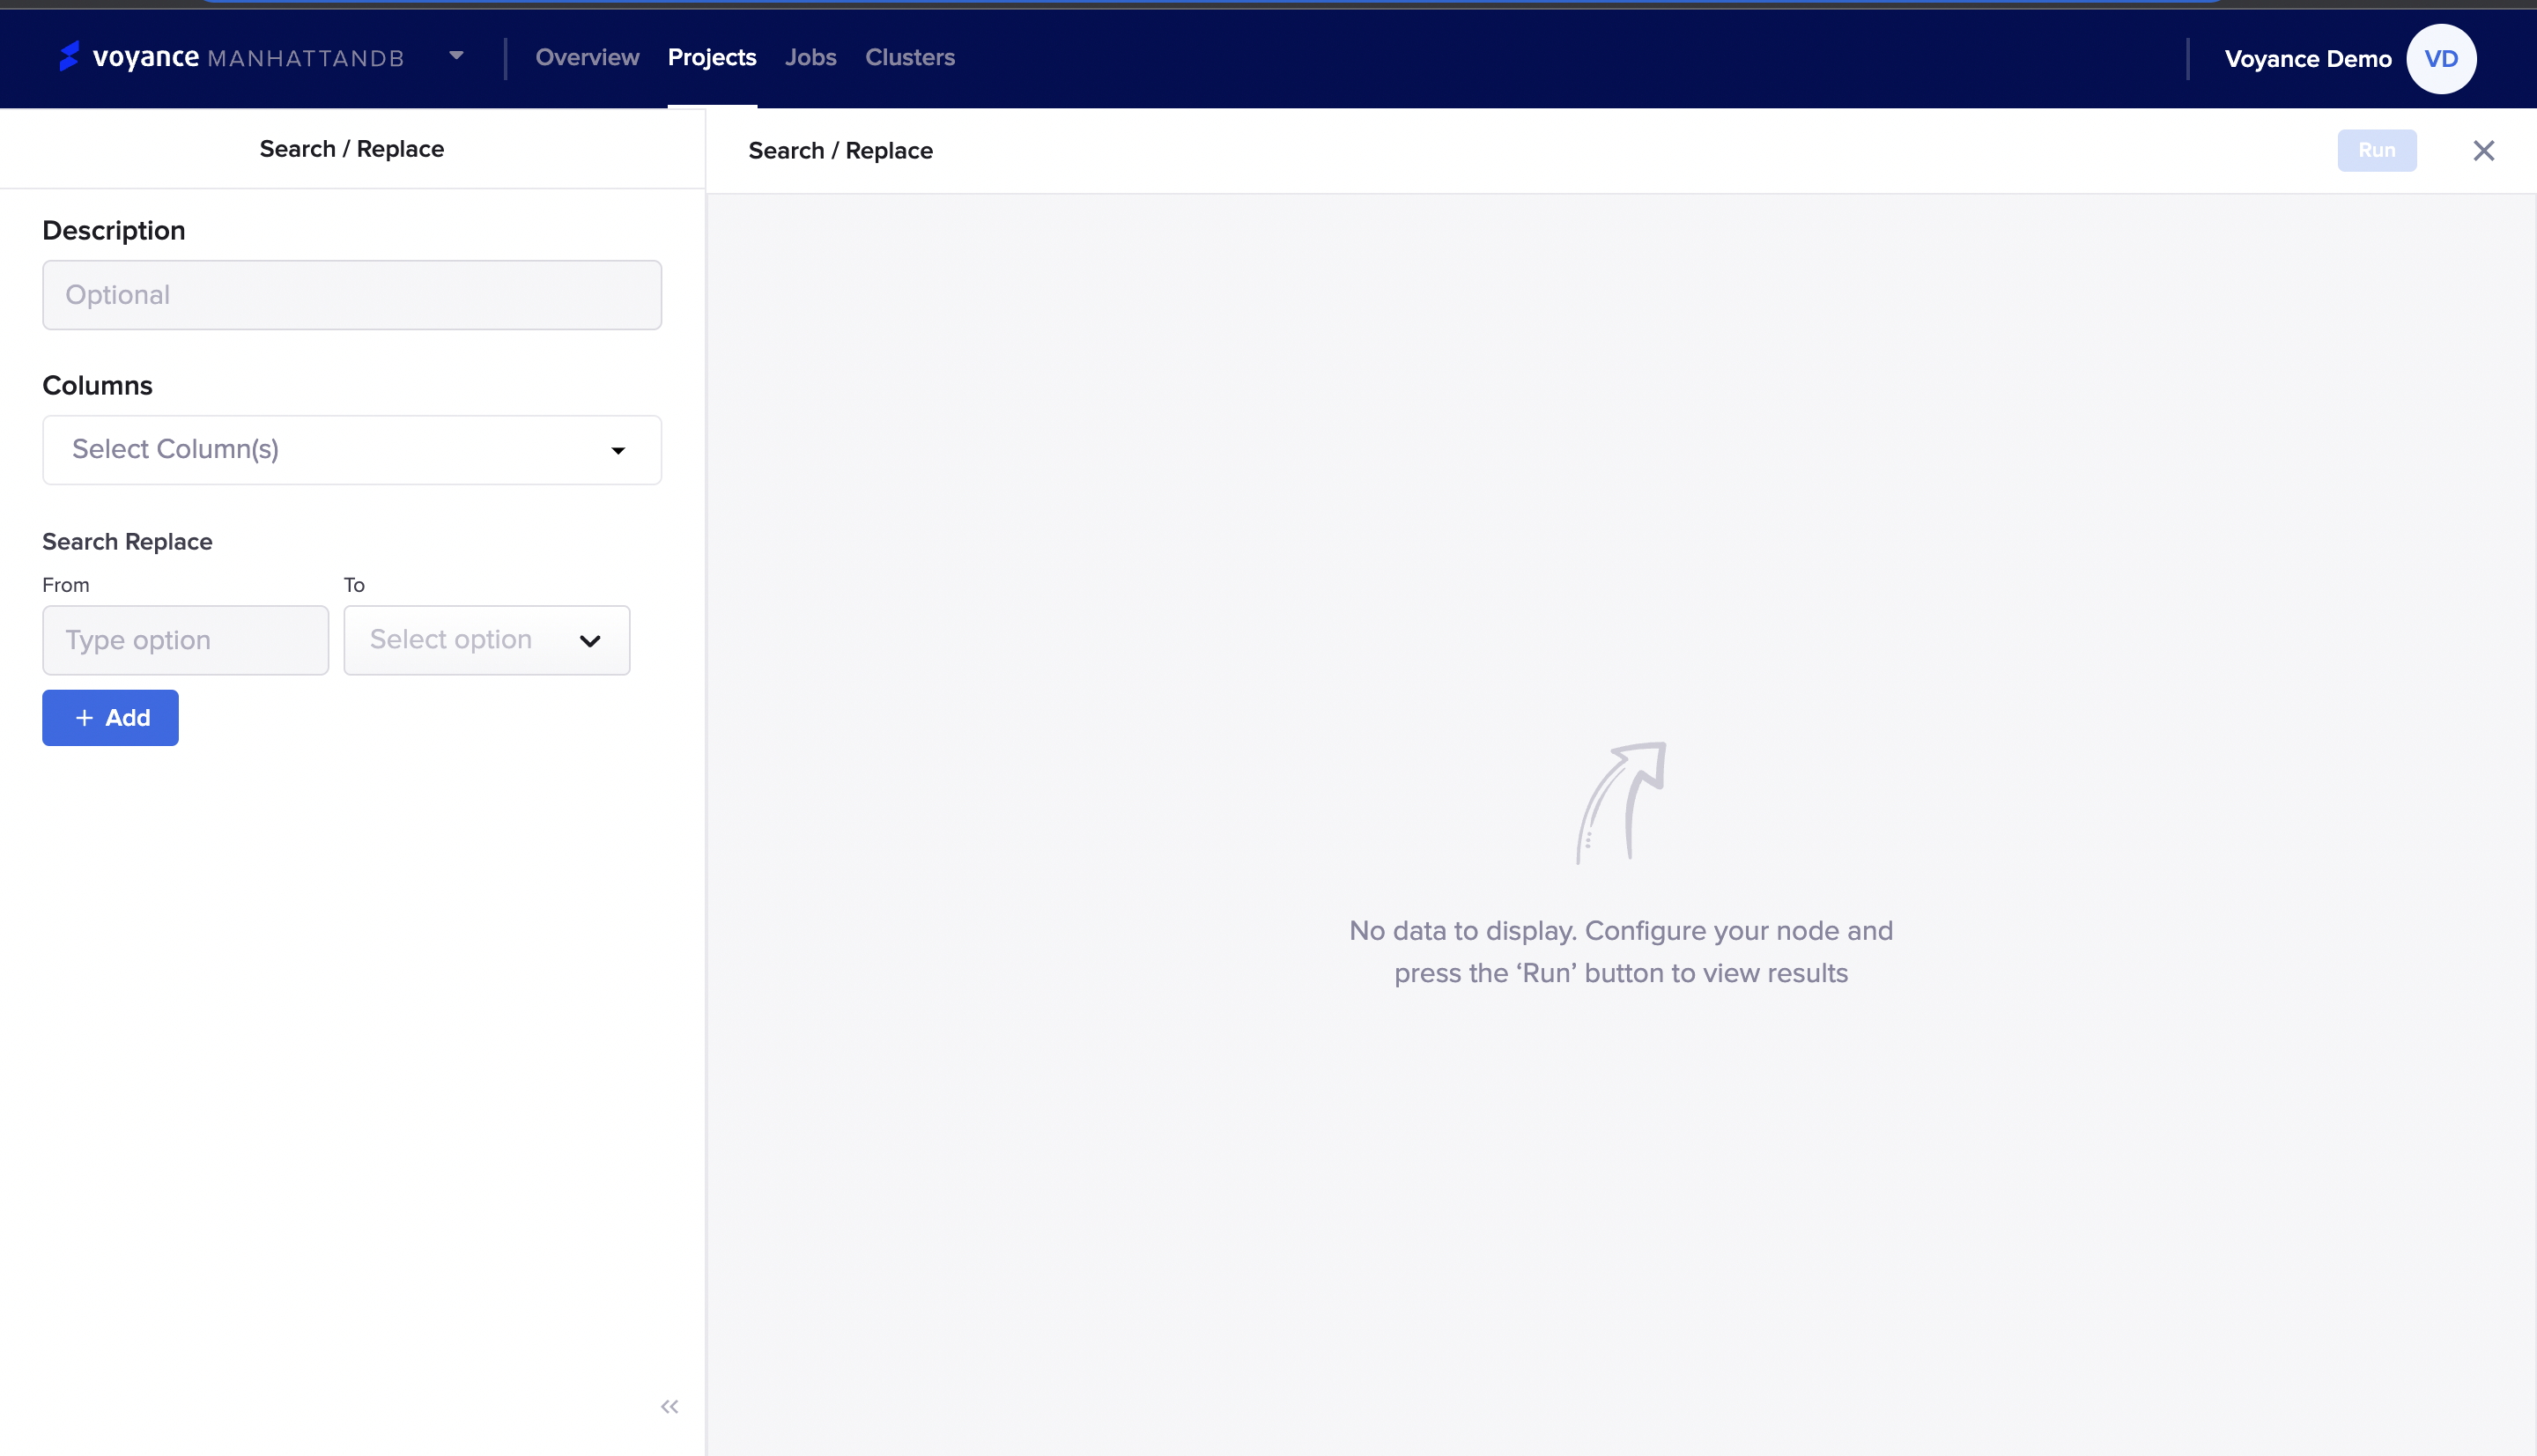
you will be redirected to the search/replace page to fill in the details of the data you want to replace. The following elements in the search/replace dialog box include:
Description: This is the name you want to use to describe the data you want to search/replace
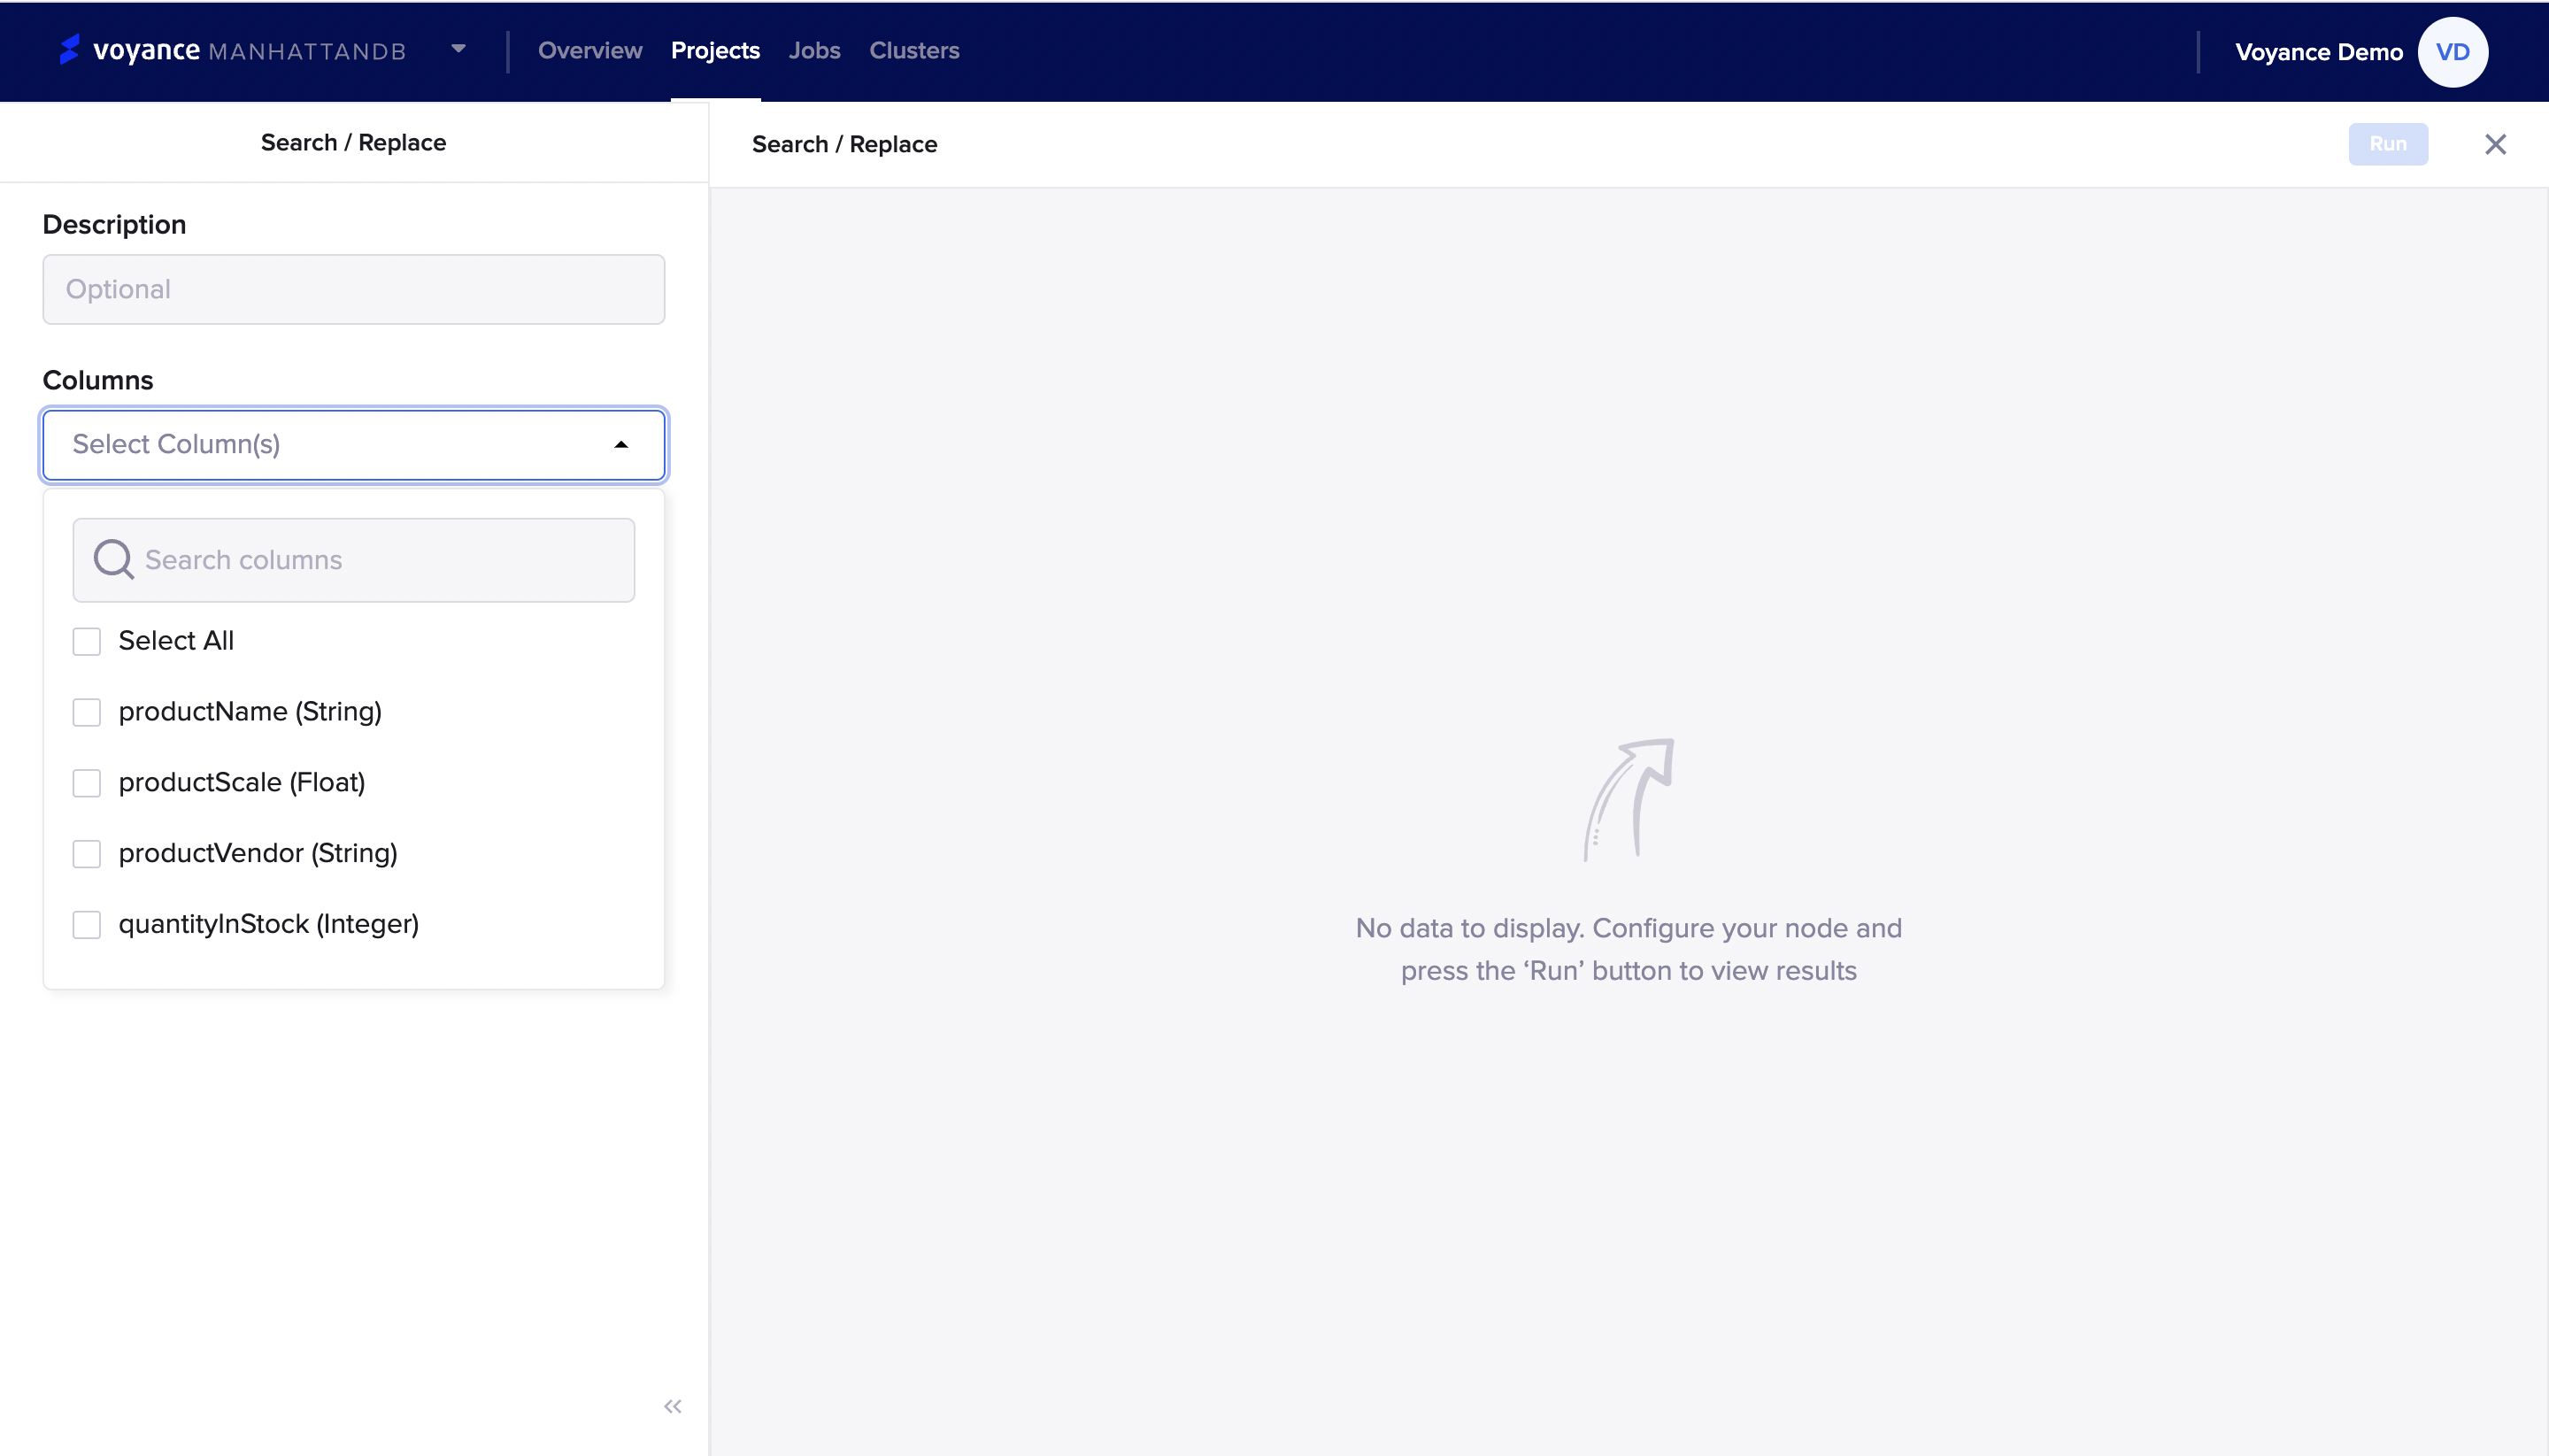
Columns: This entails the sets of data types or sets of data values which you want to replace. To select the column(s), You have the option to “Select All” or choose the columns you want to use for replacement. Some of the data options include:
Note:
Any description or title that is given on any of the transform capabilities will appear on each of the transform dialog boxes on the workflow
Click on the “Column arrow icon” at the top-left, there will be a drop-down option which you can use for search-replace. Click on the column checkboxes to select the columns you want to use. you can select multiple column fields.
Type the "From option" for the search/replace and click on the drop-down to select a "To option" for the search/replace page. You have the option to add more than one search/replace option, just click on the "Add tab" to add more options.
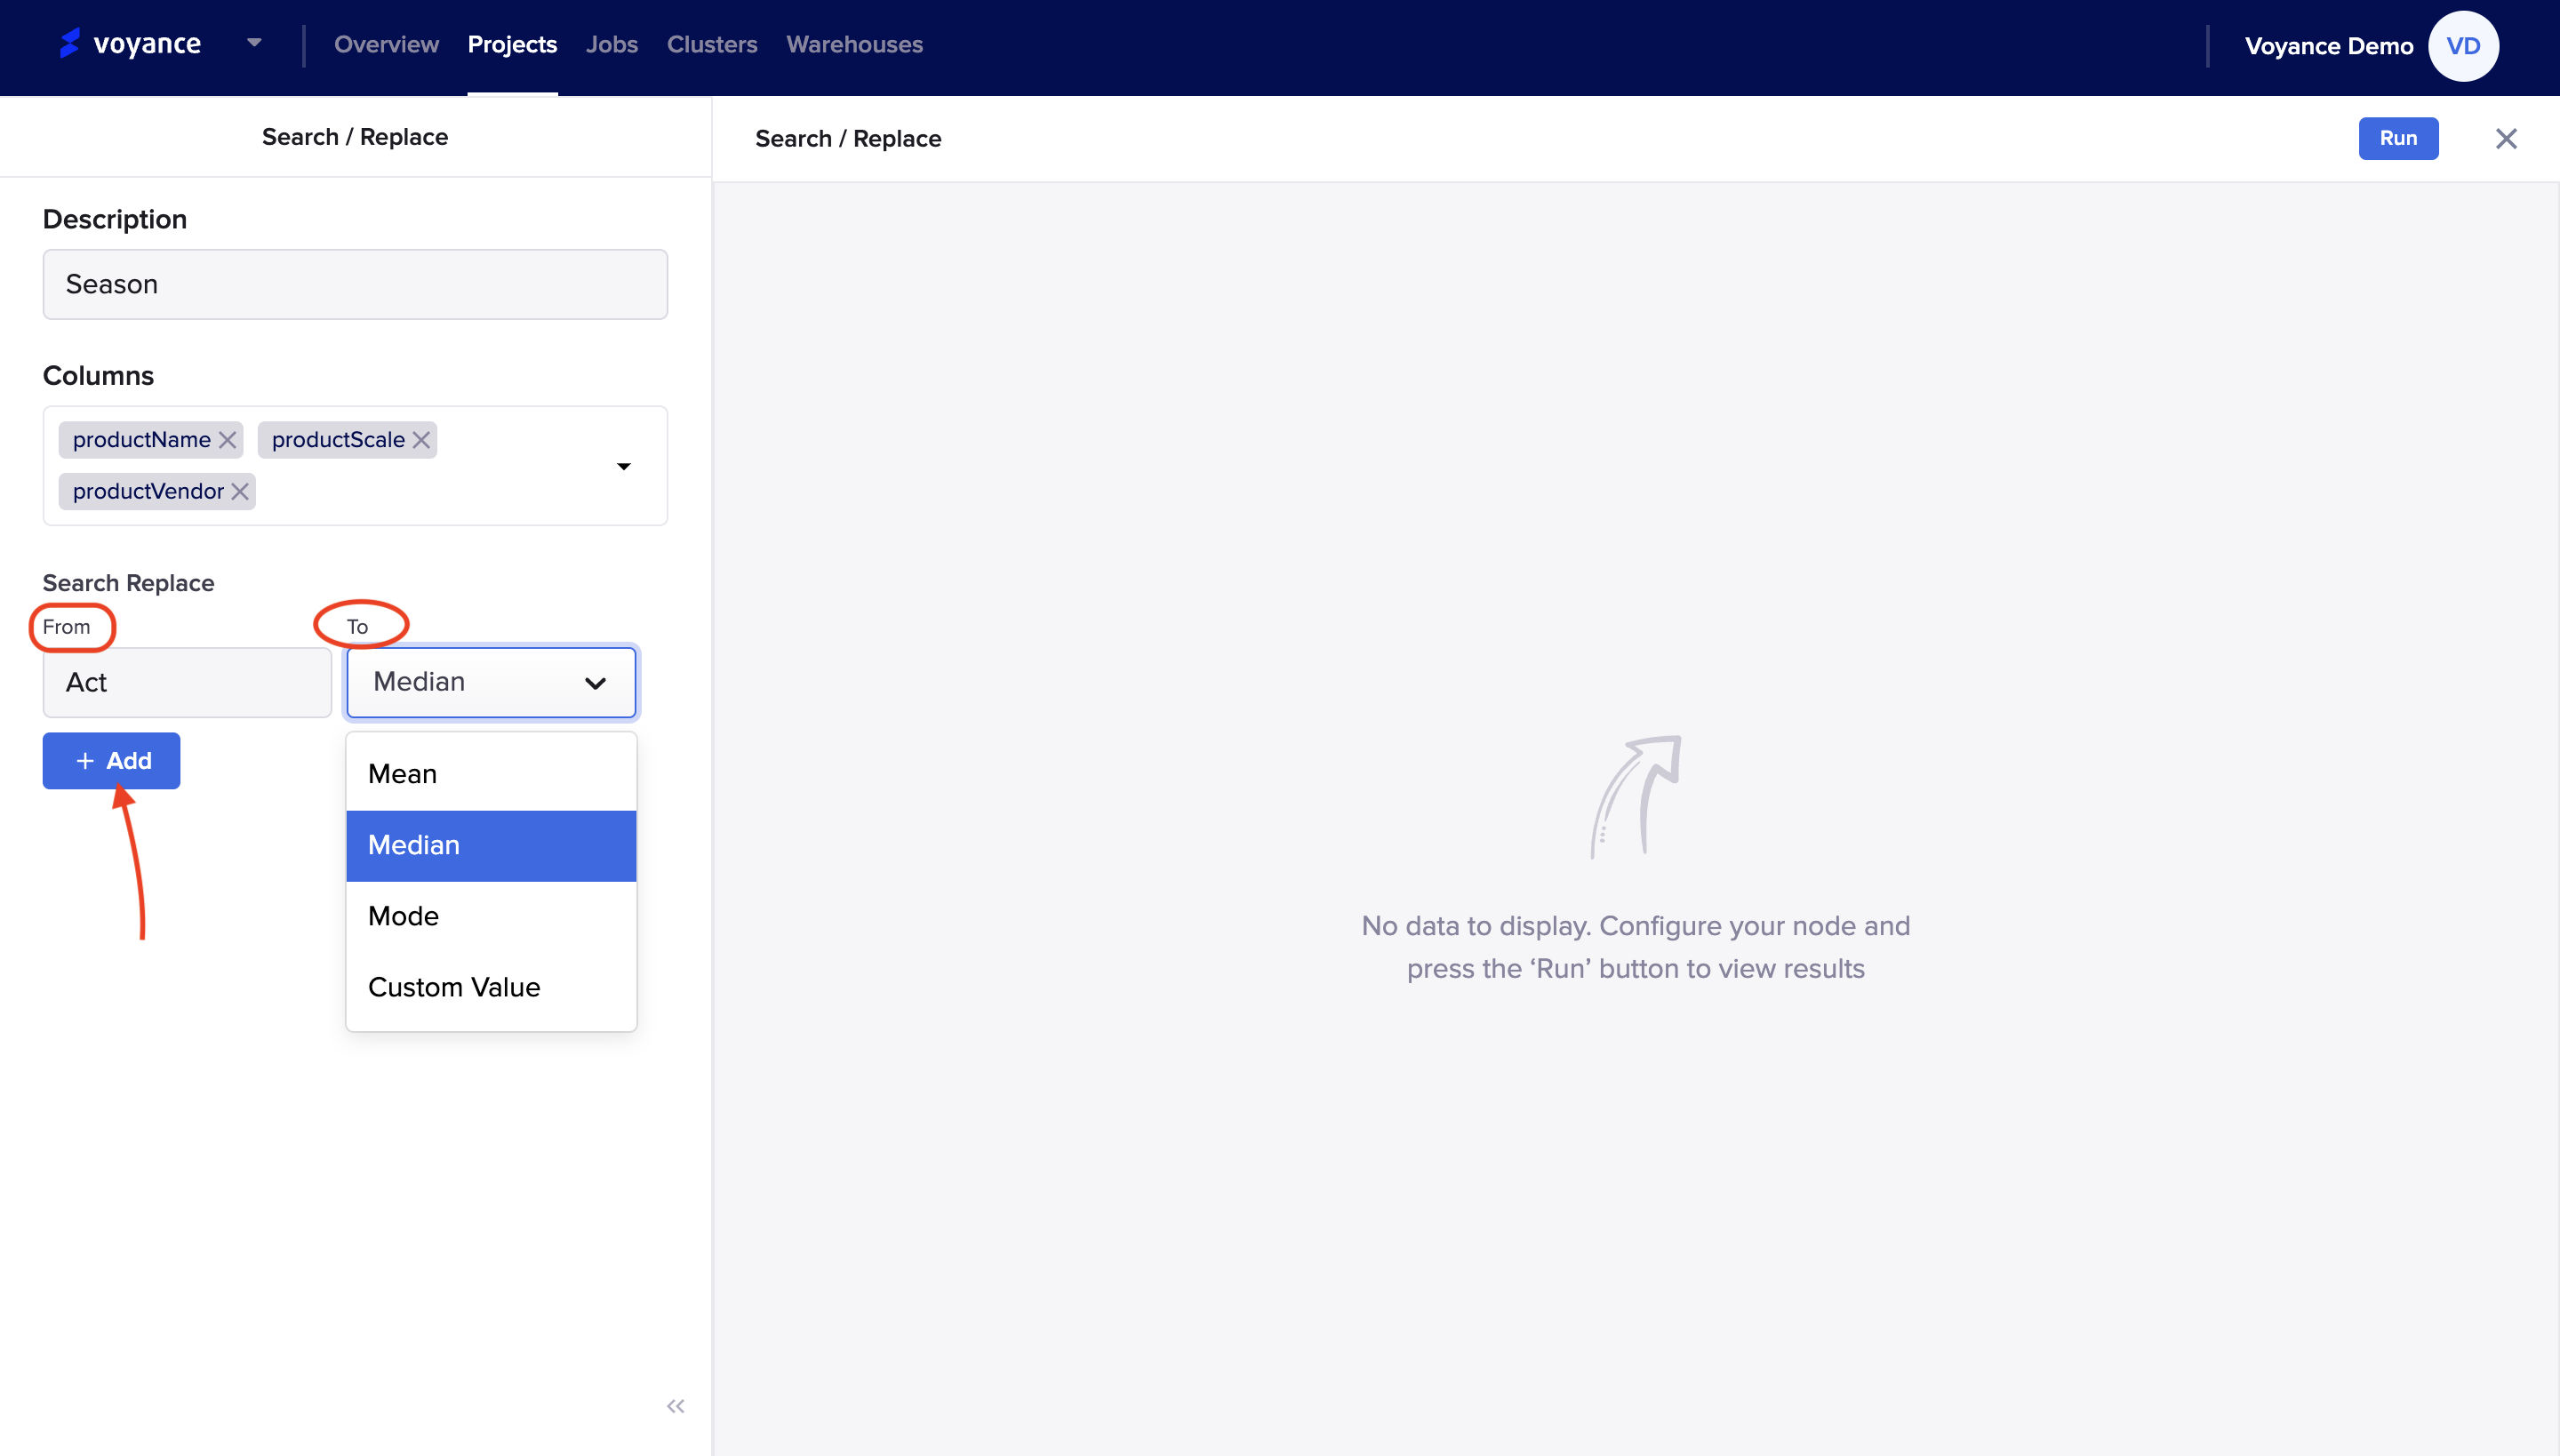
Run Program
After you have filled in the data which you want to search/replace on your dataset, click on "Run" at the top-right of the search/replace dashboard to analyze your data.
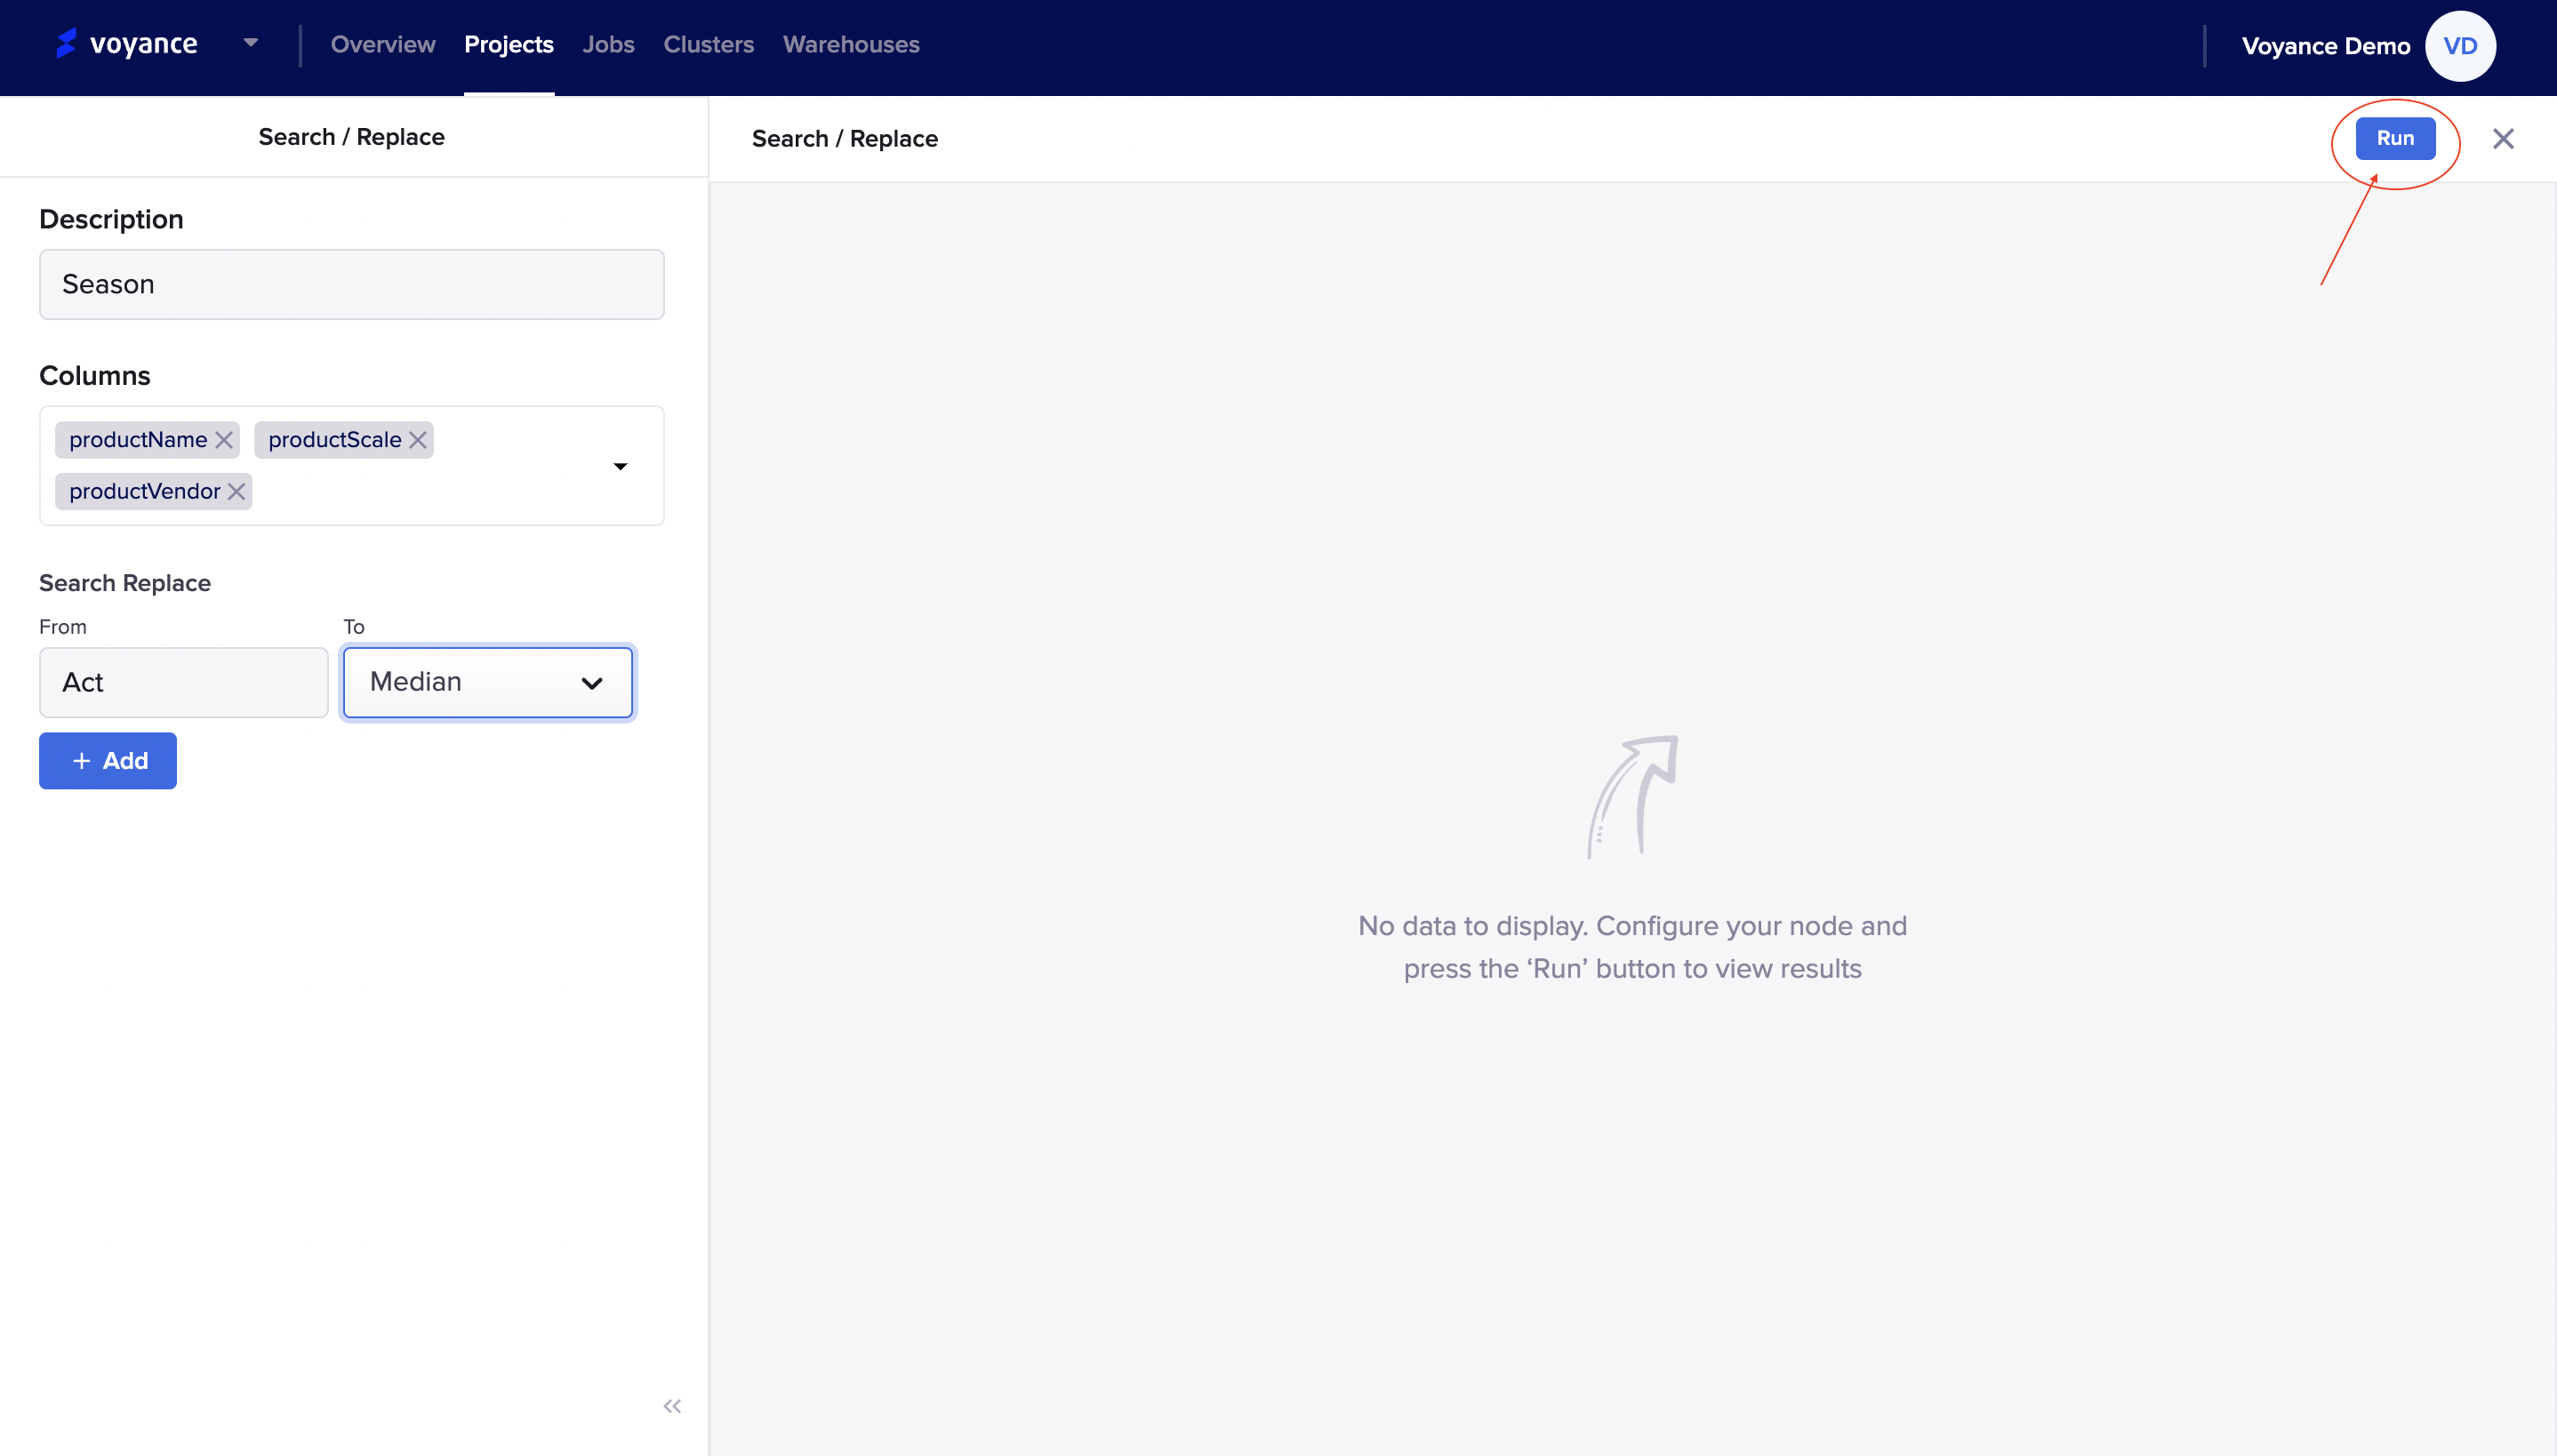
Delete search/replace Card **
To delete the search/replace card that was dragged to the workflow, click on the Delete icon at the top of the dragged search/replace field on the workflow.
Note
Every Description given by you on any transform operators field will show/appear on the dialog box of the operator on the workflow.
Drop Duplicate
Drop Duplicate is the process of removing duplicates from data frames. with our data platform, you can remove any form of duplicates from your data using our wrangle tools. The drop duplicate is part of a transformation process that is under the wrangle tools.
To drop duplicates, click and drag the "Drop Duplicate operator" under the Transform feature tools
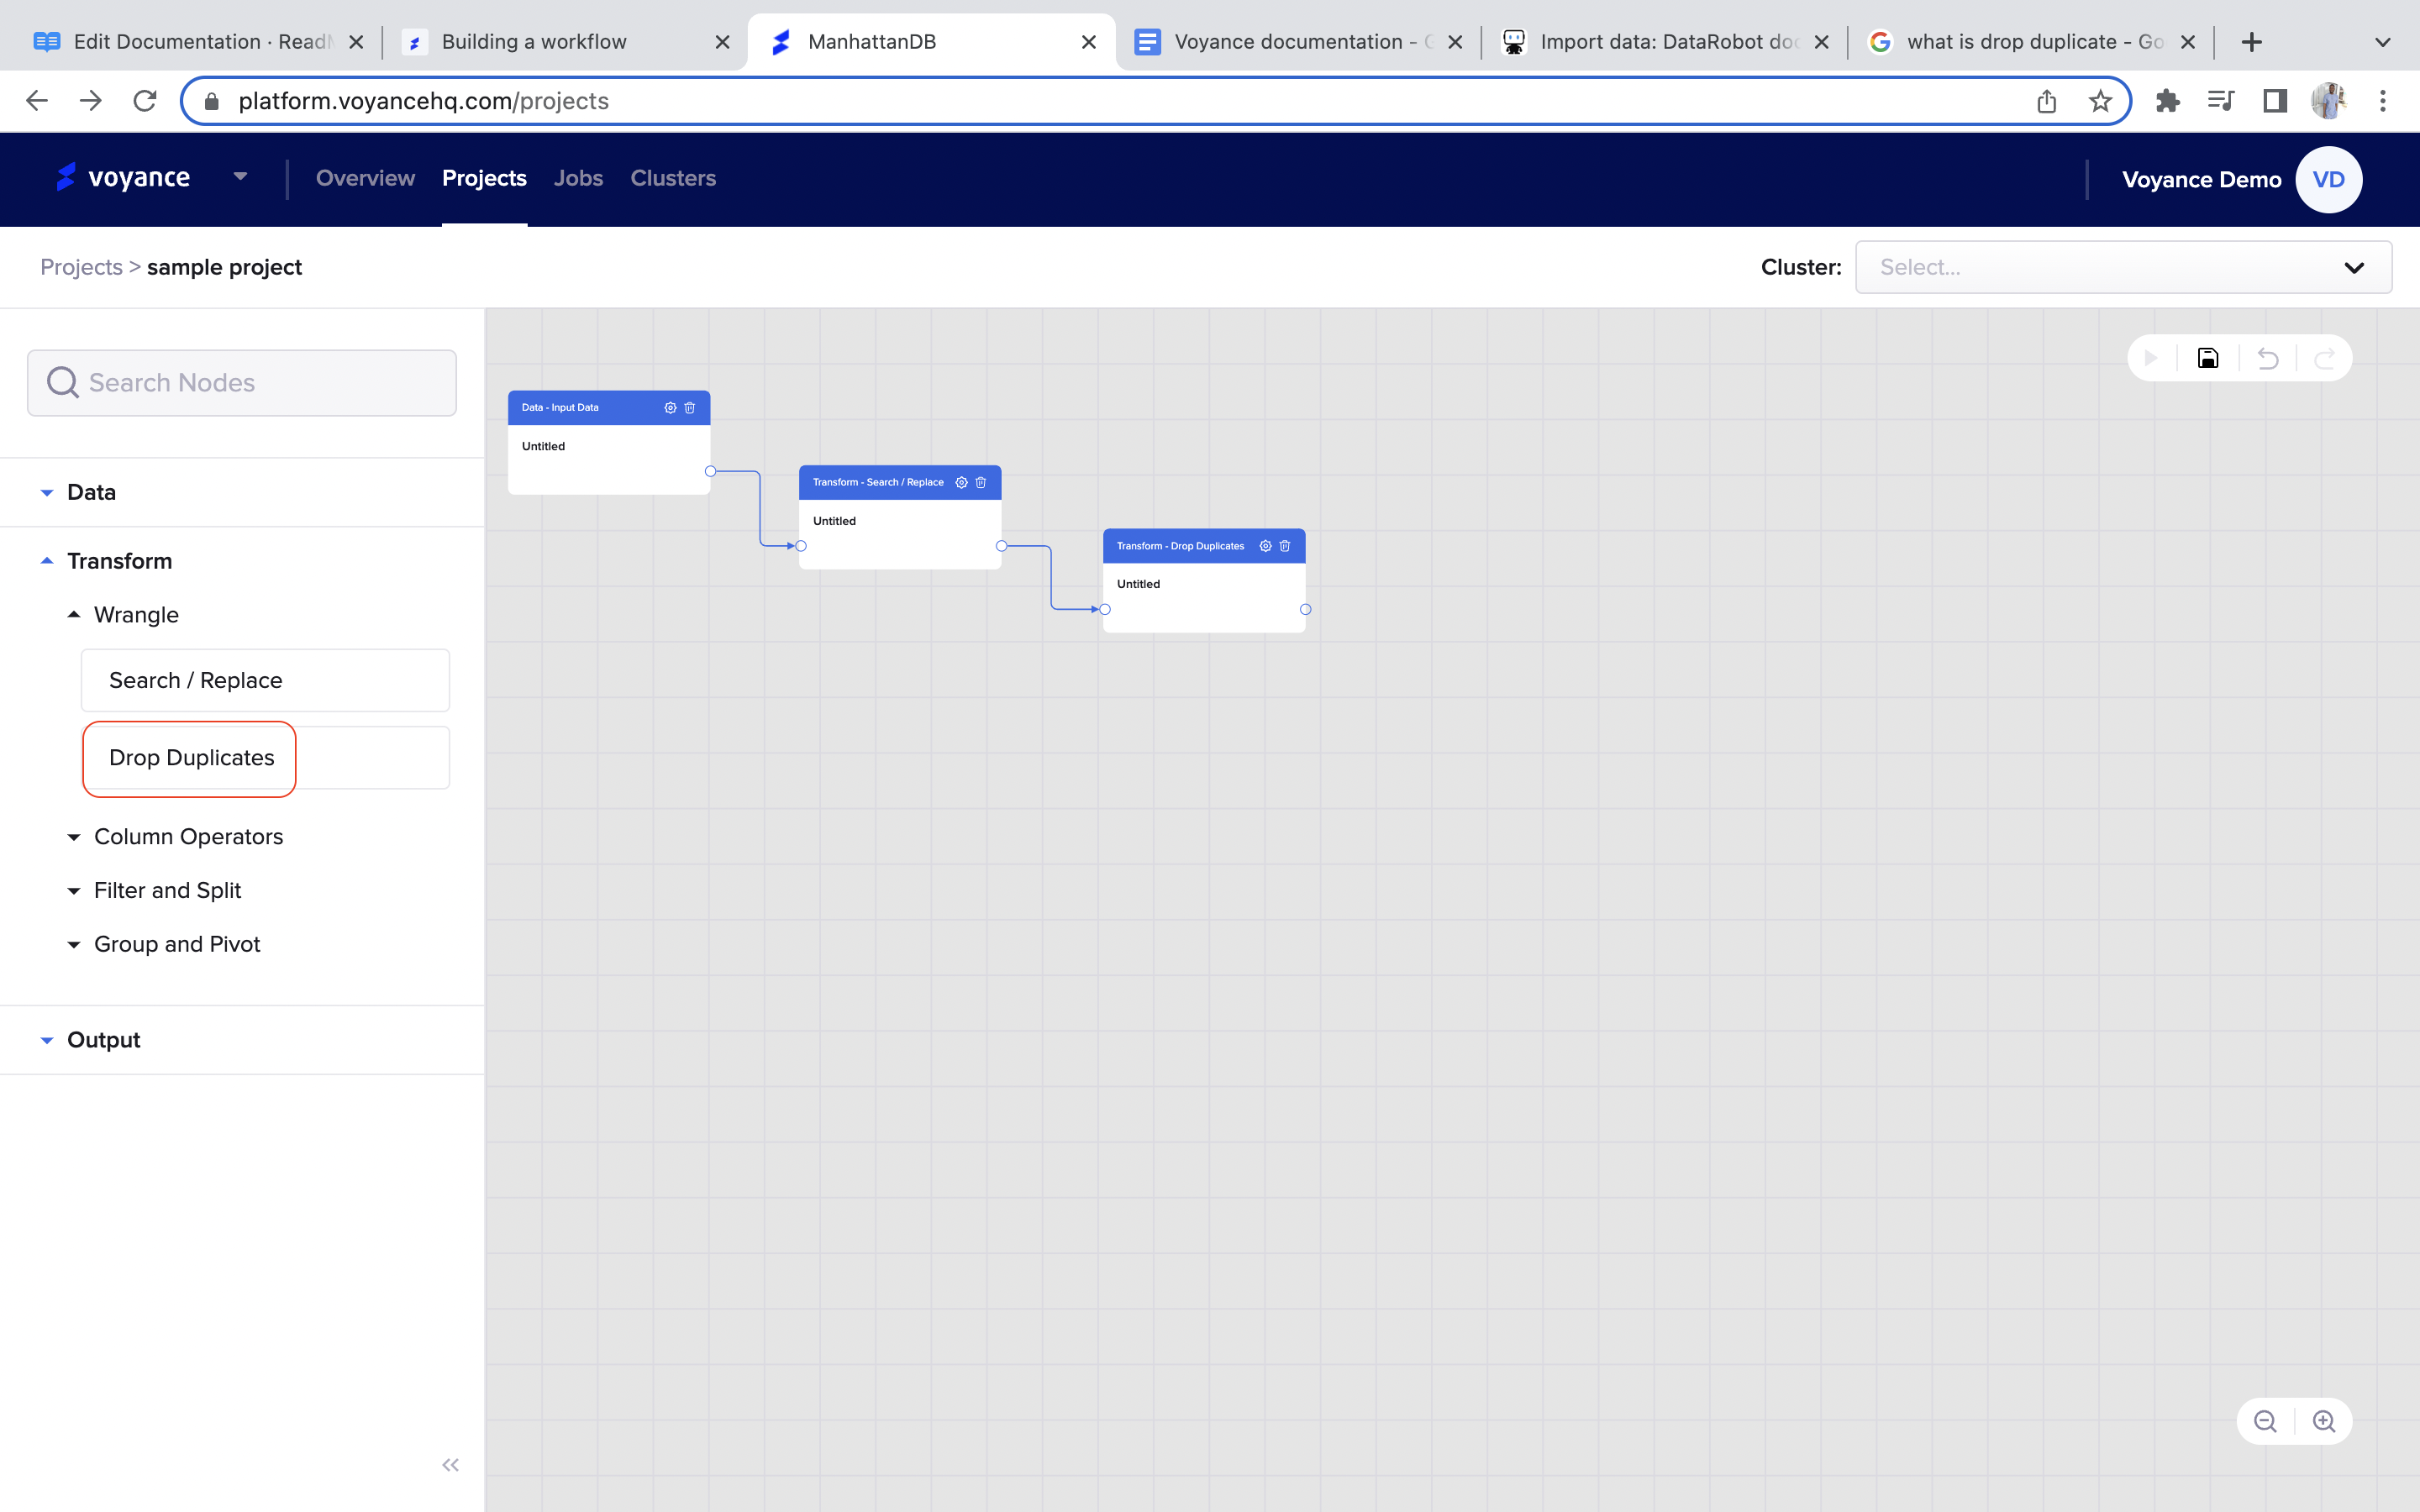
Drop Duplicate Editor
To edit the drop duplicate dialog box, click on the settings icon at the top of the dragged drop duplicate dialog box.
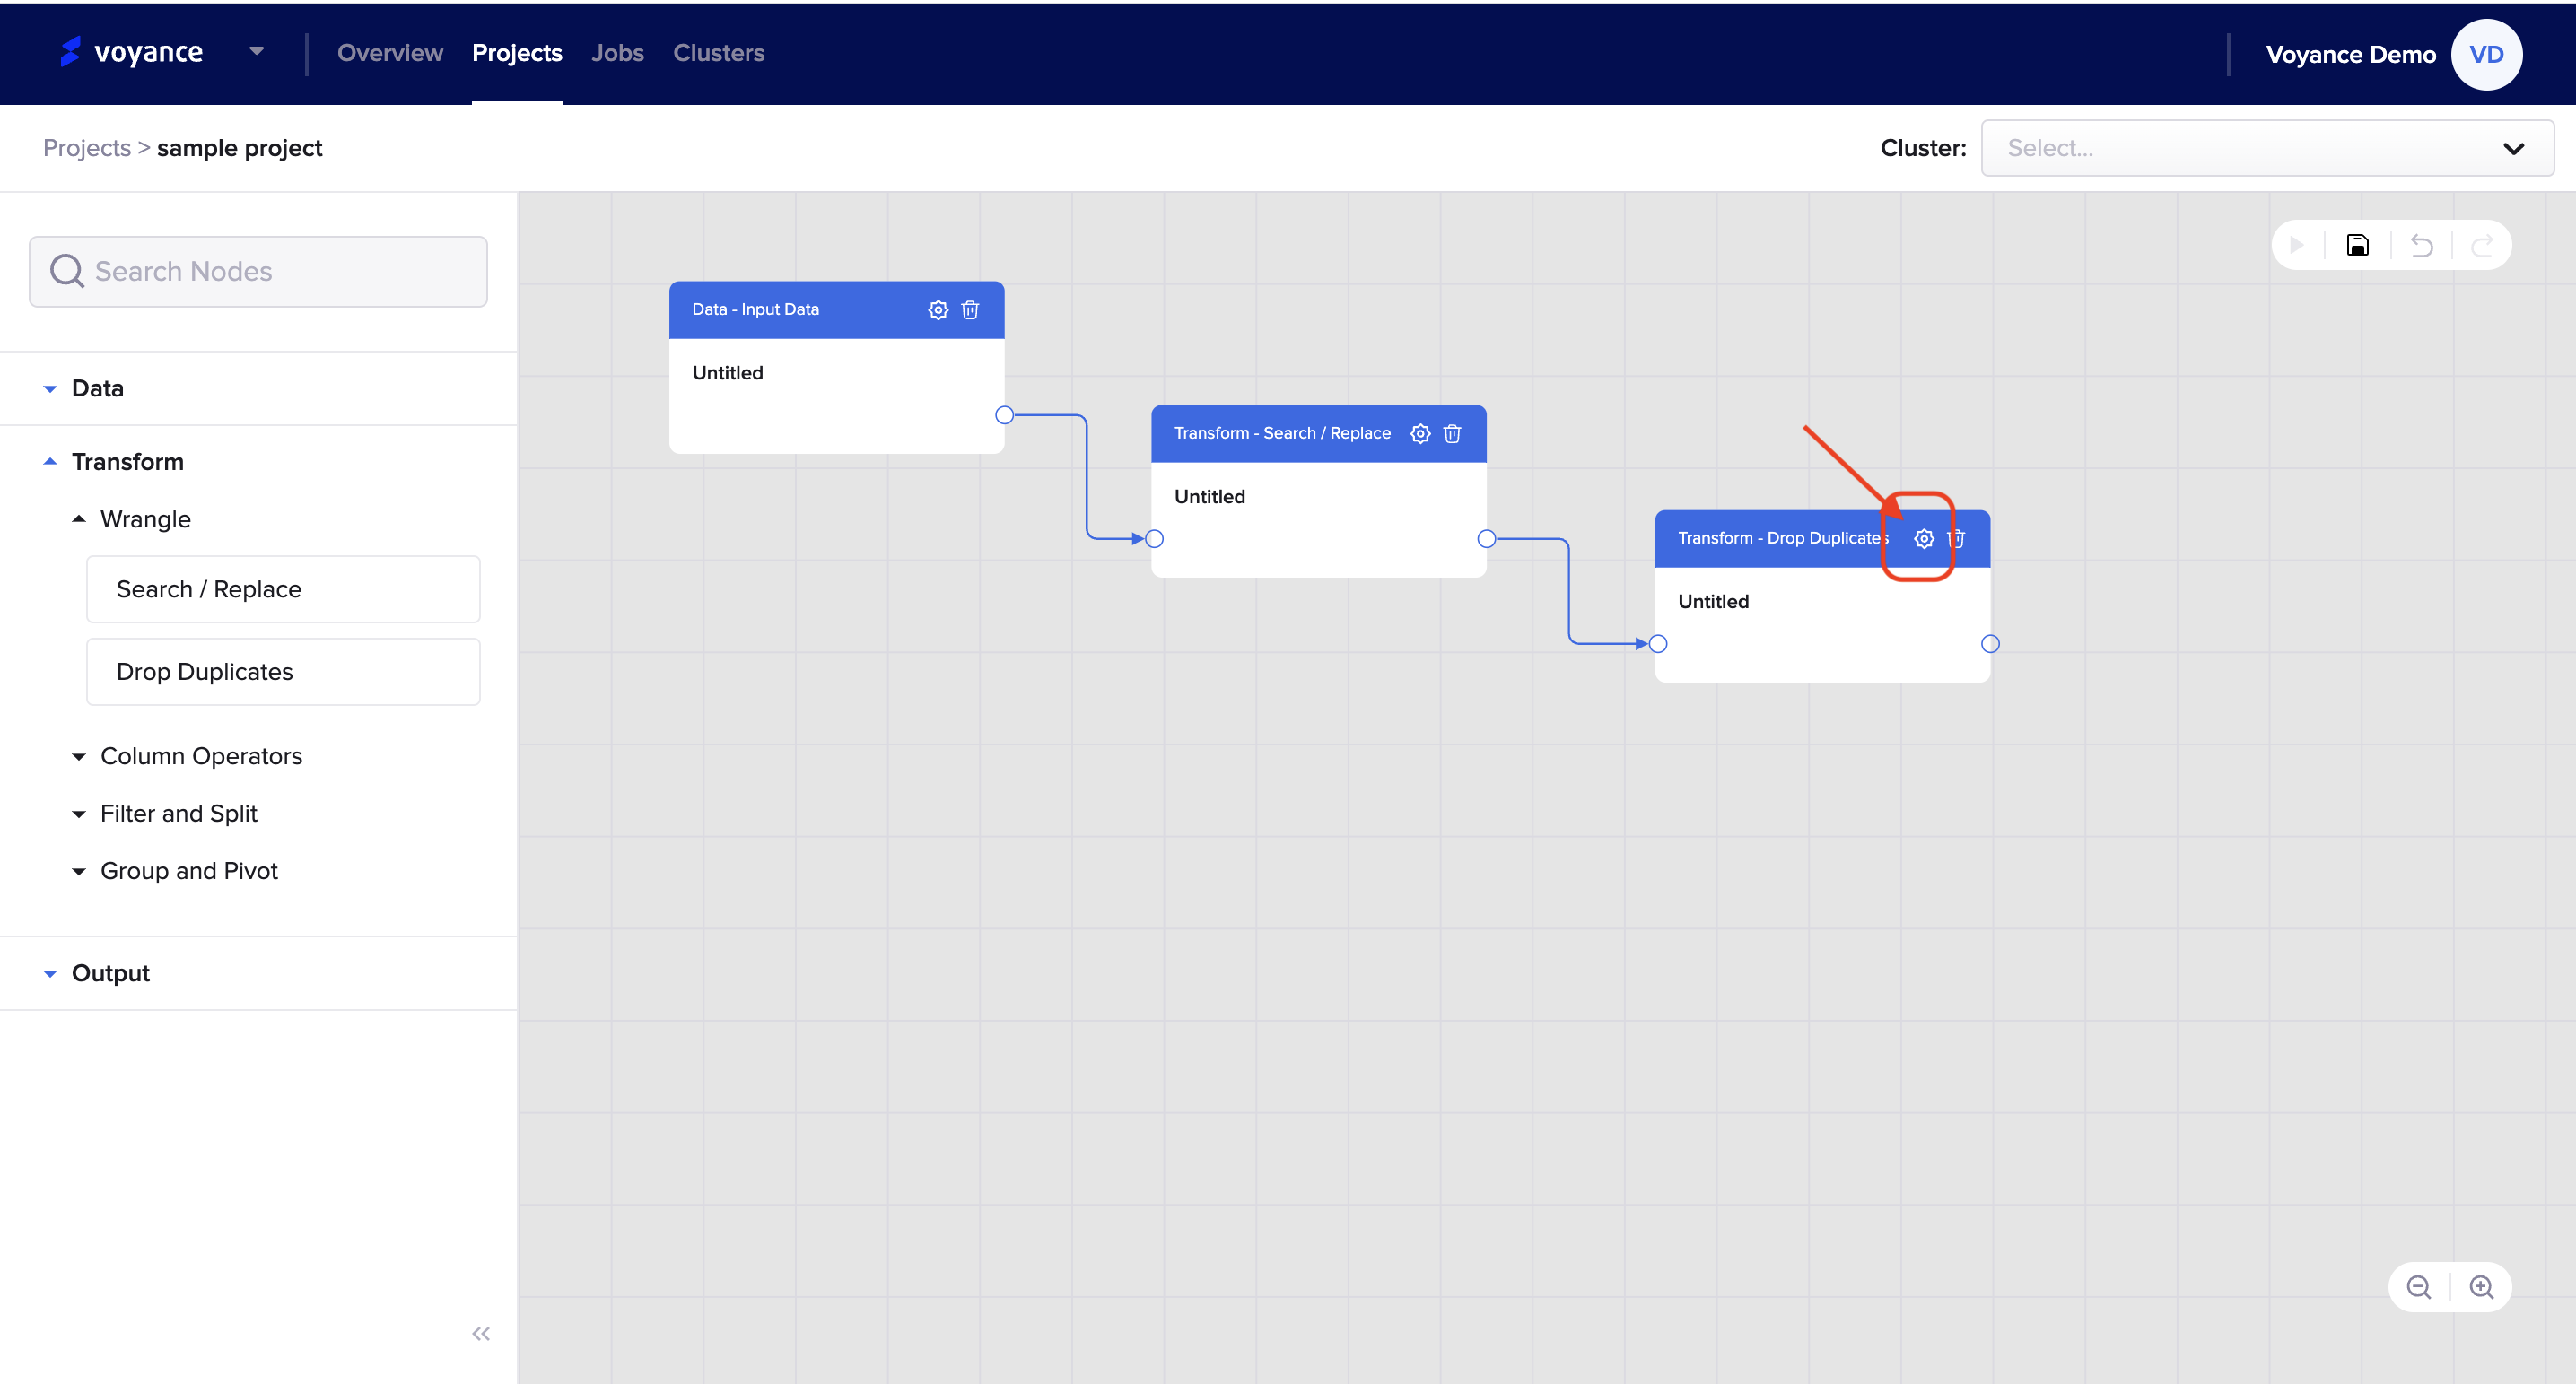
you will be redirected to the drop duplicate dashboard where you will fill in some parameters to remove duplicates from the data frame. some of the parameters include:
Description: This is the name given to the drop duplicate dialog box. it is not necessary to give it a name (optional).
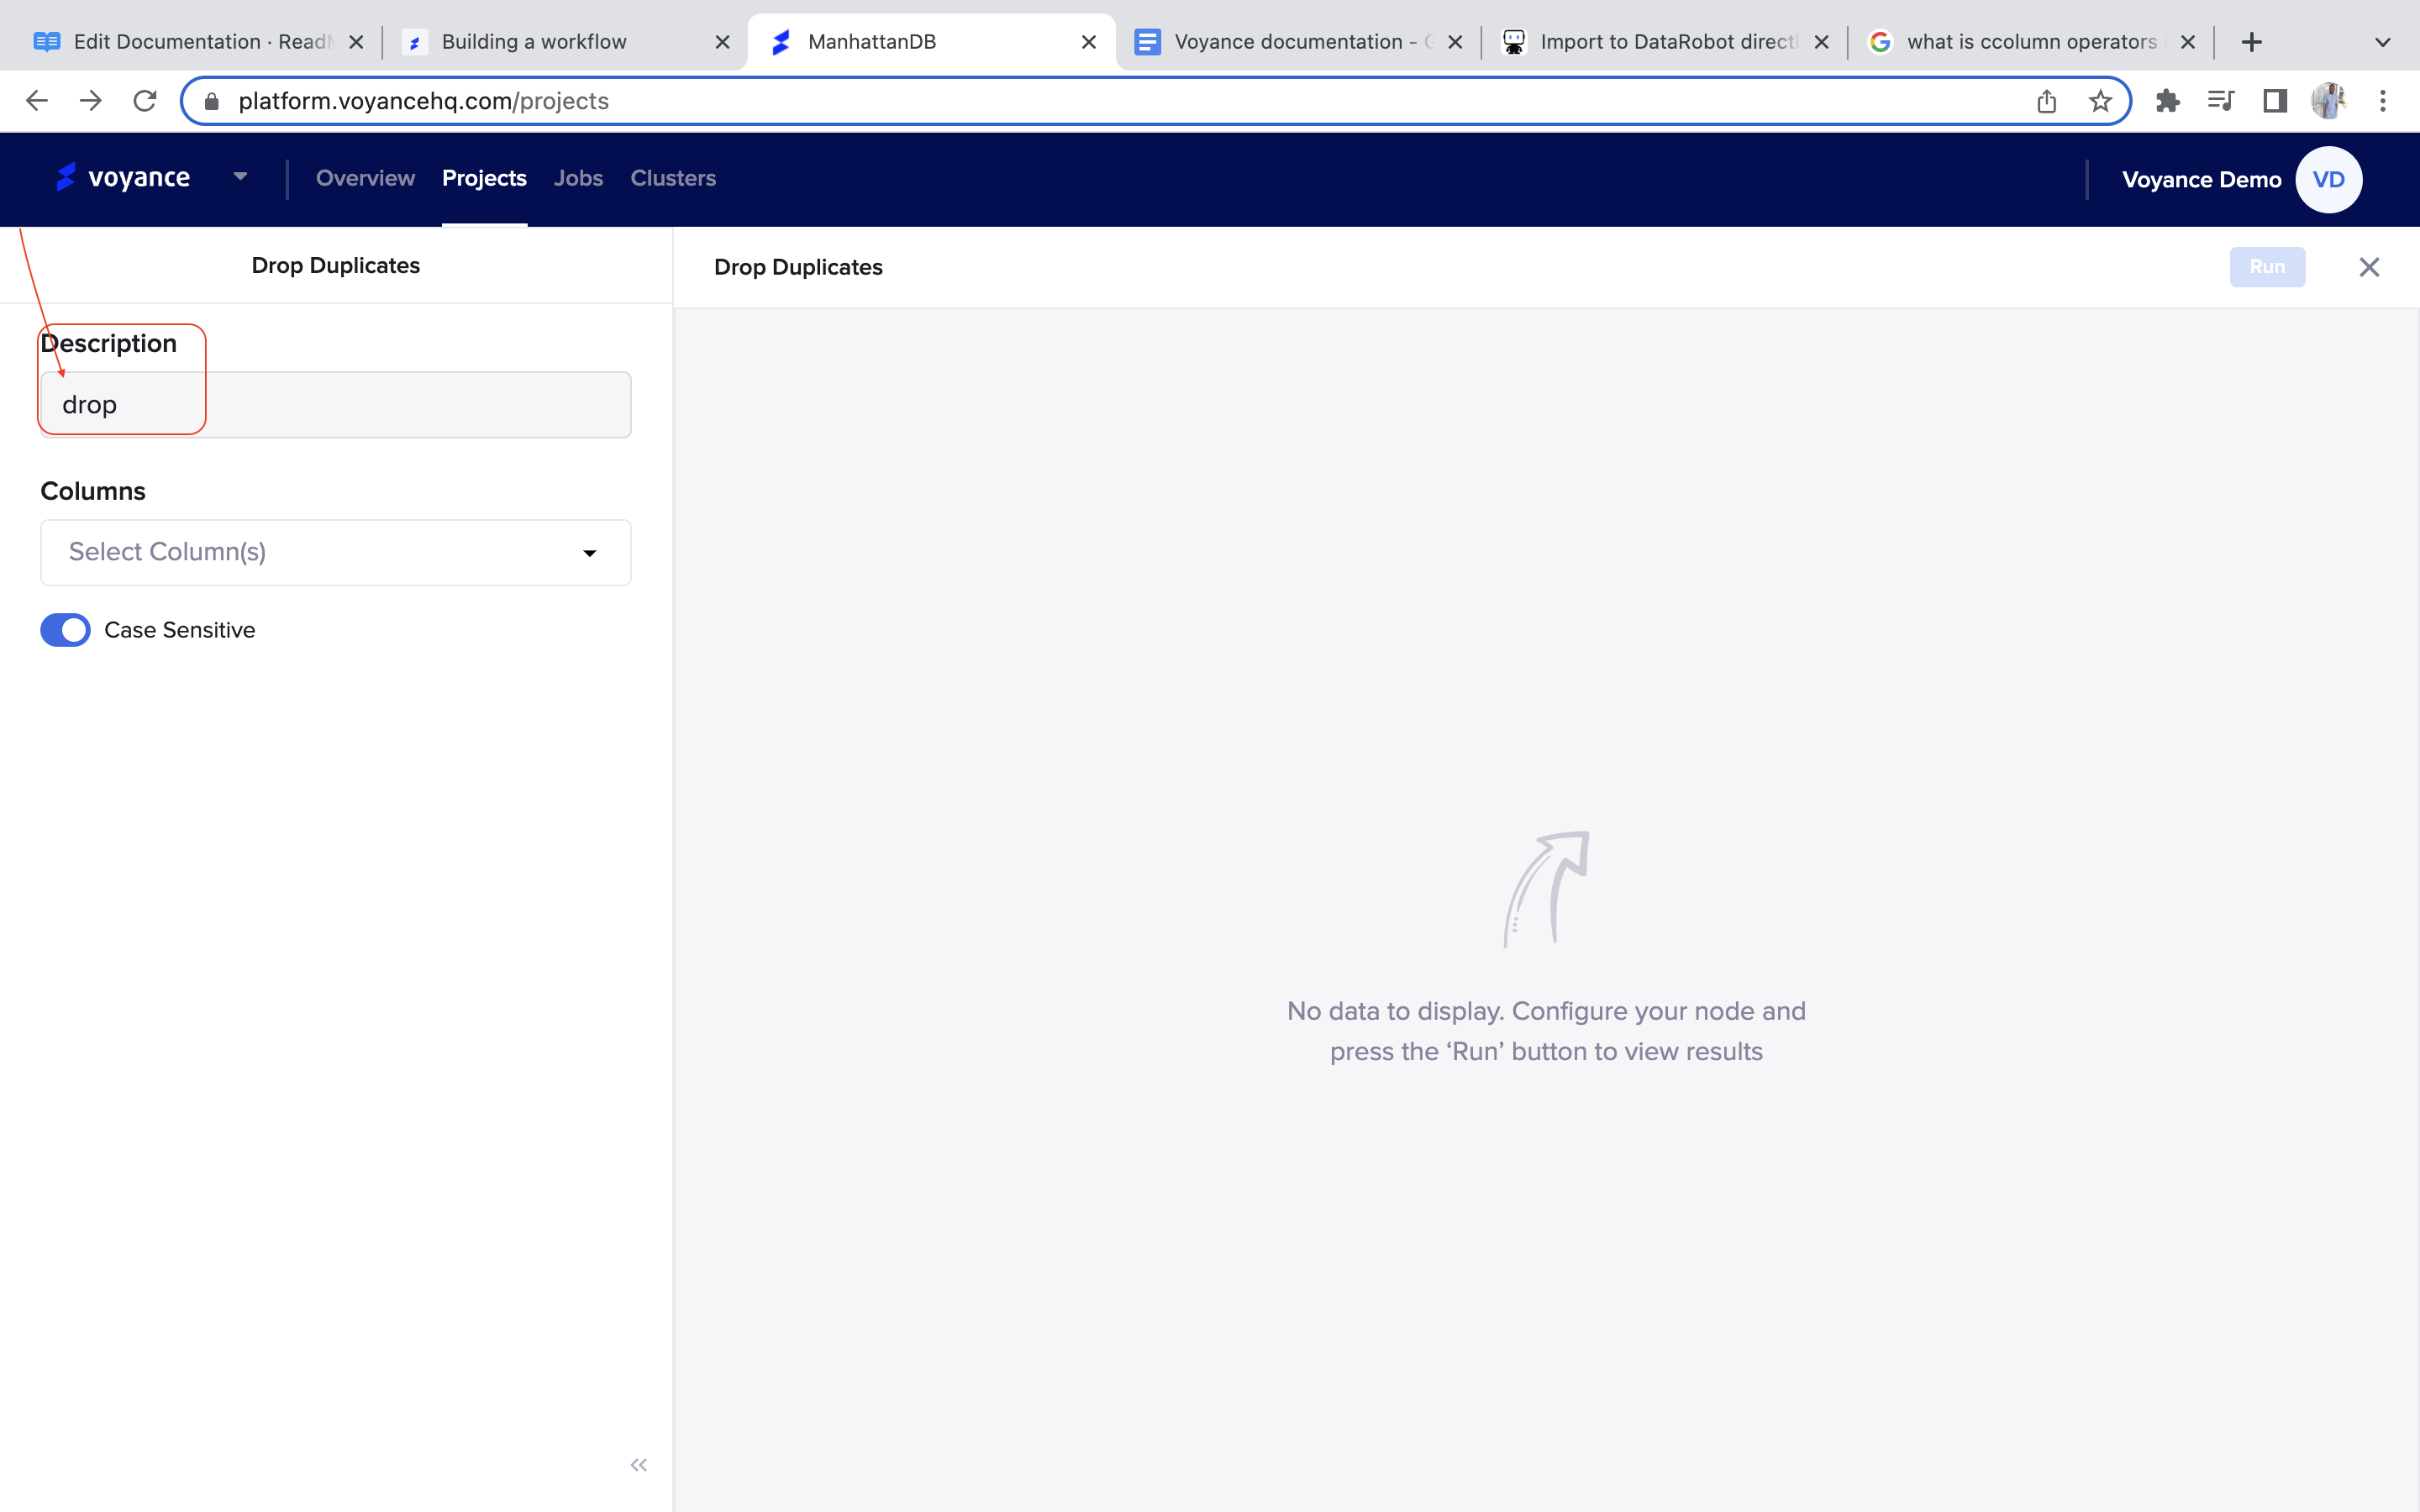
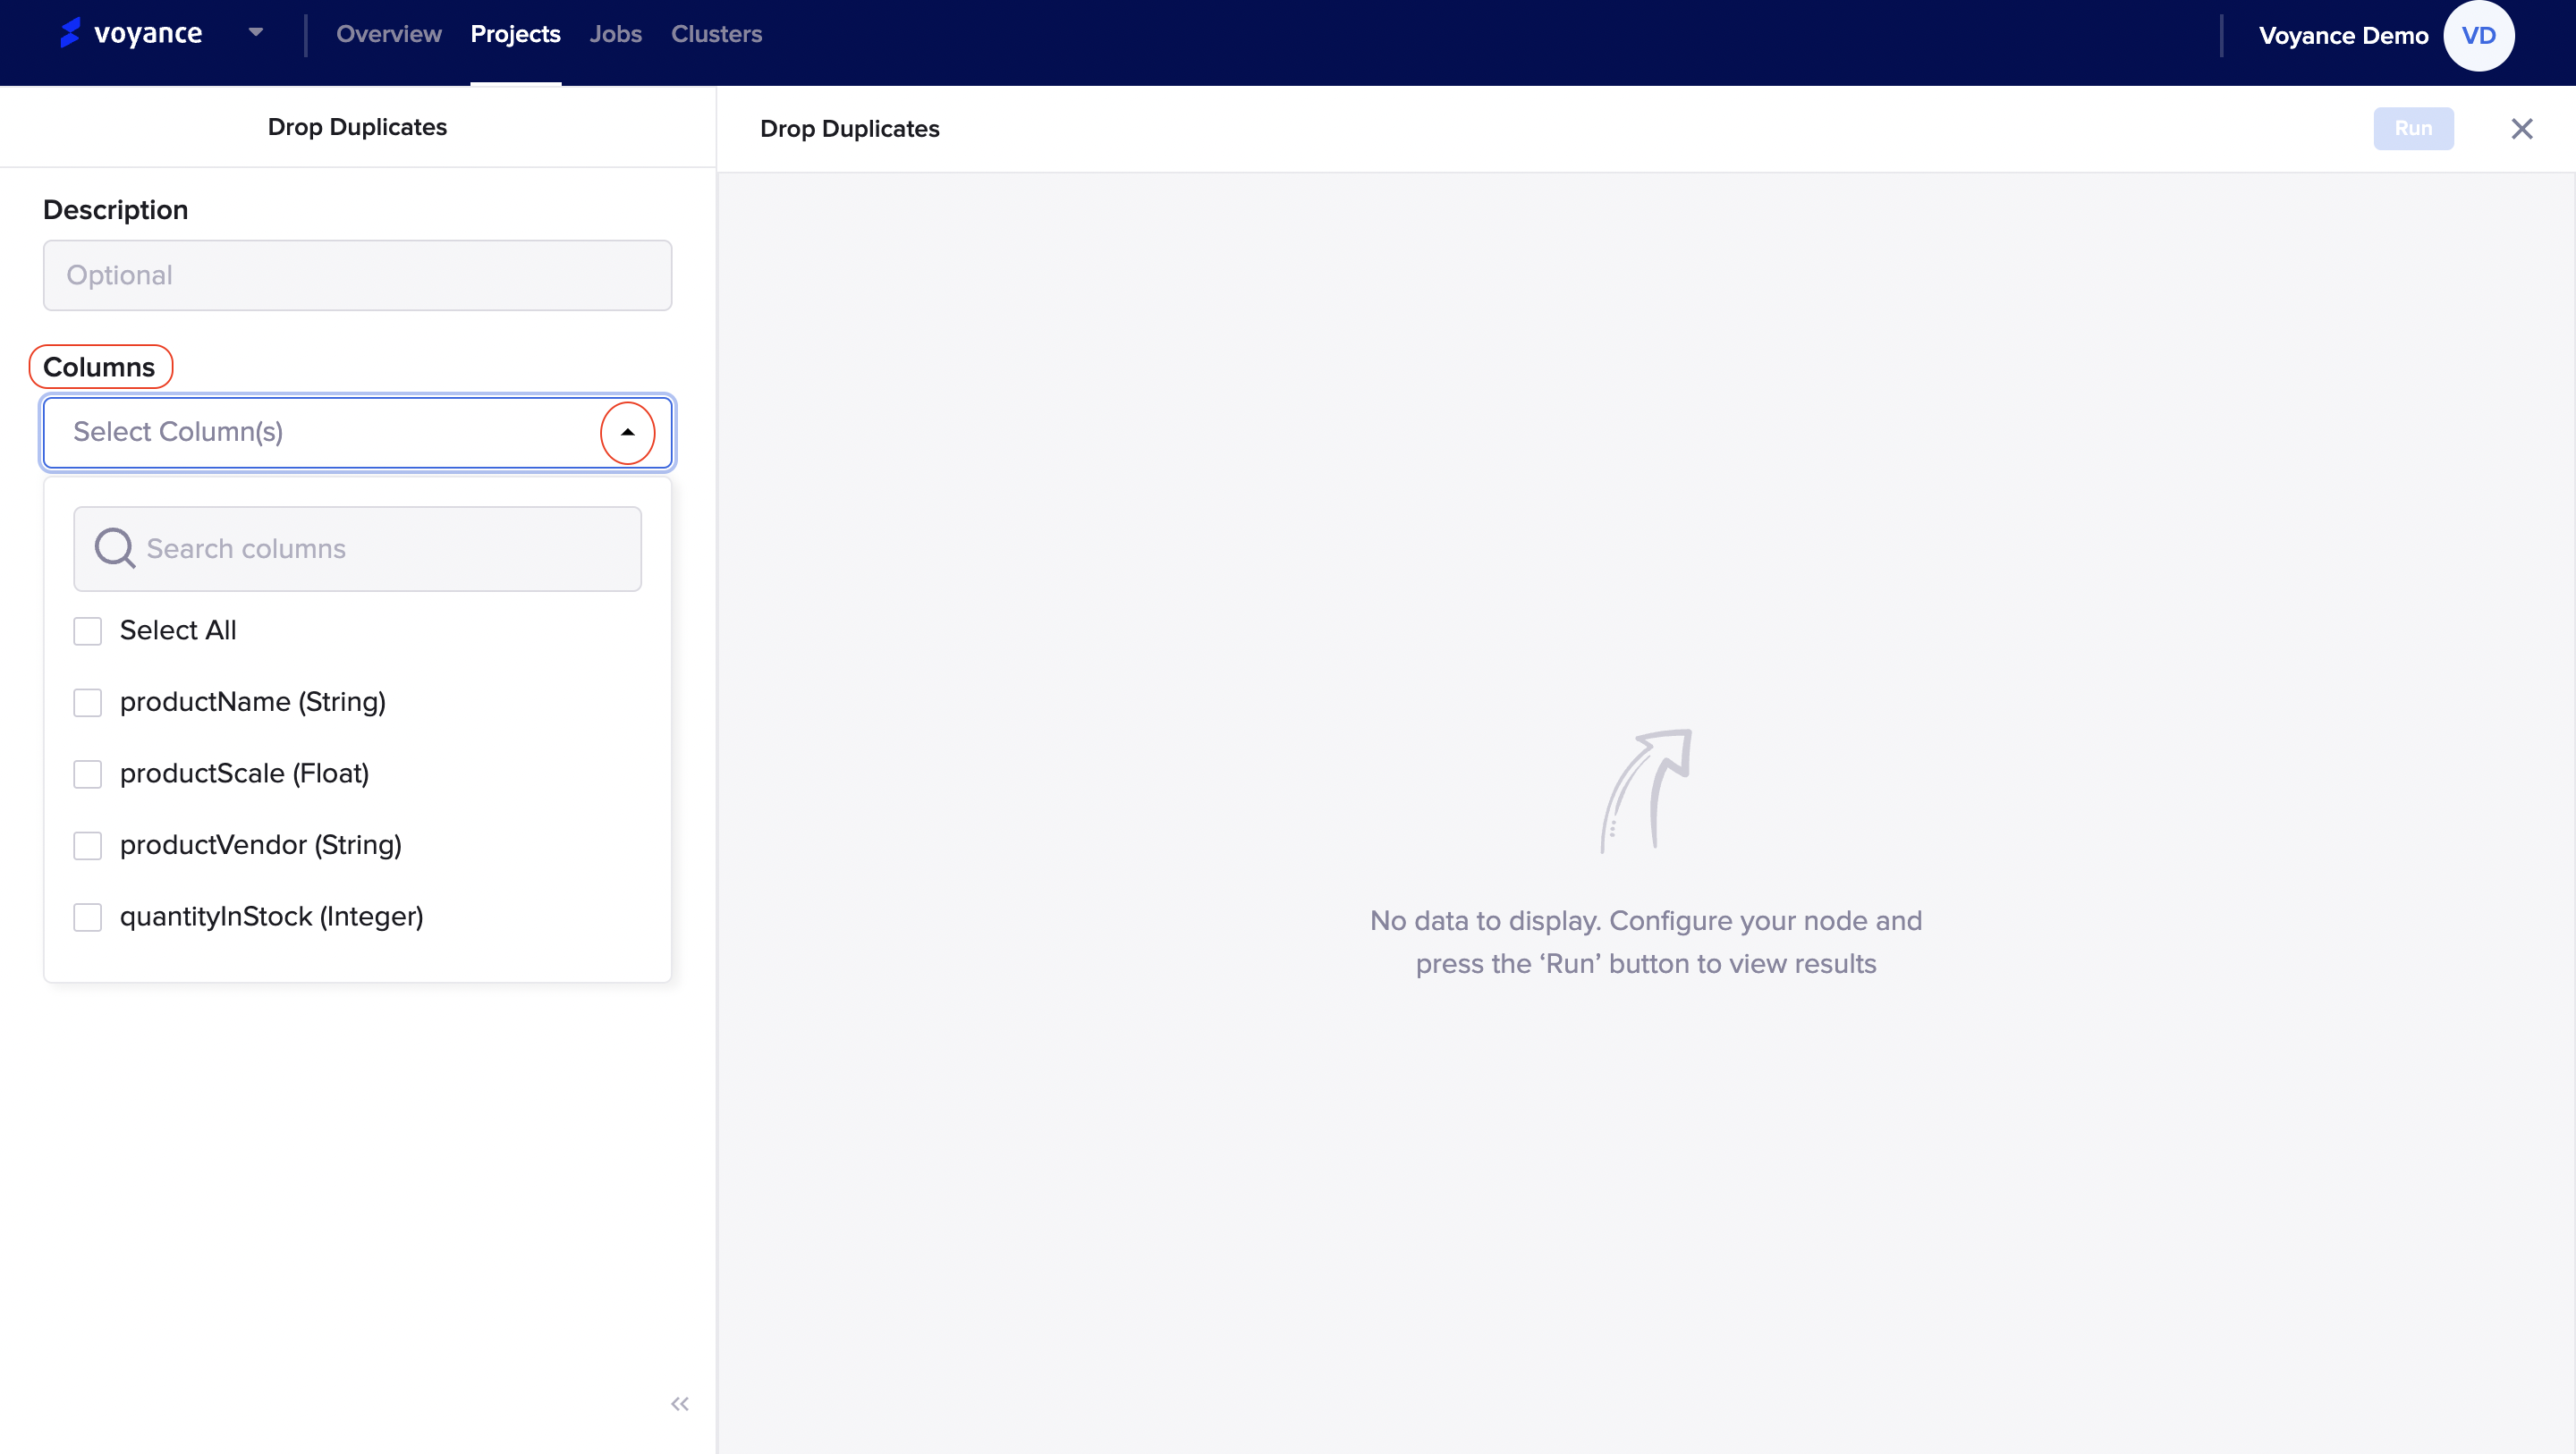
Columns: This is a set of data values of a particular type, one value for each row of the database. A column may contain text values, numbers, or even pointers to files in the operating system.
To select columns for your drop duplicates, click on the " column arrow icon", it displays a set of drop-down options which you can select from. Click on any of the checkboxes to select any of the columns and you can select more than one column option to remove duplicates.
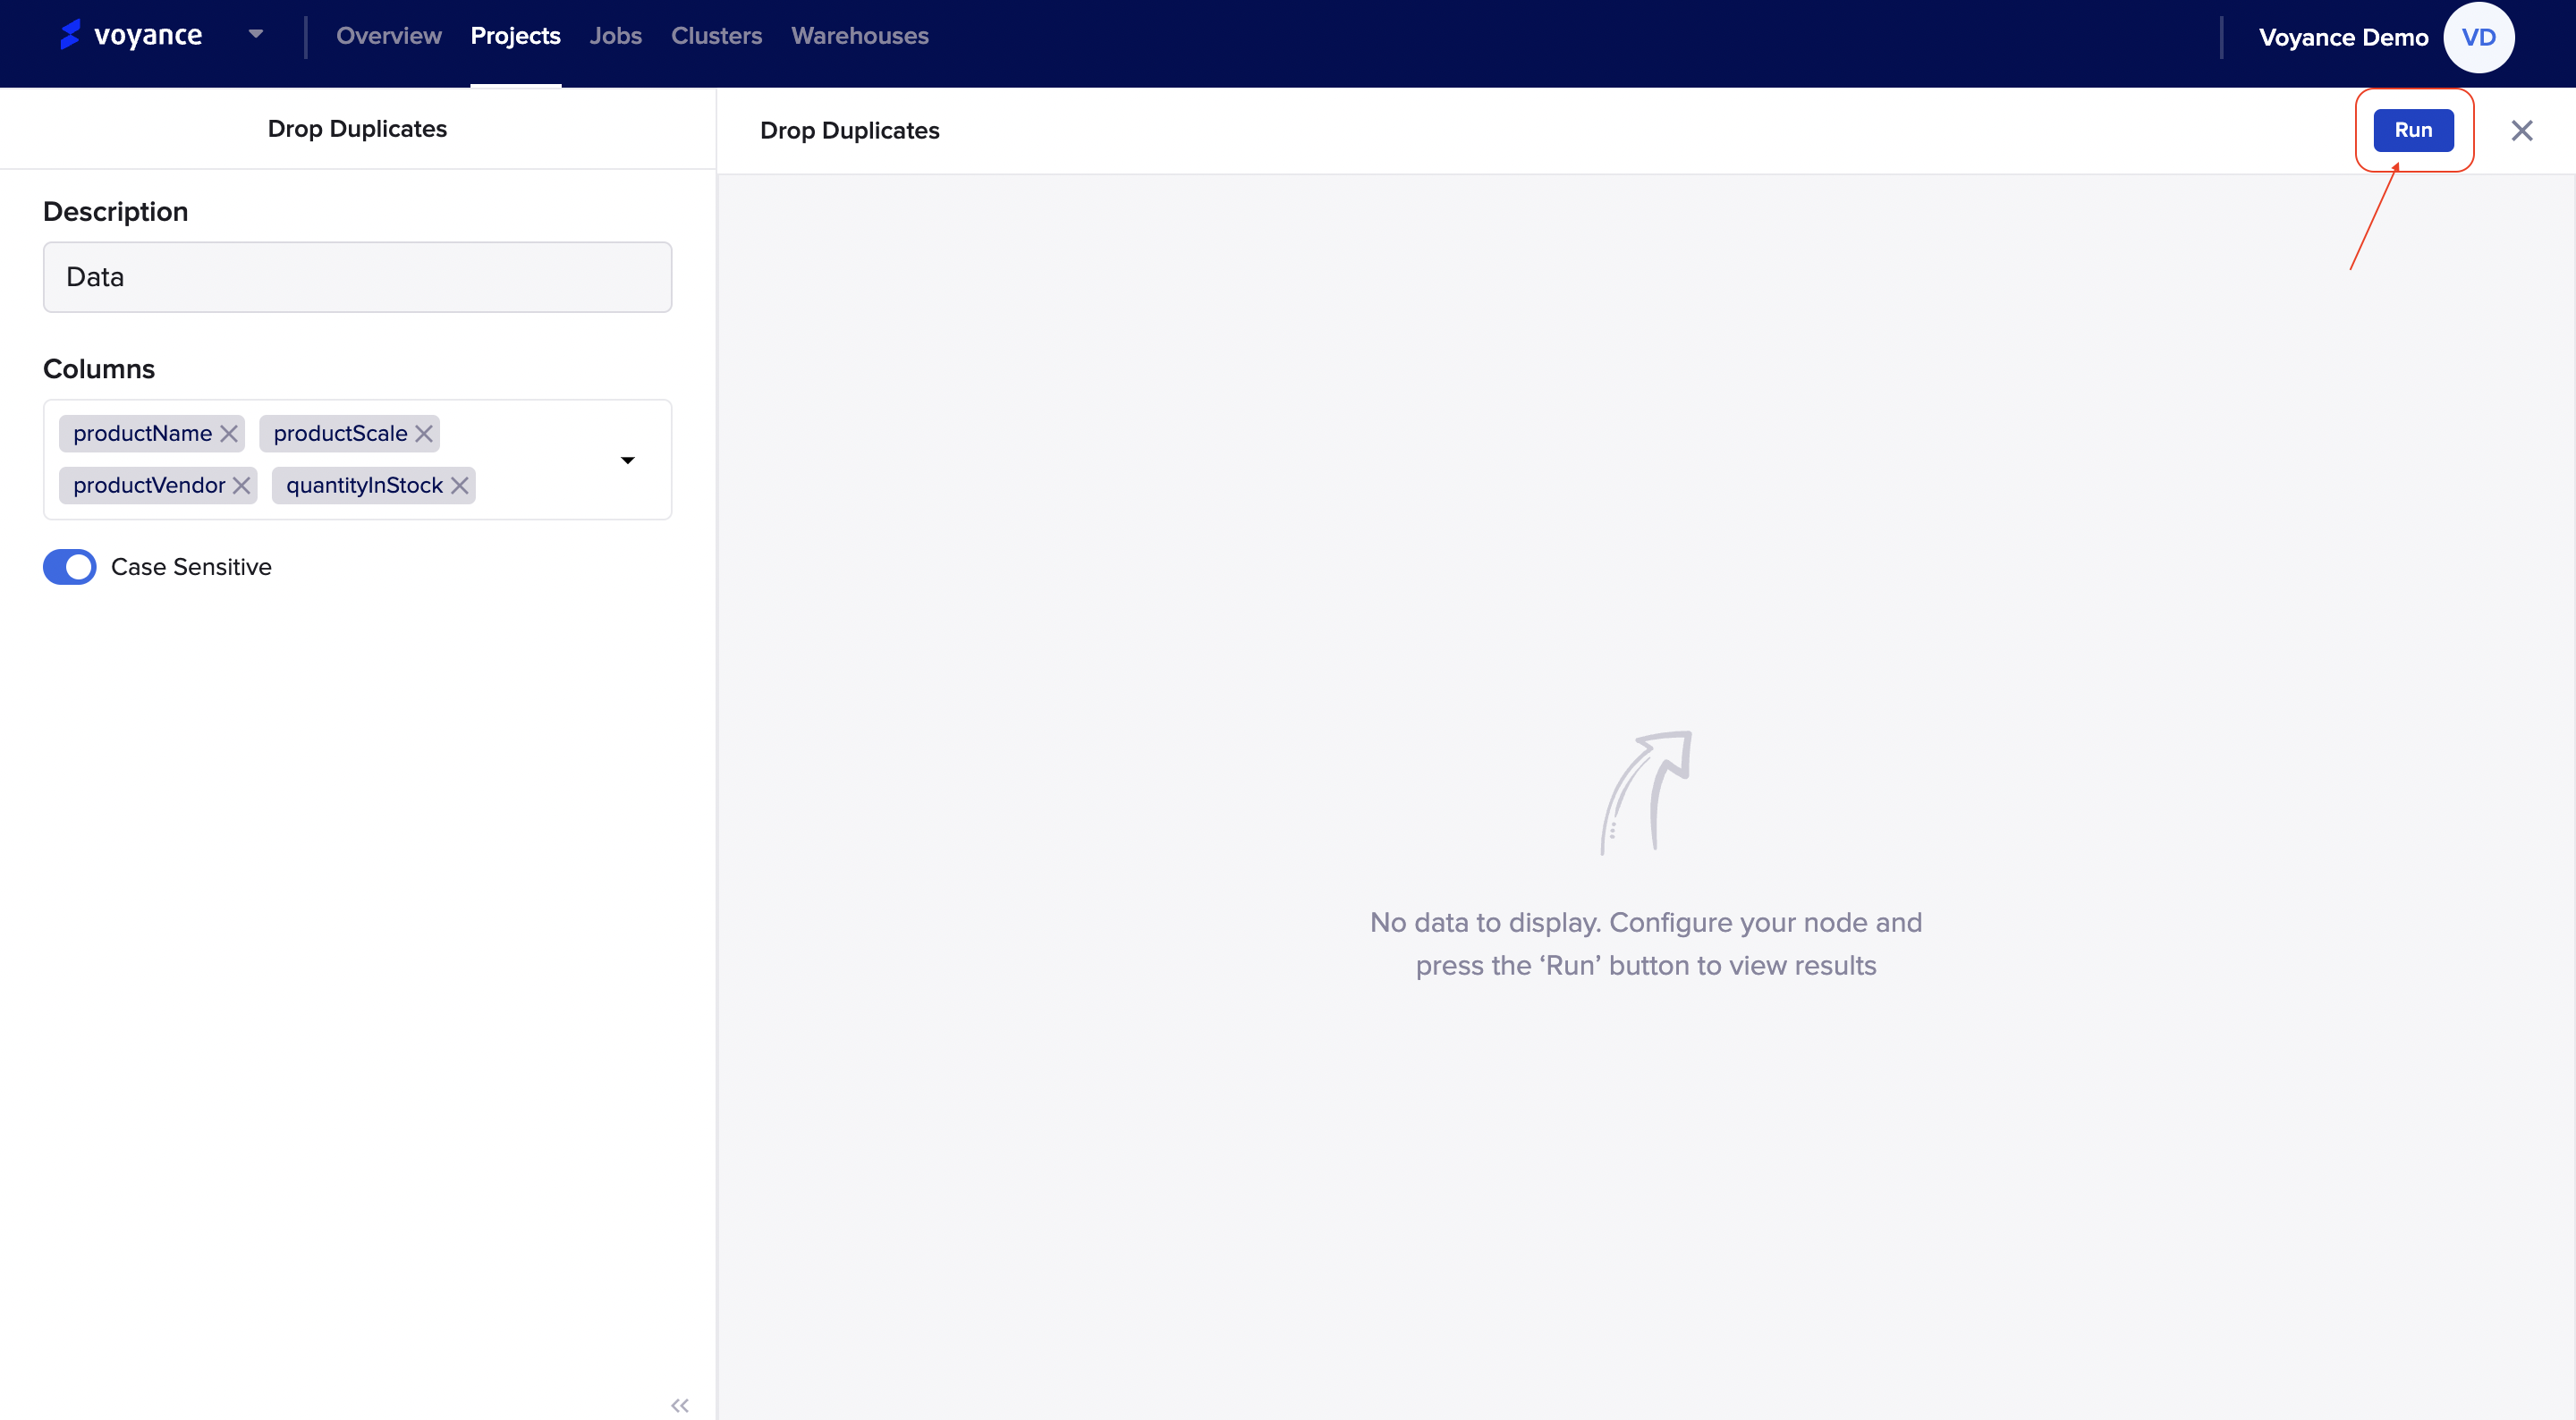
Run program
Once you have filled the necessary fields for the node to configure, click on the "Run" button to analyze and view the result of the data nodes.
Delete Duplicate Transform **
To delete the duplicate card that was dragged to the workflow, click on the Delete icon at the top of the dragged duplicate card.
Transform With Column Operators
With column operators tools, you can “Remane several data types or values, Sort out data types from different datasets into different subsets, and Join data together from different data types”.
To transform data with column operators, click on the “Transform>Column Operators” arrow field, under the column operators, there are some drop-down options to choose from to enable you to transform and unify your data. We have “Column-Rename, Sort, and Join”
We will be considering each of the column operator tools in detail.
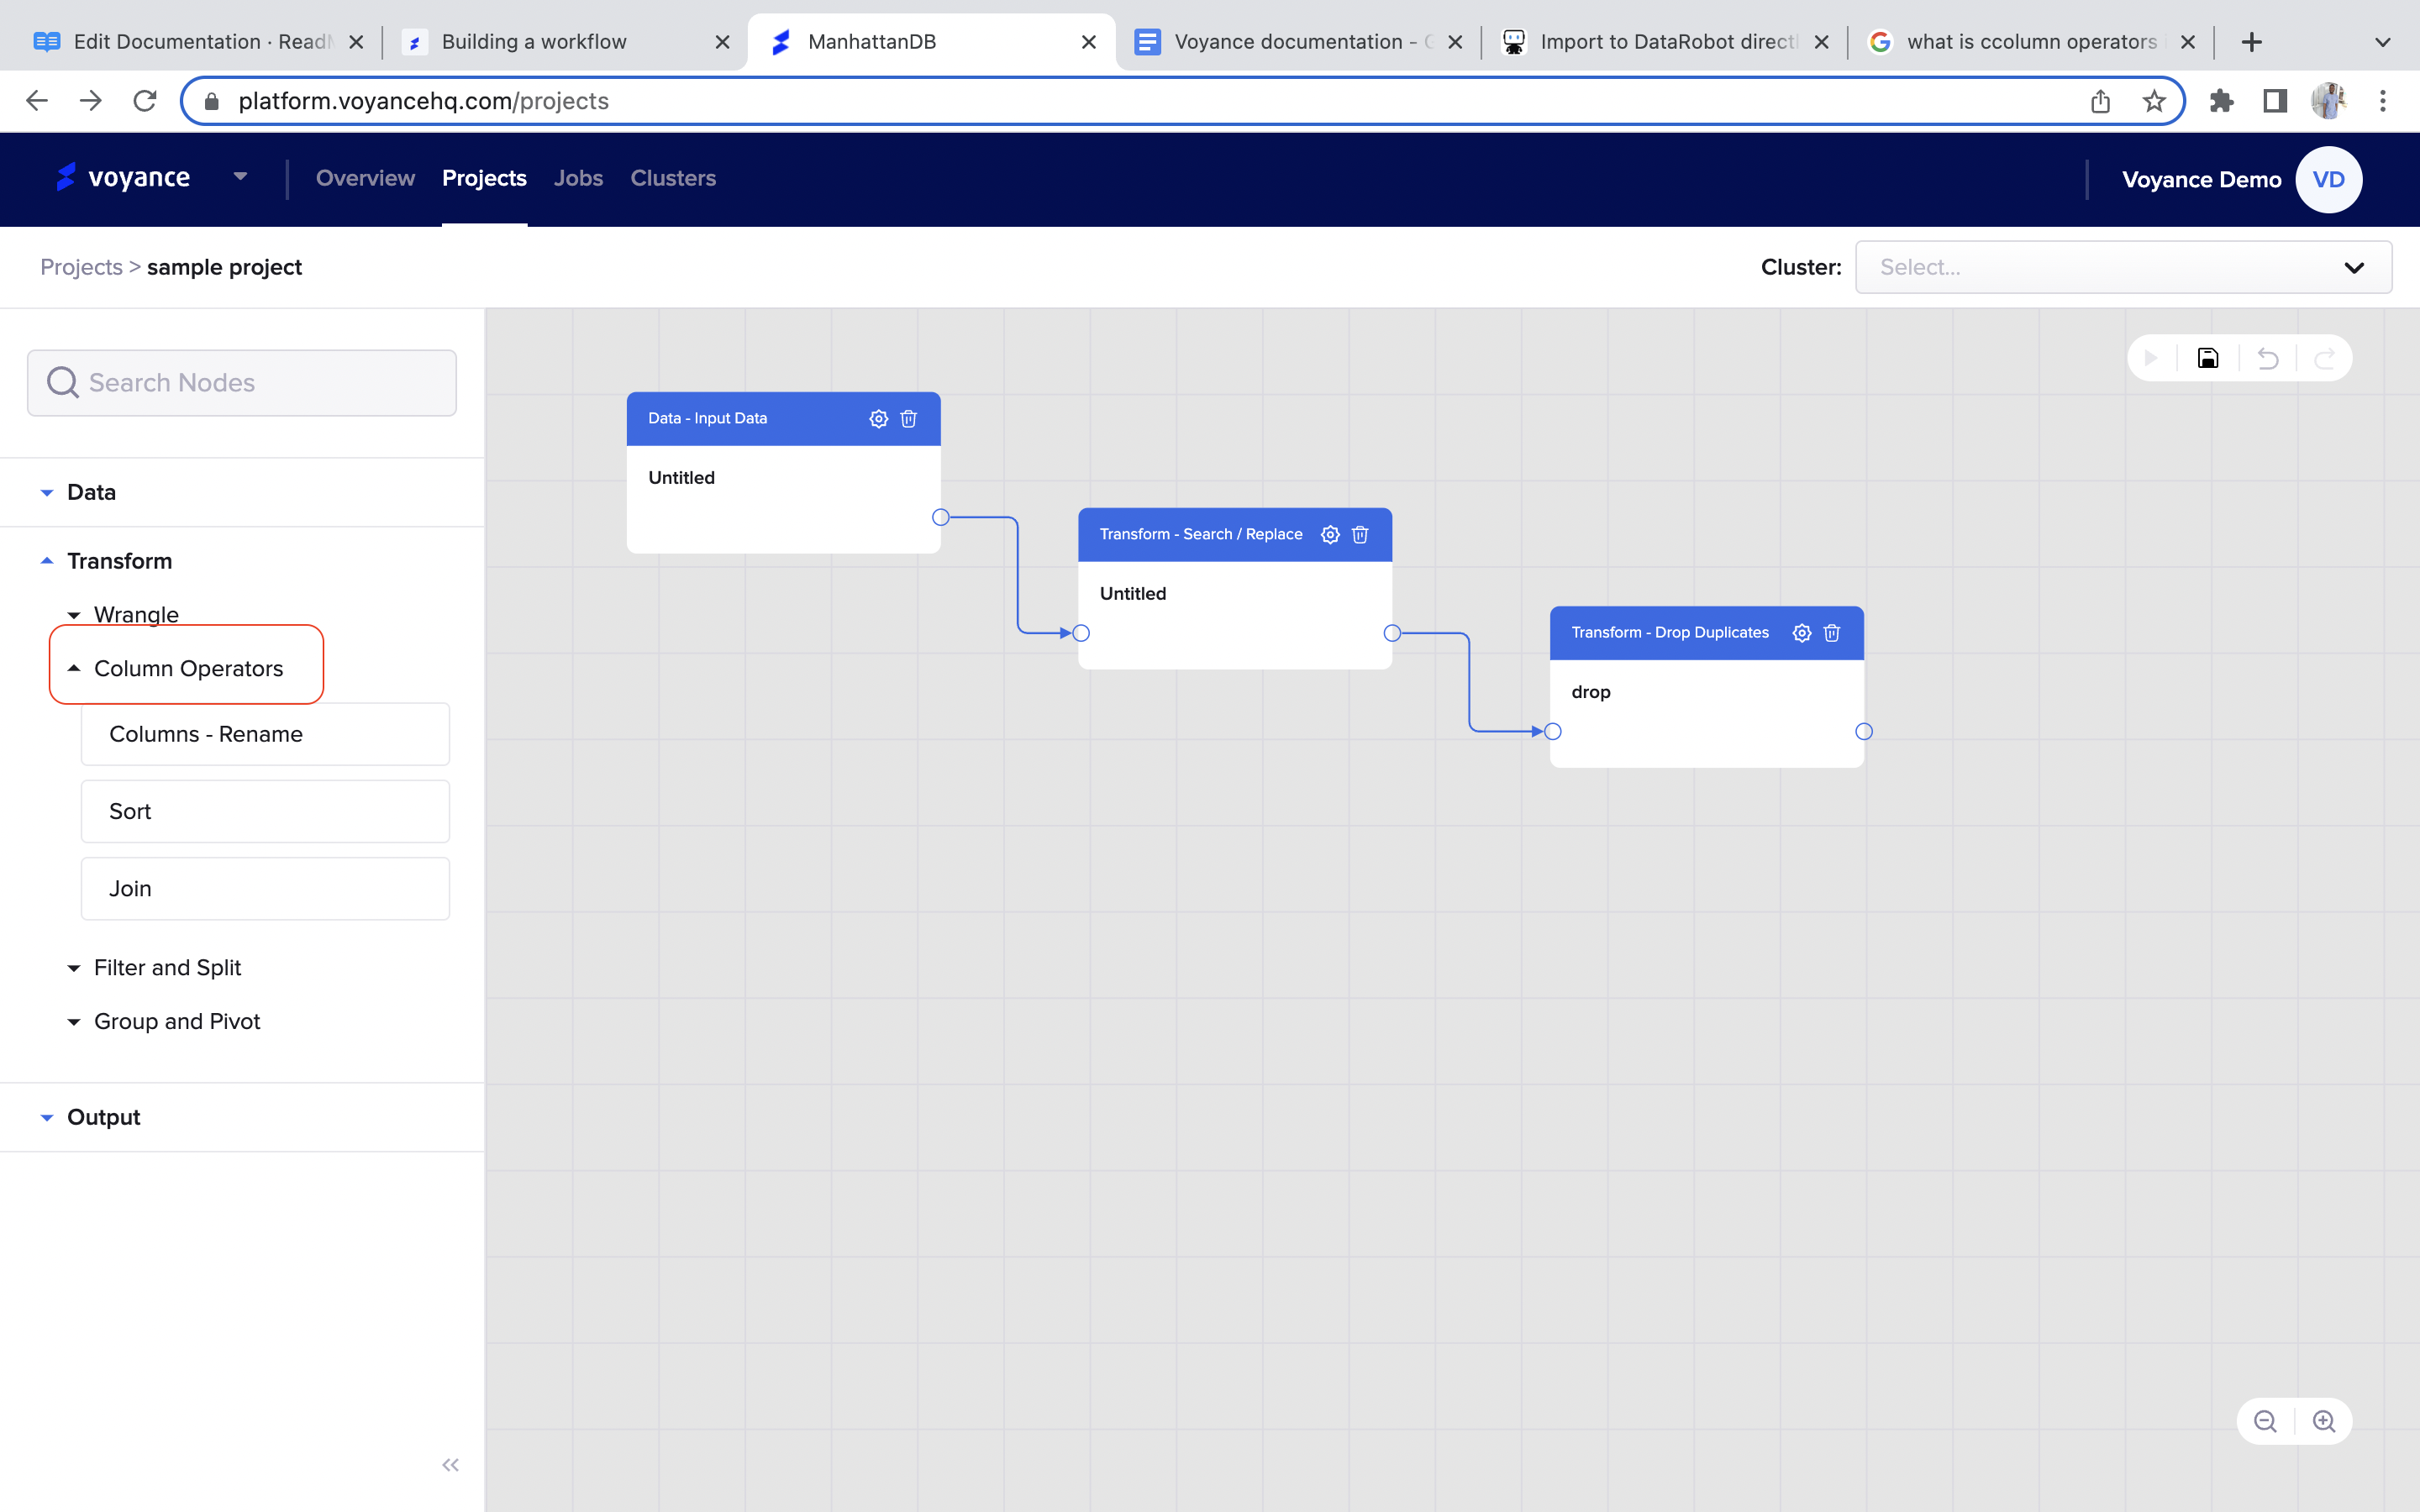
Column-Rename
The rename column is the process of enabling you to give a new name to a set of data types or values. To rename a column, click, drag and drop the “Column-rename” to the project workflow.
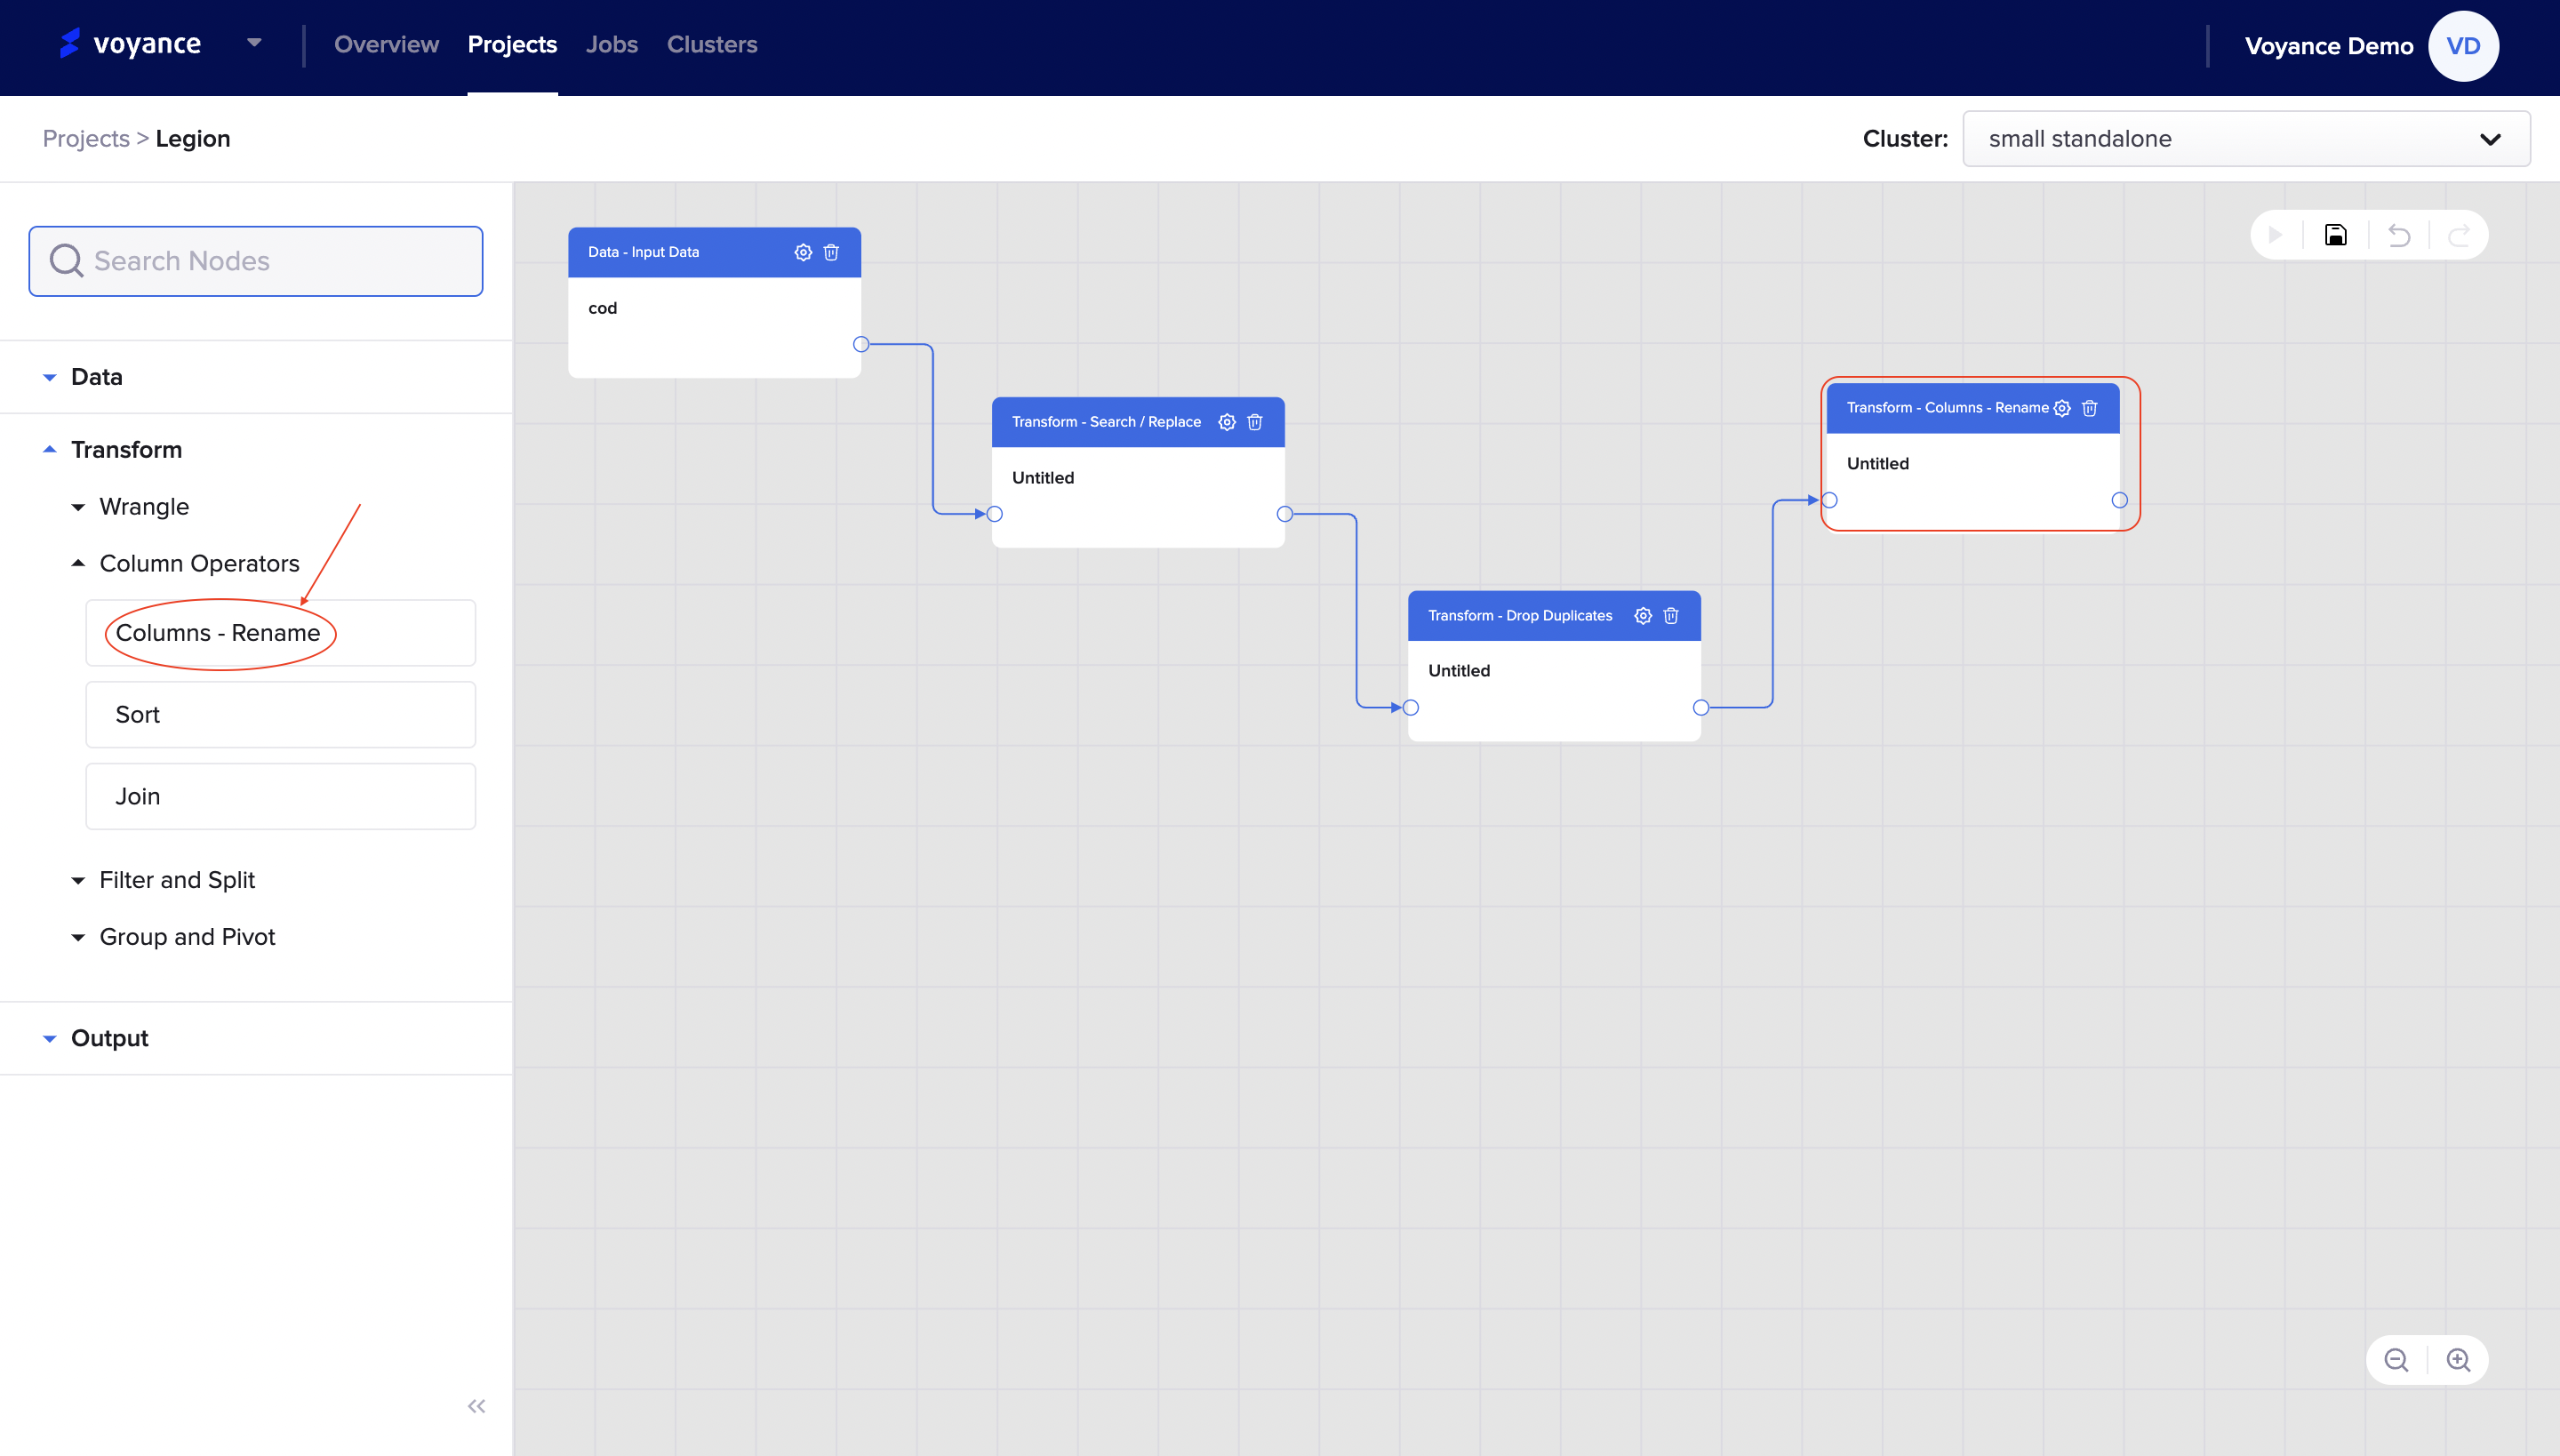
Edit Column-Rename
Once you have dragged and dropped the rename column tool on the project workflow, the next step is to edit the column rename dialog box.
To edit the column-rename dialog box, click on the ”Settings icon” at the top right of the dialog box,
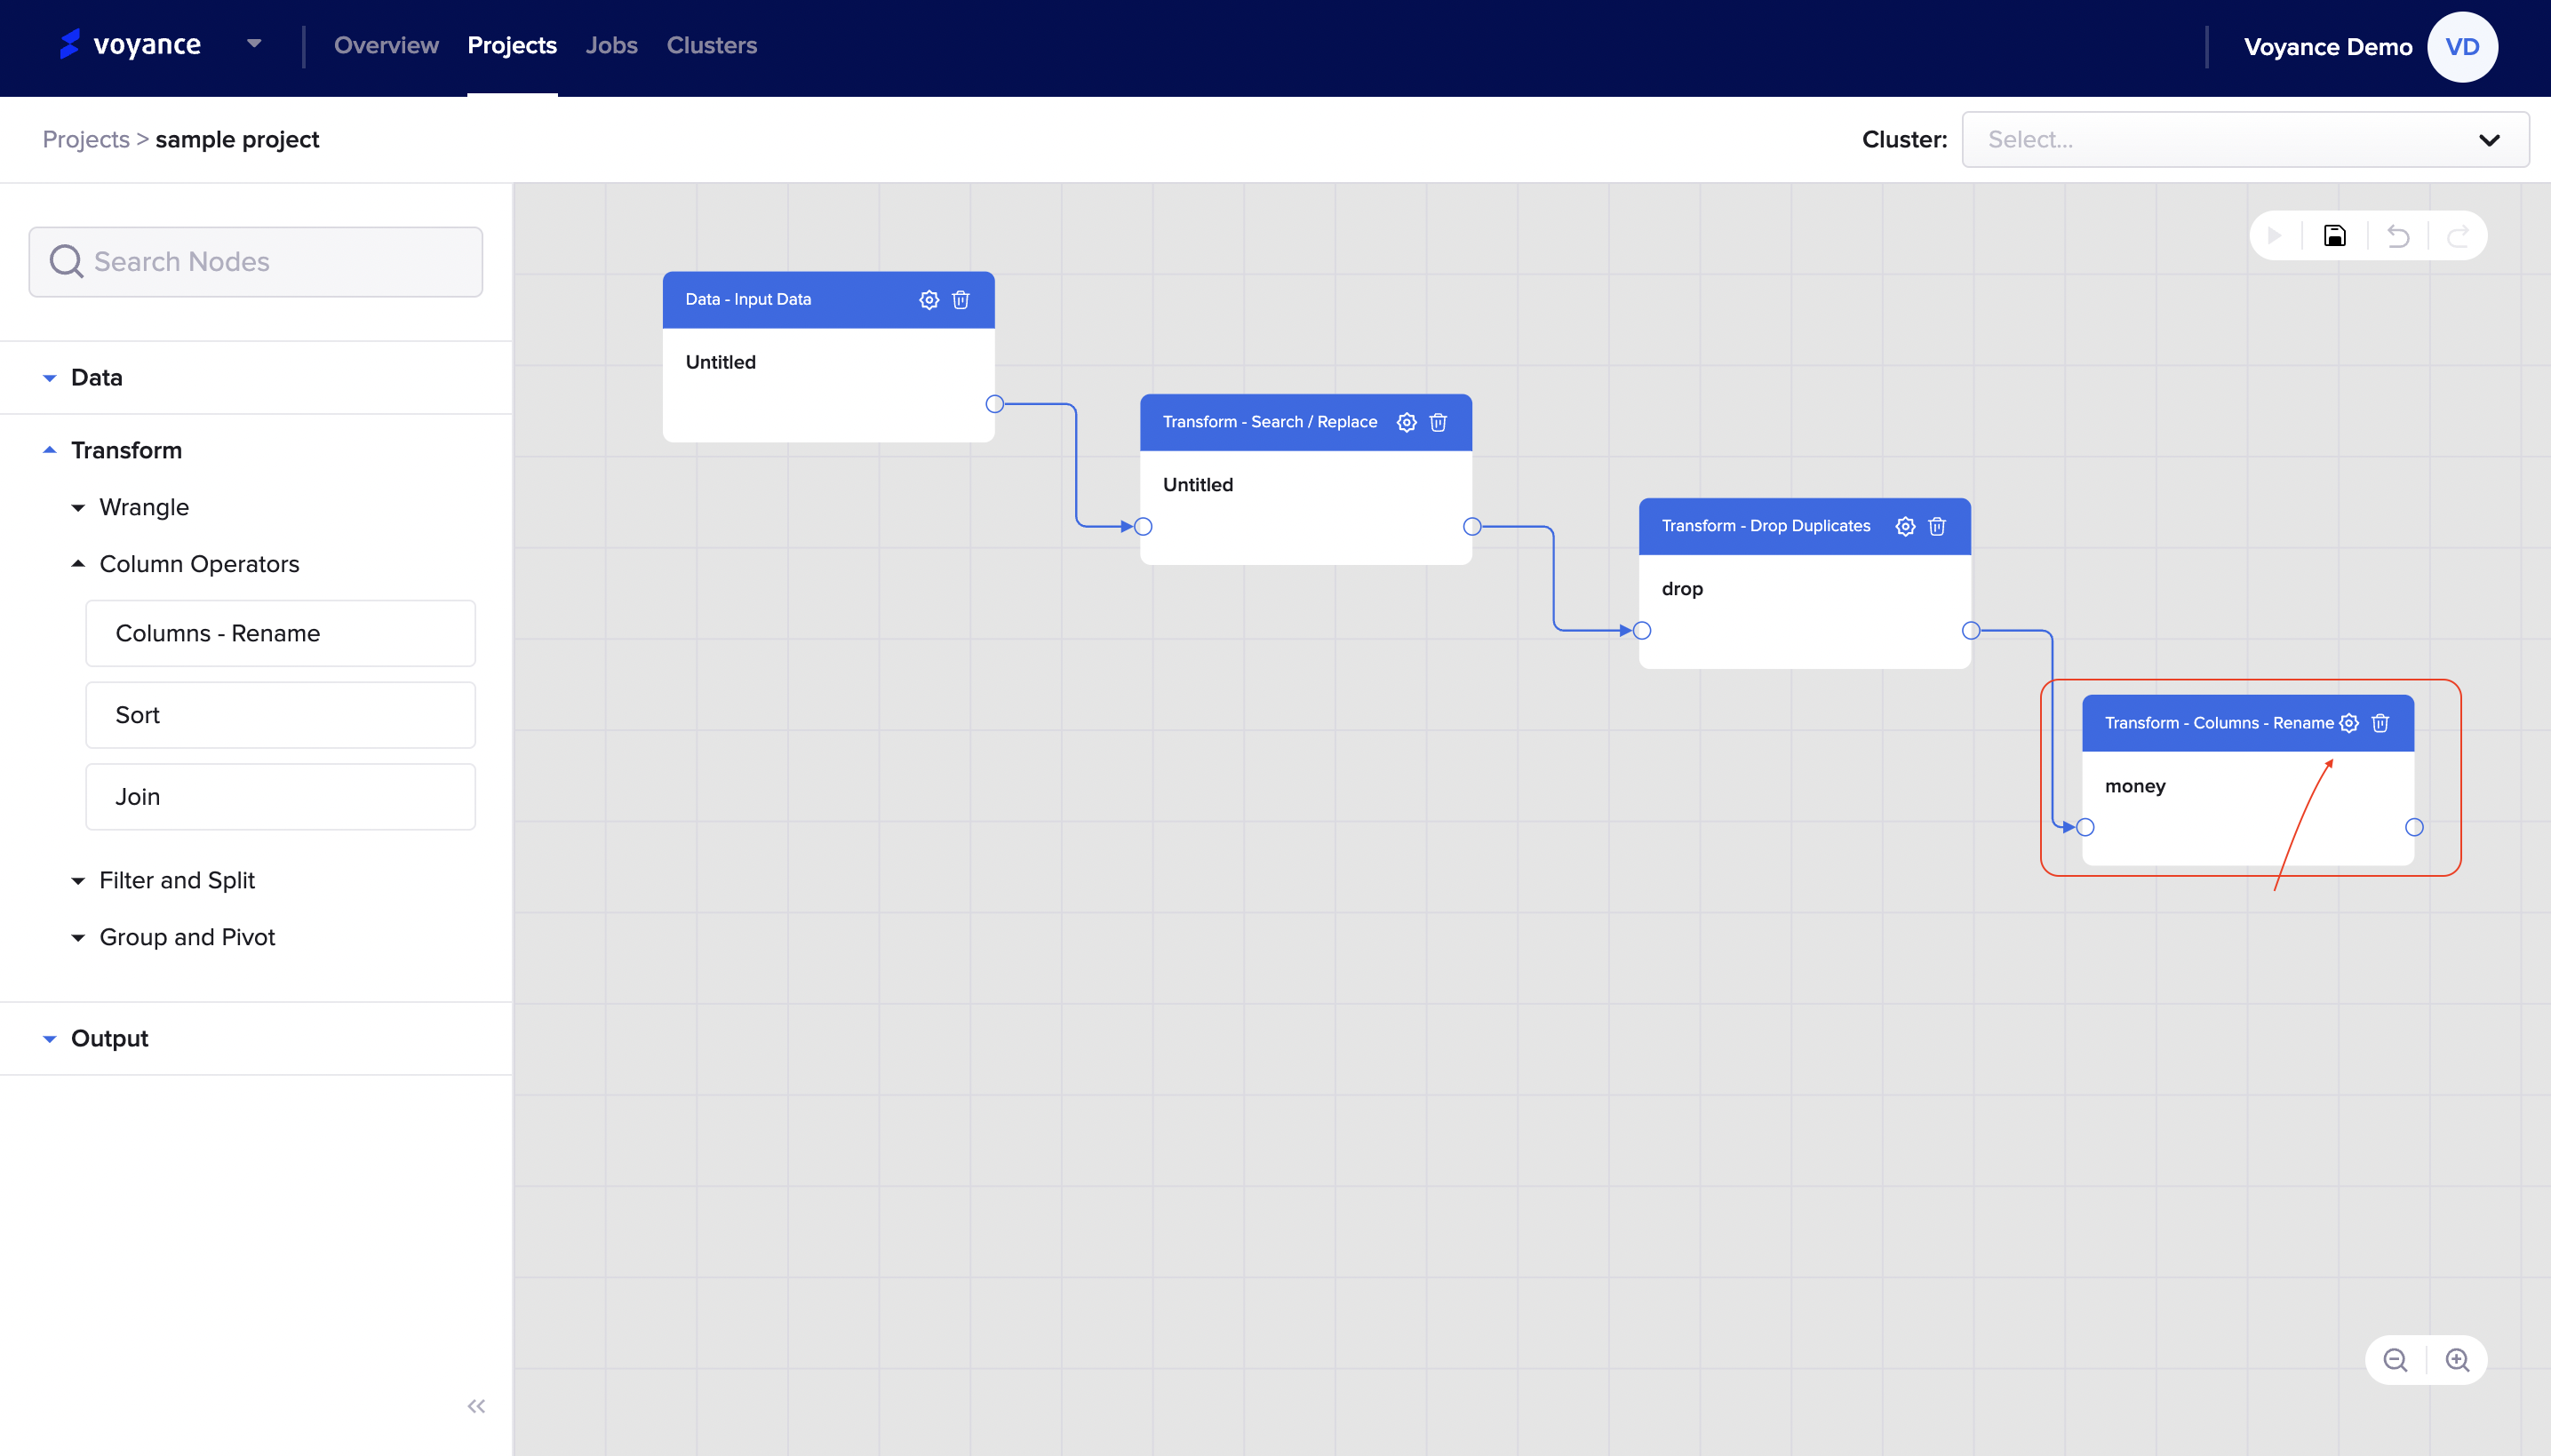
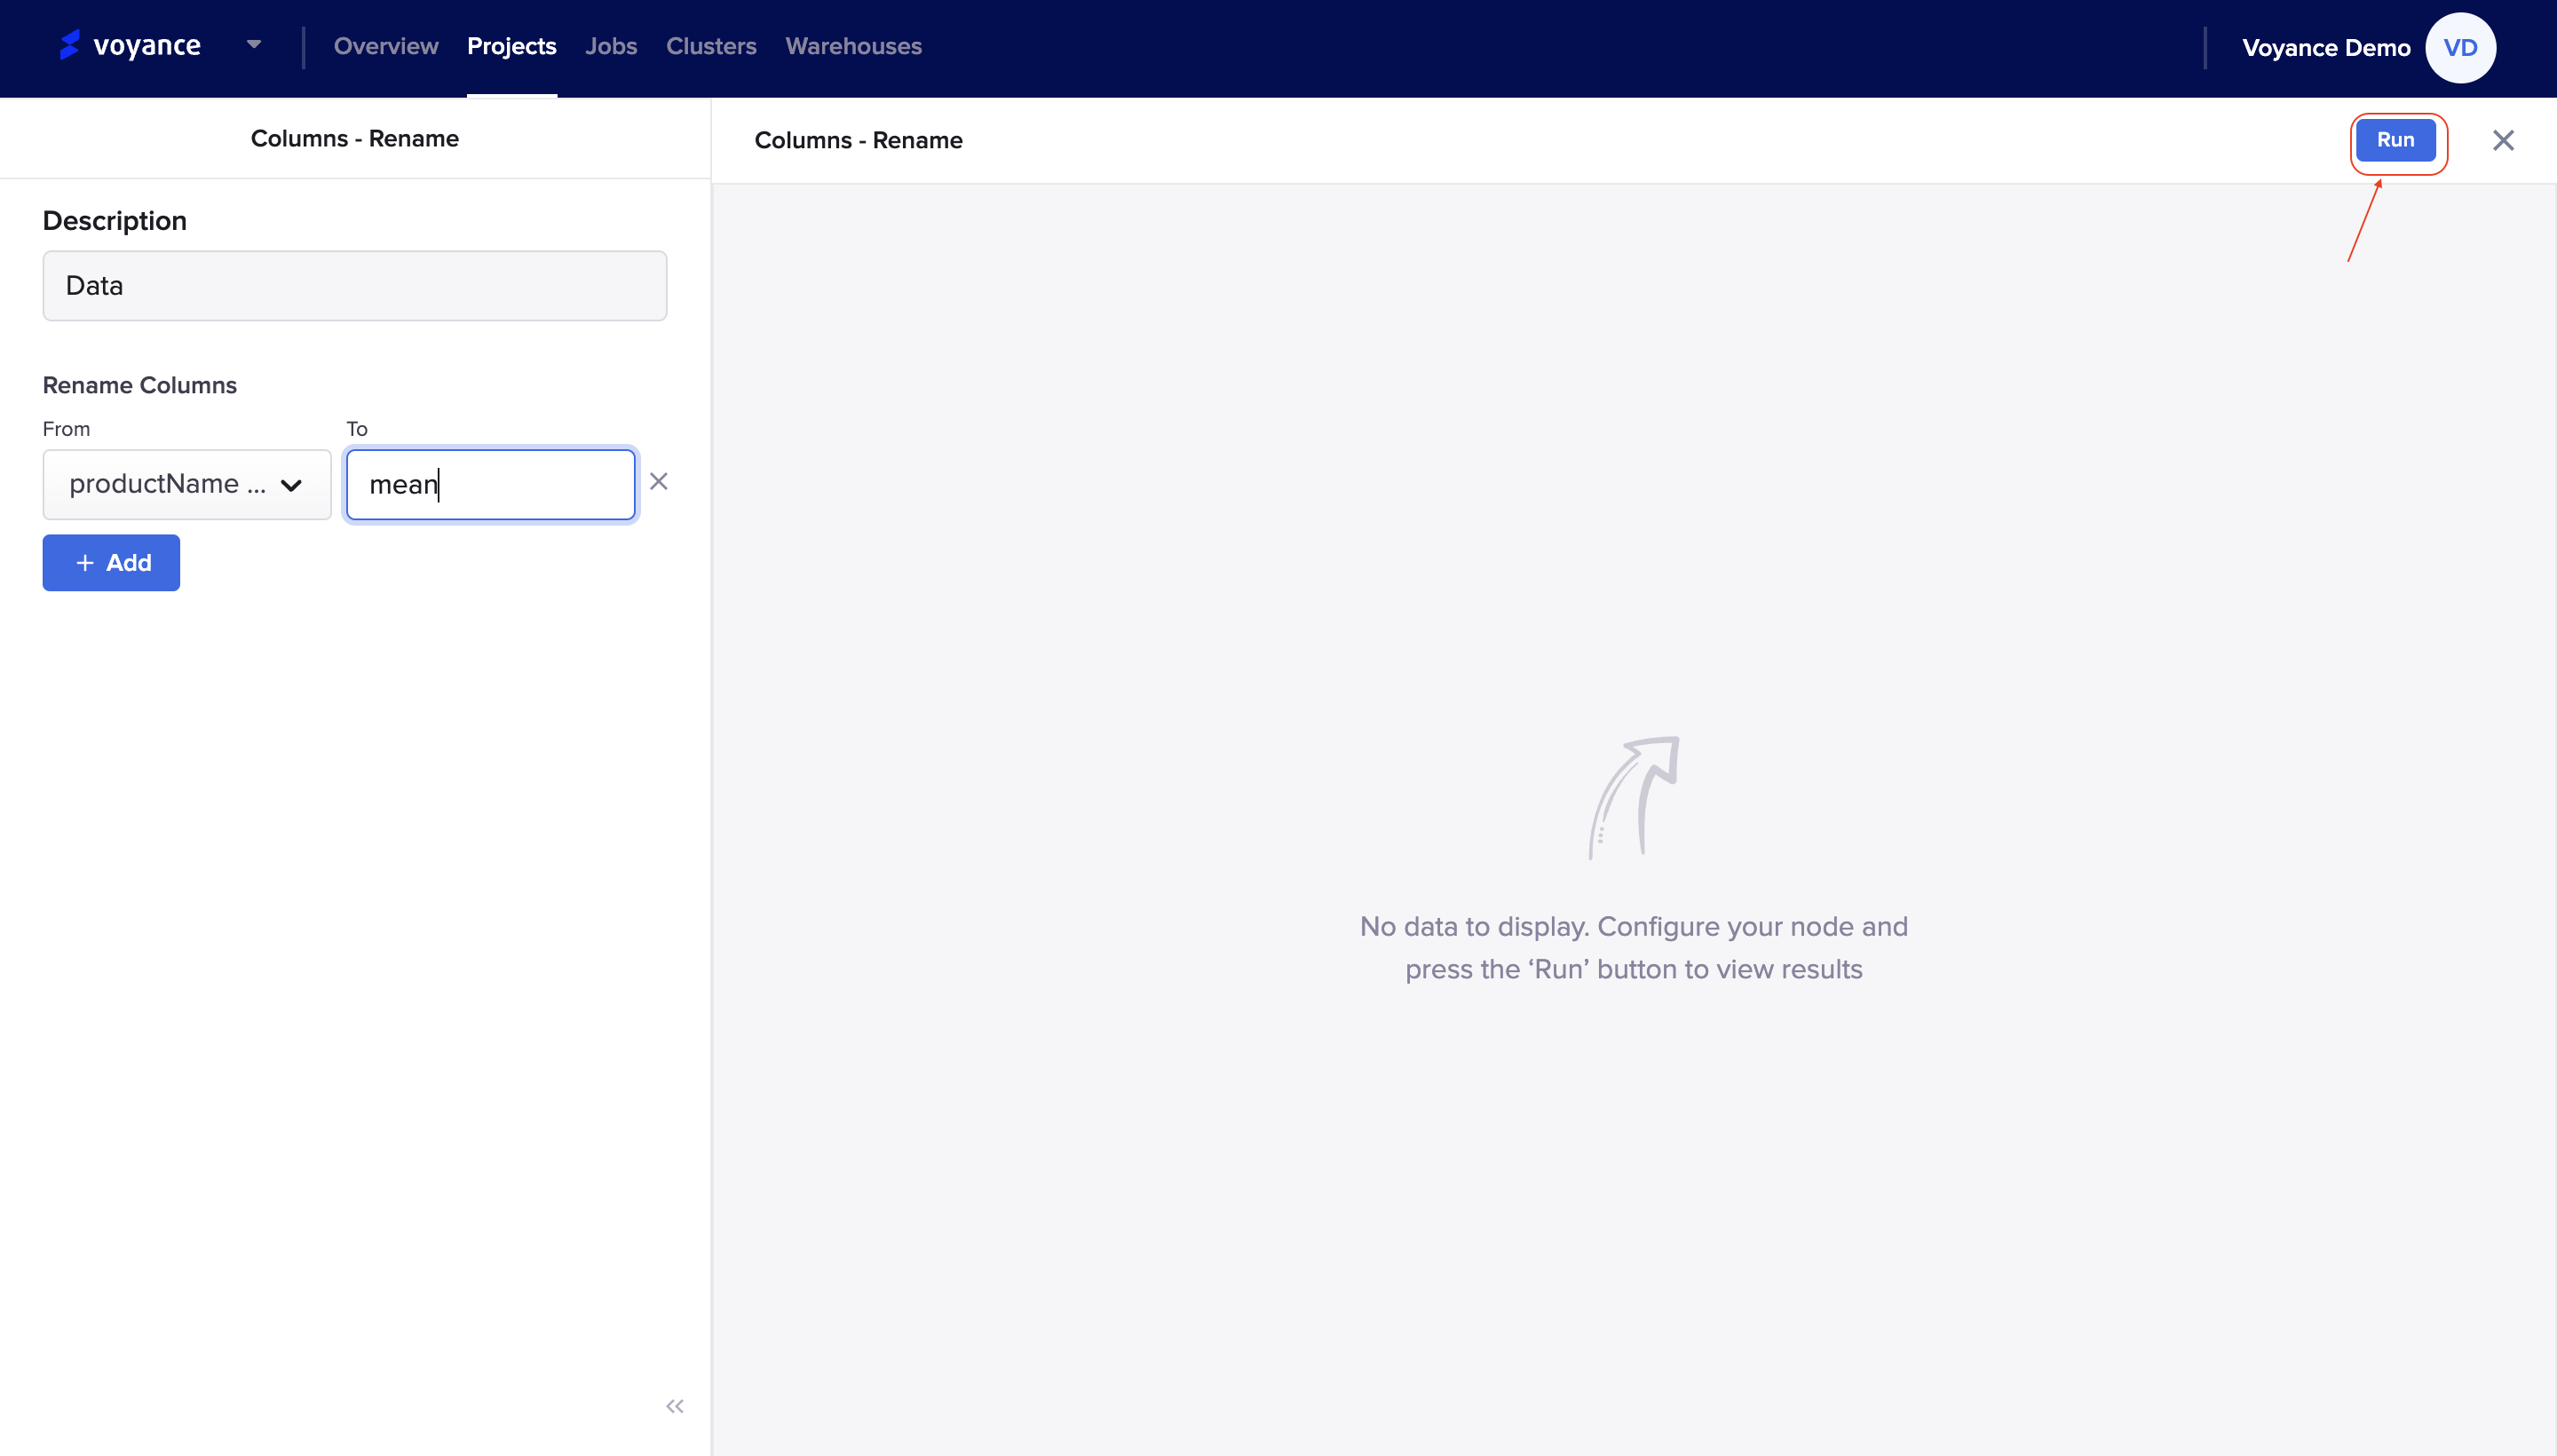
you will be redirected to the rename dashboard to enable you to configure your datasets. You will need to fill in the detail of the data type or values of the data that needs to be renamed.
There are some parameters to take note of for you to rename a data frame or dätaset
Description: You have the option to describe the column you want to rename. It is optional.
Column Rename: It is the column that allows you to rename a data frame or dataset from one option to another option. You can add more than one column rename field to make any change. To add more fields, click on the “Add tab (+)” to add more data fields.
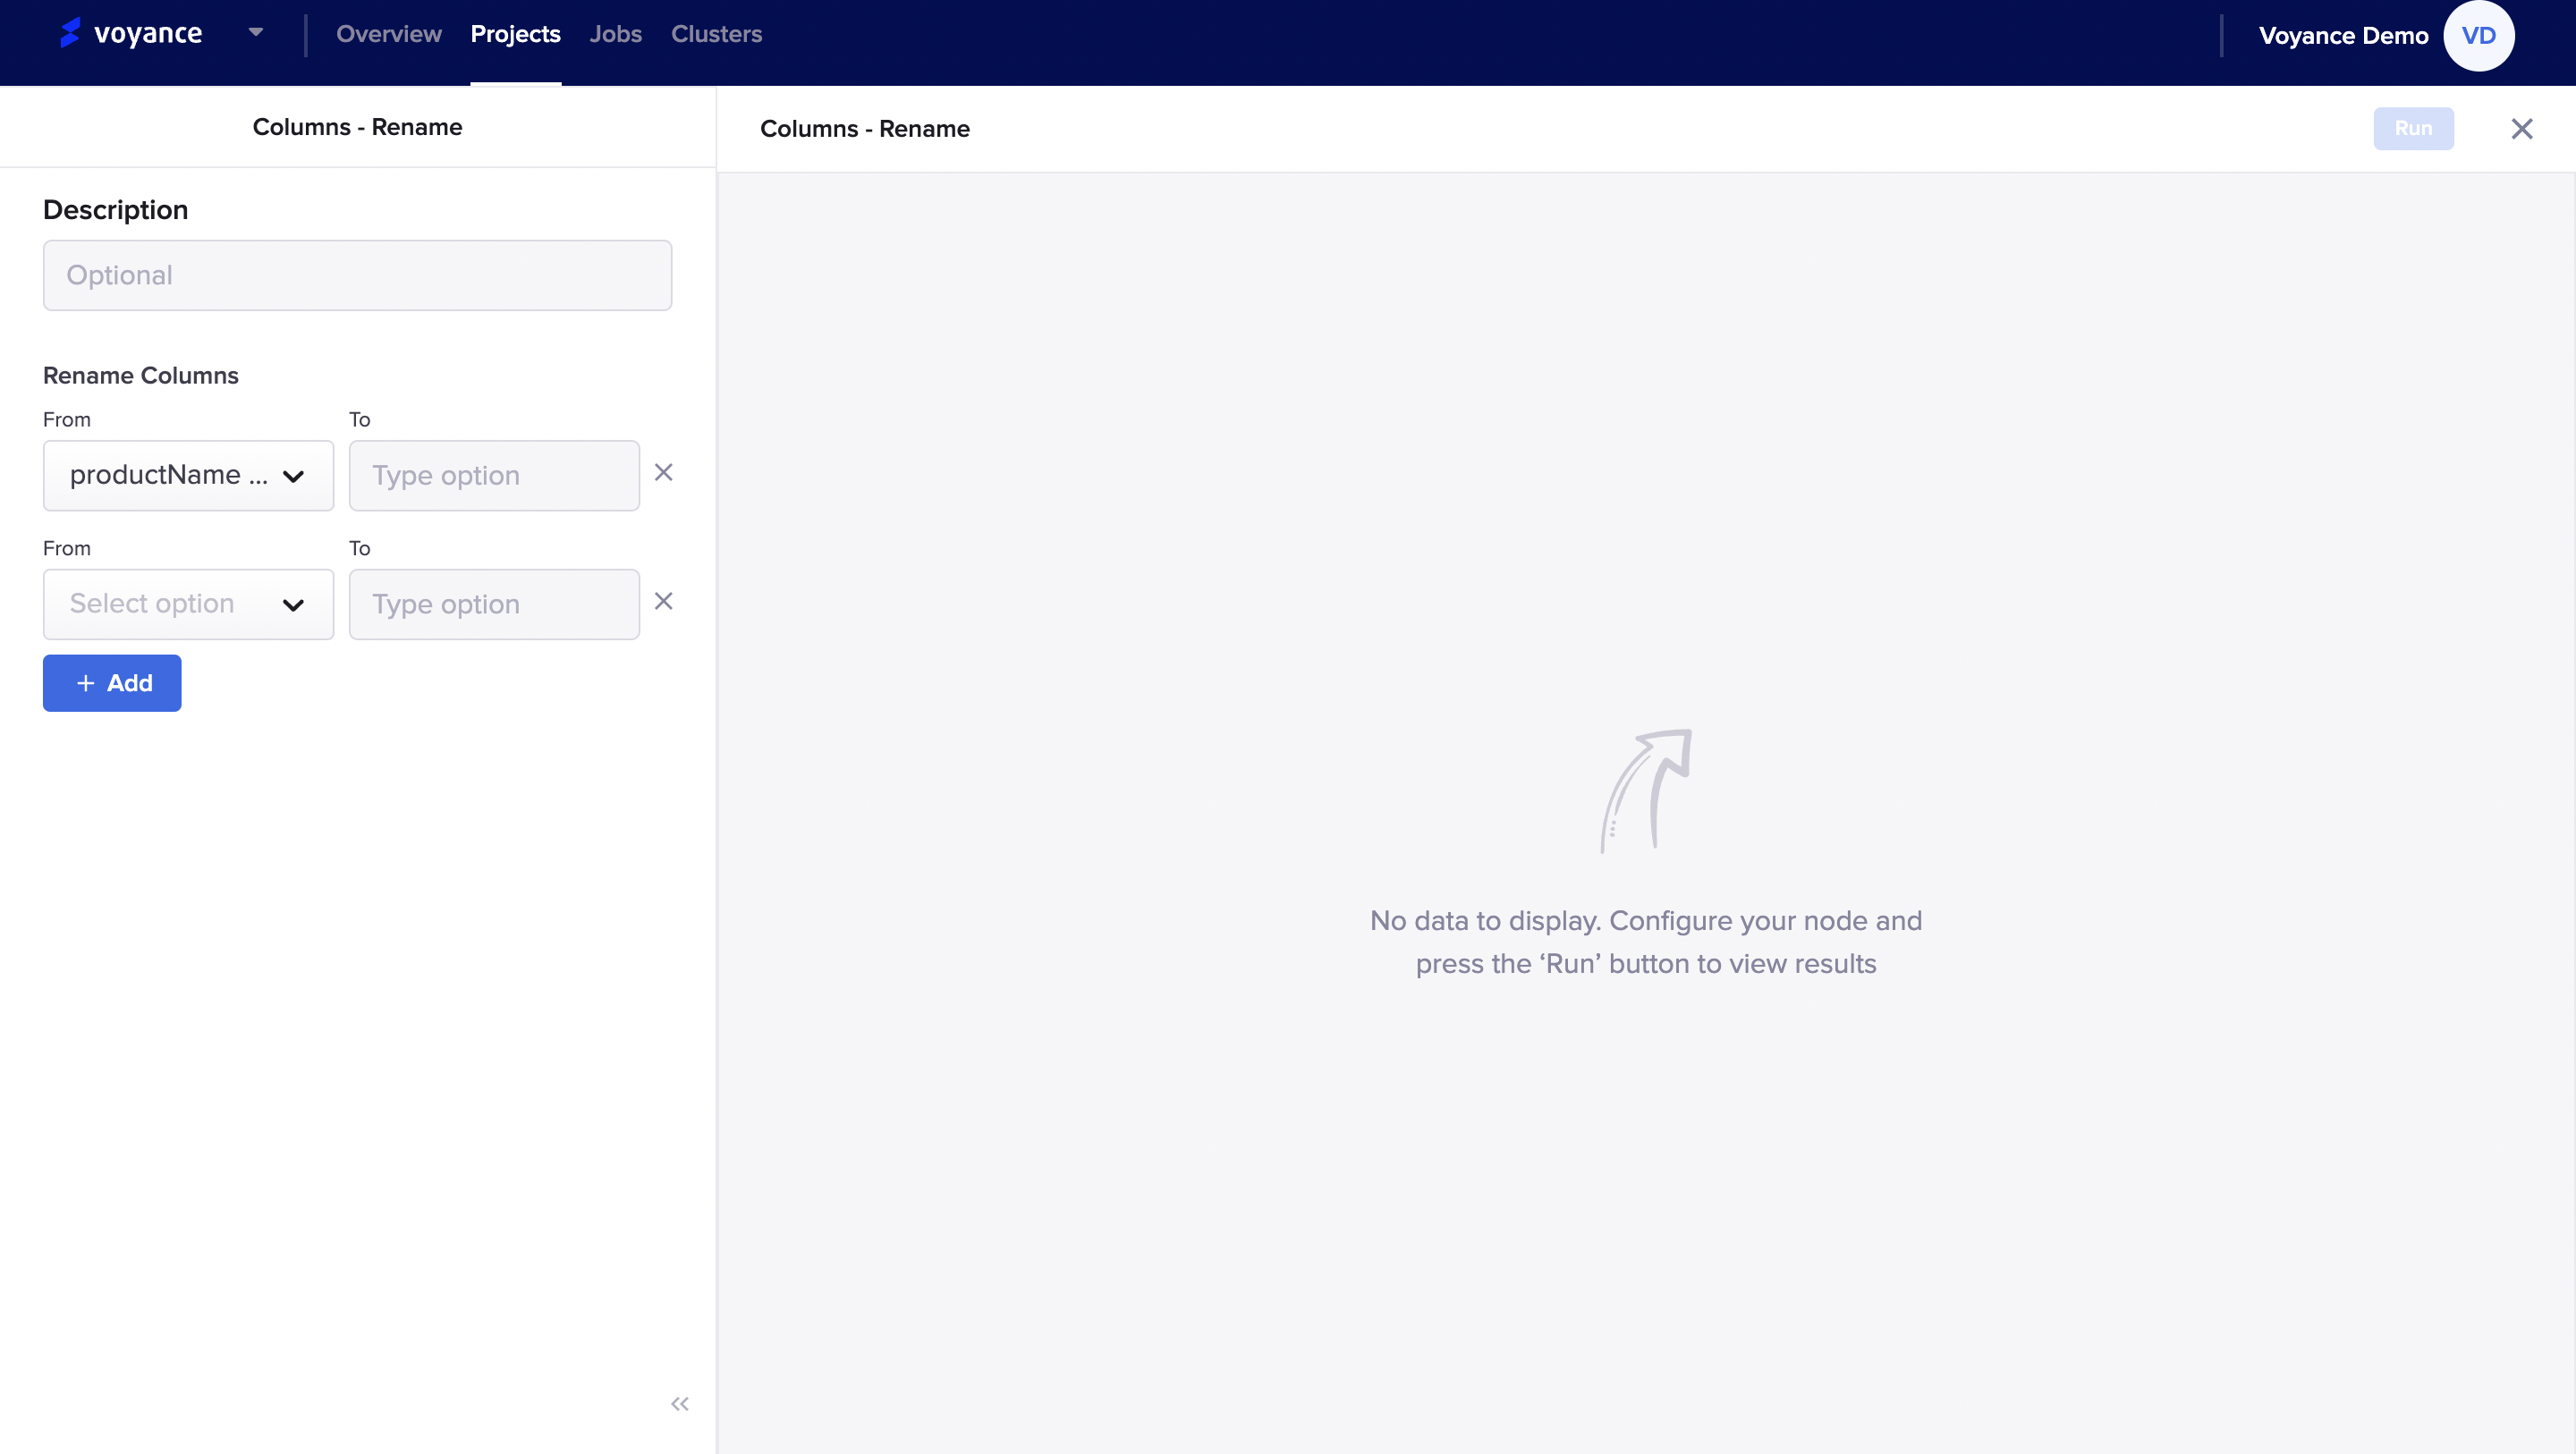
Cancel Added Column rename
Click on the “(X)” tab beside each of the column fields to delete or remove any added column
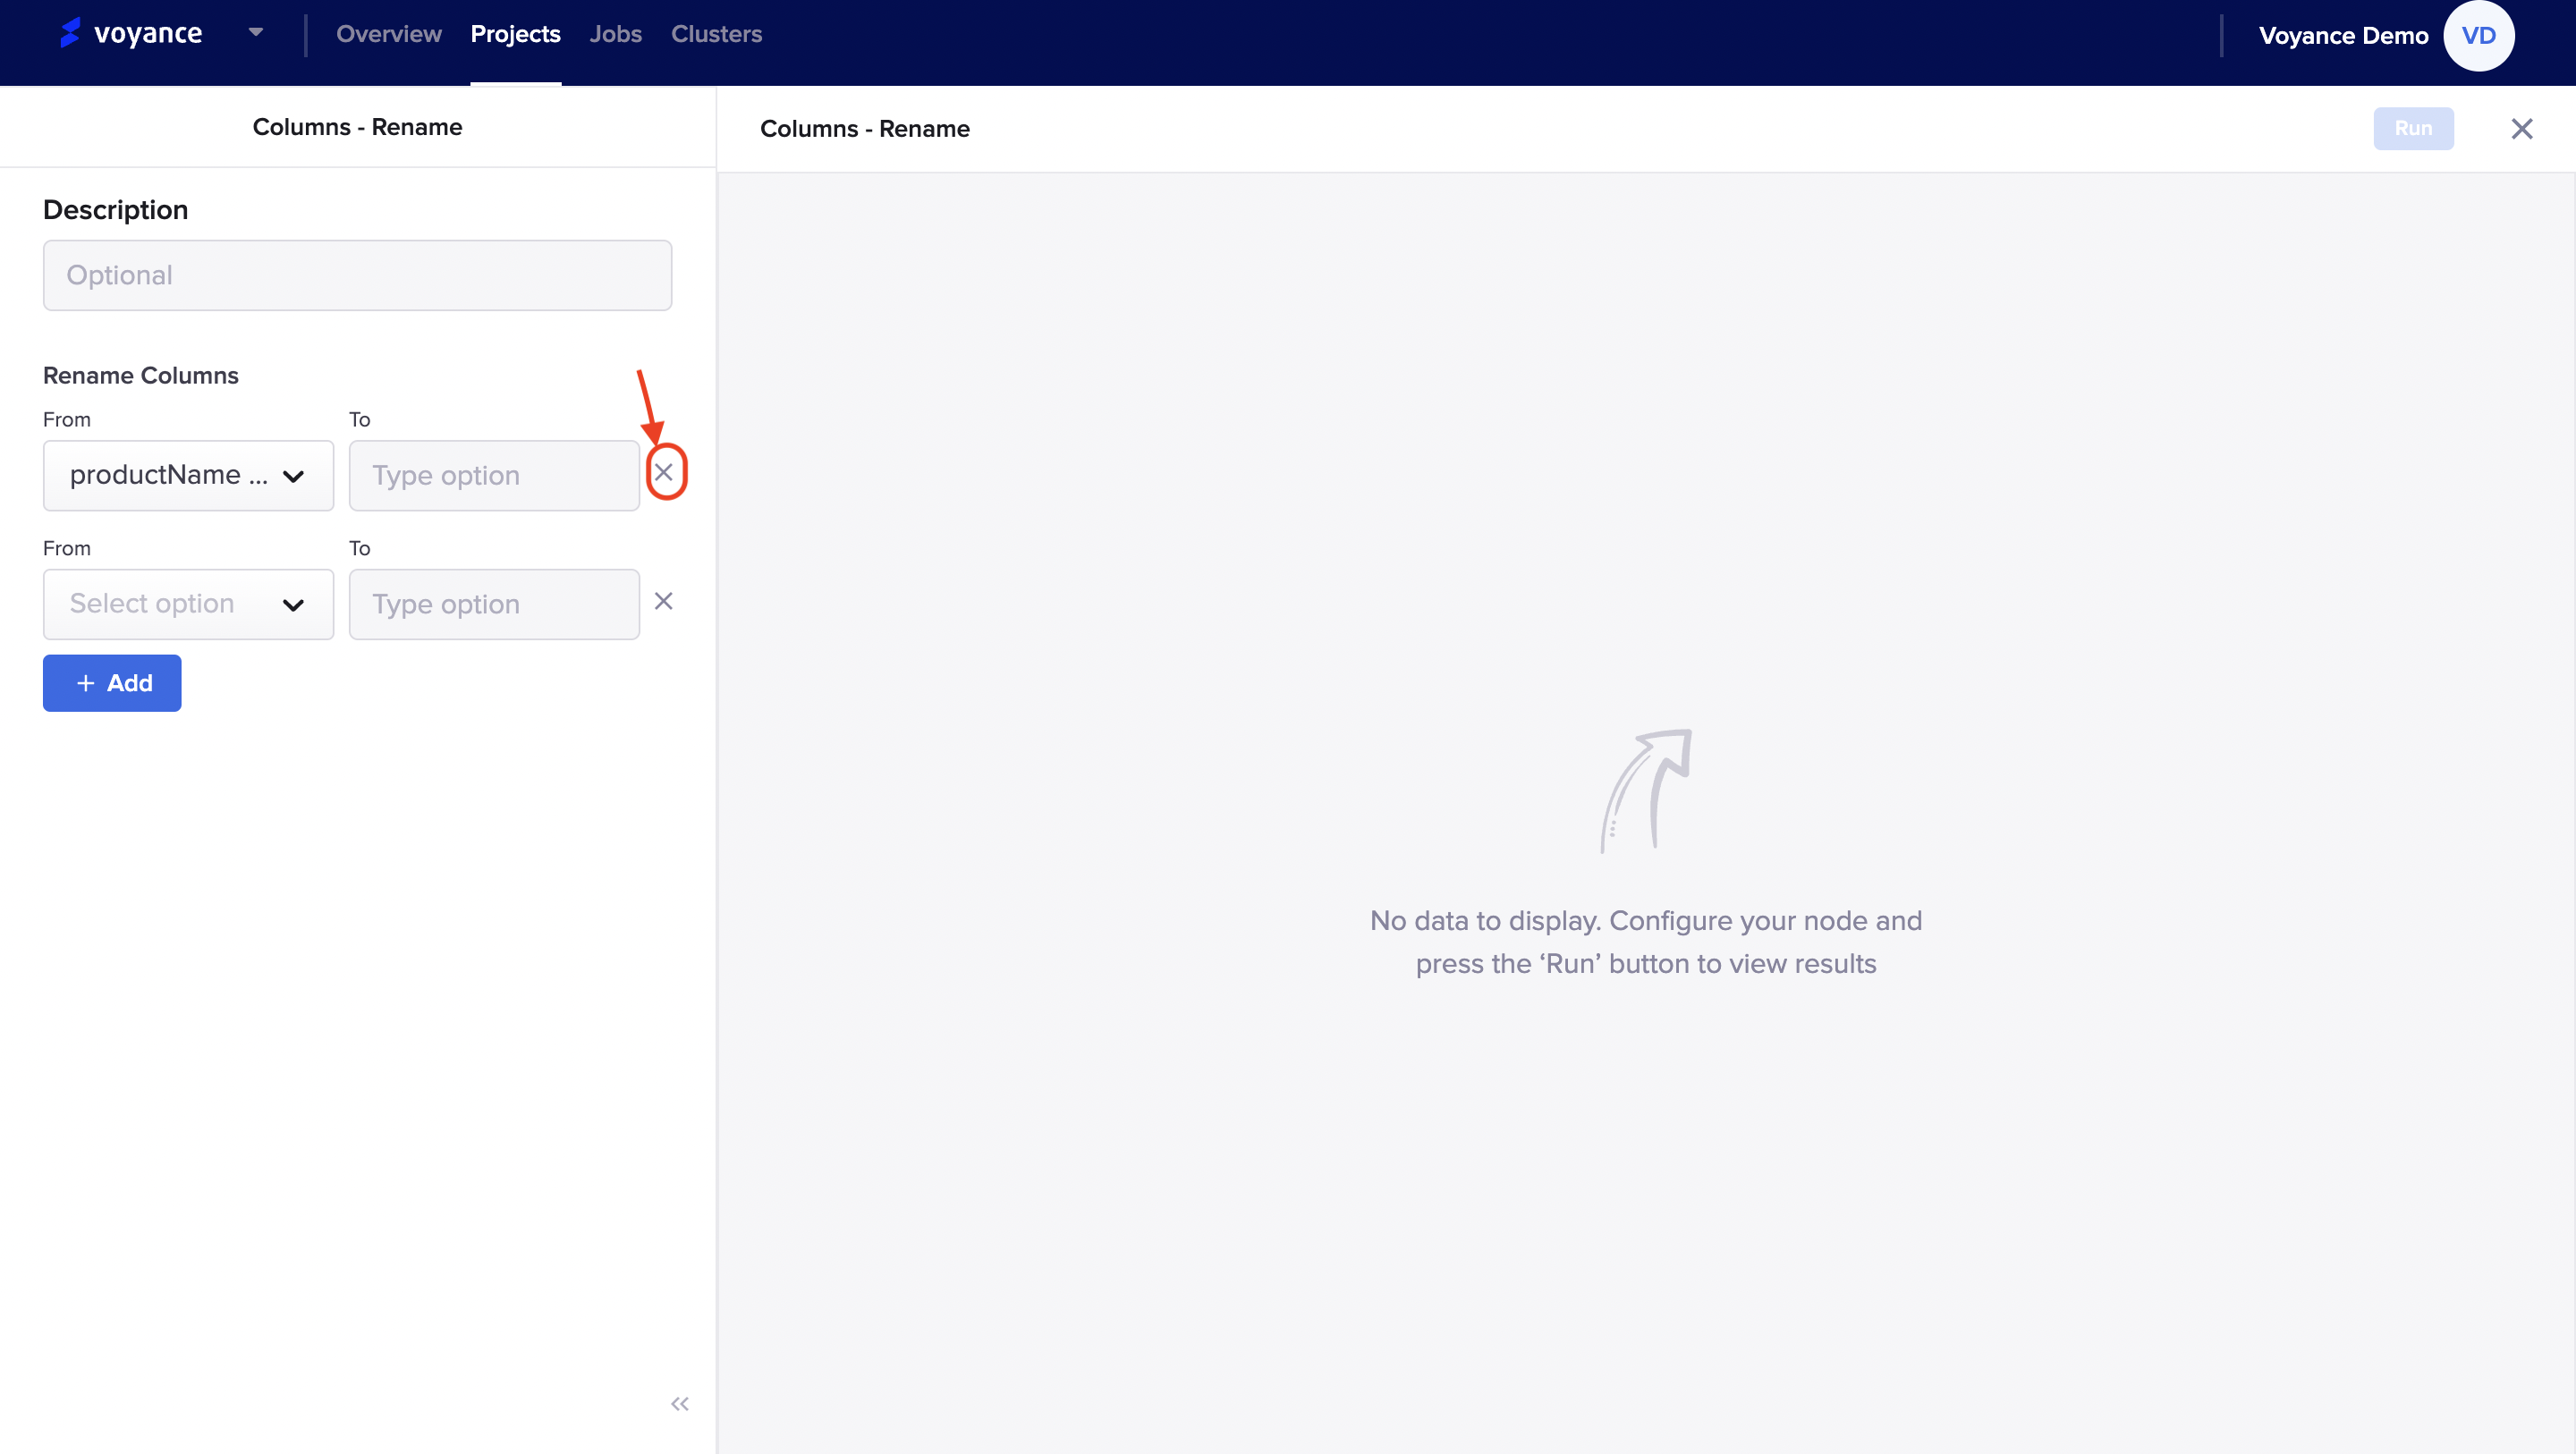
Run Program
Once you have added the necessary fields for the node to configure, click on the "Run" button to analyze and view the result of the data nodes.
Delete Column-Rename Card **
To delete the column-rename card that was dragged to the workflow, click on the Delete icon at the top of the dragged Rename card.
Sort
Sometimes, your datasets may not be well-coordinated or arranged as a result of the formats or structure, or there are unnecessary data values that are not needed in the datasets, so there is a need for you to sort out the data accordingly for you to effectively analyze your data
The Sorting process will enable you to put data values or types in order and visualize data in a form that is easy to comprehend.
To sort out your data type or frame, drag and drop the “Sort dialog box” under the column operator to the project workflow.
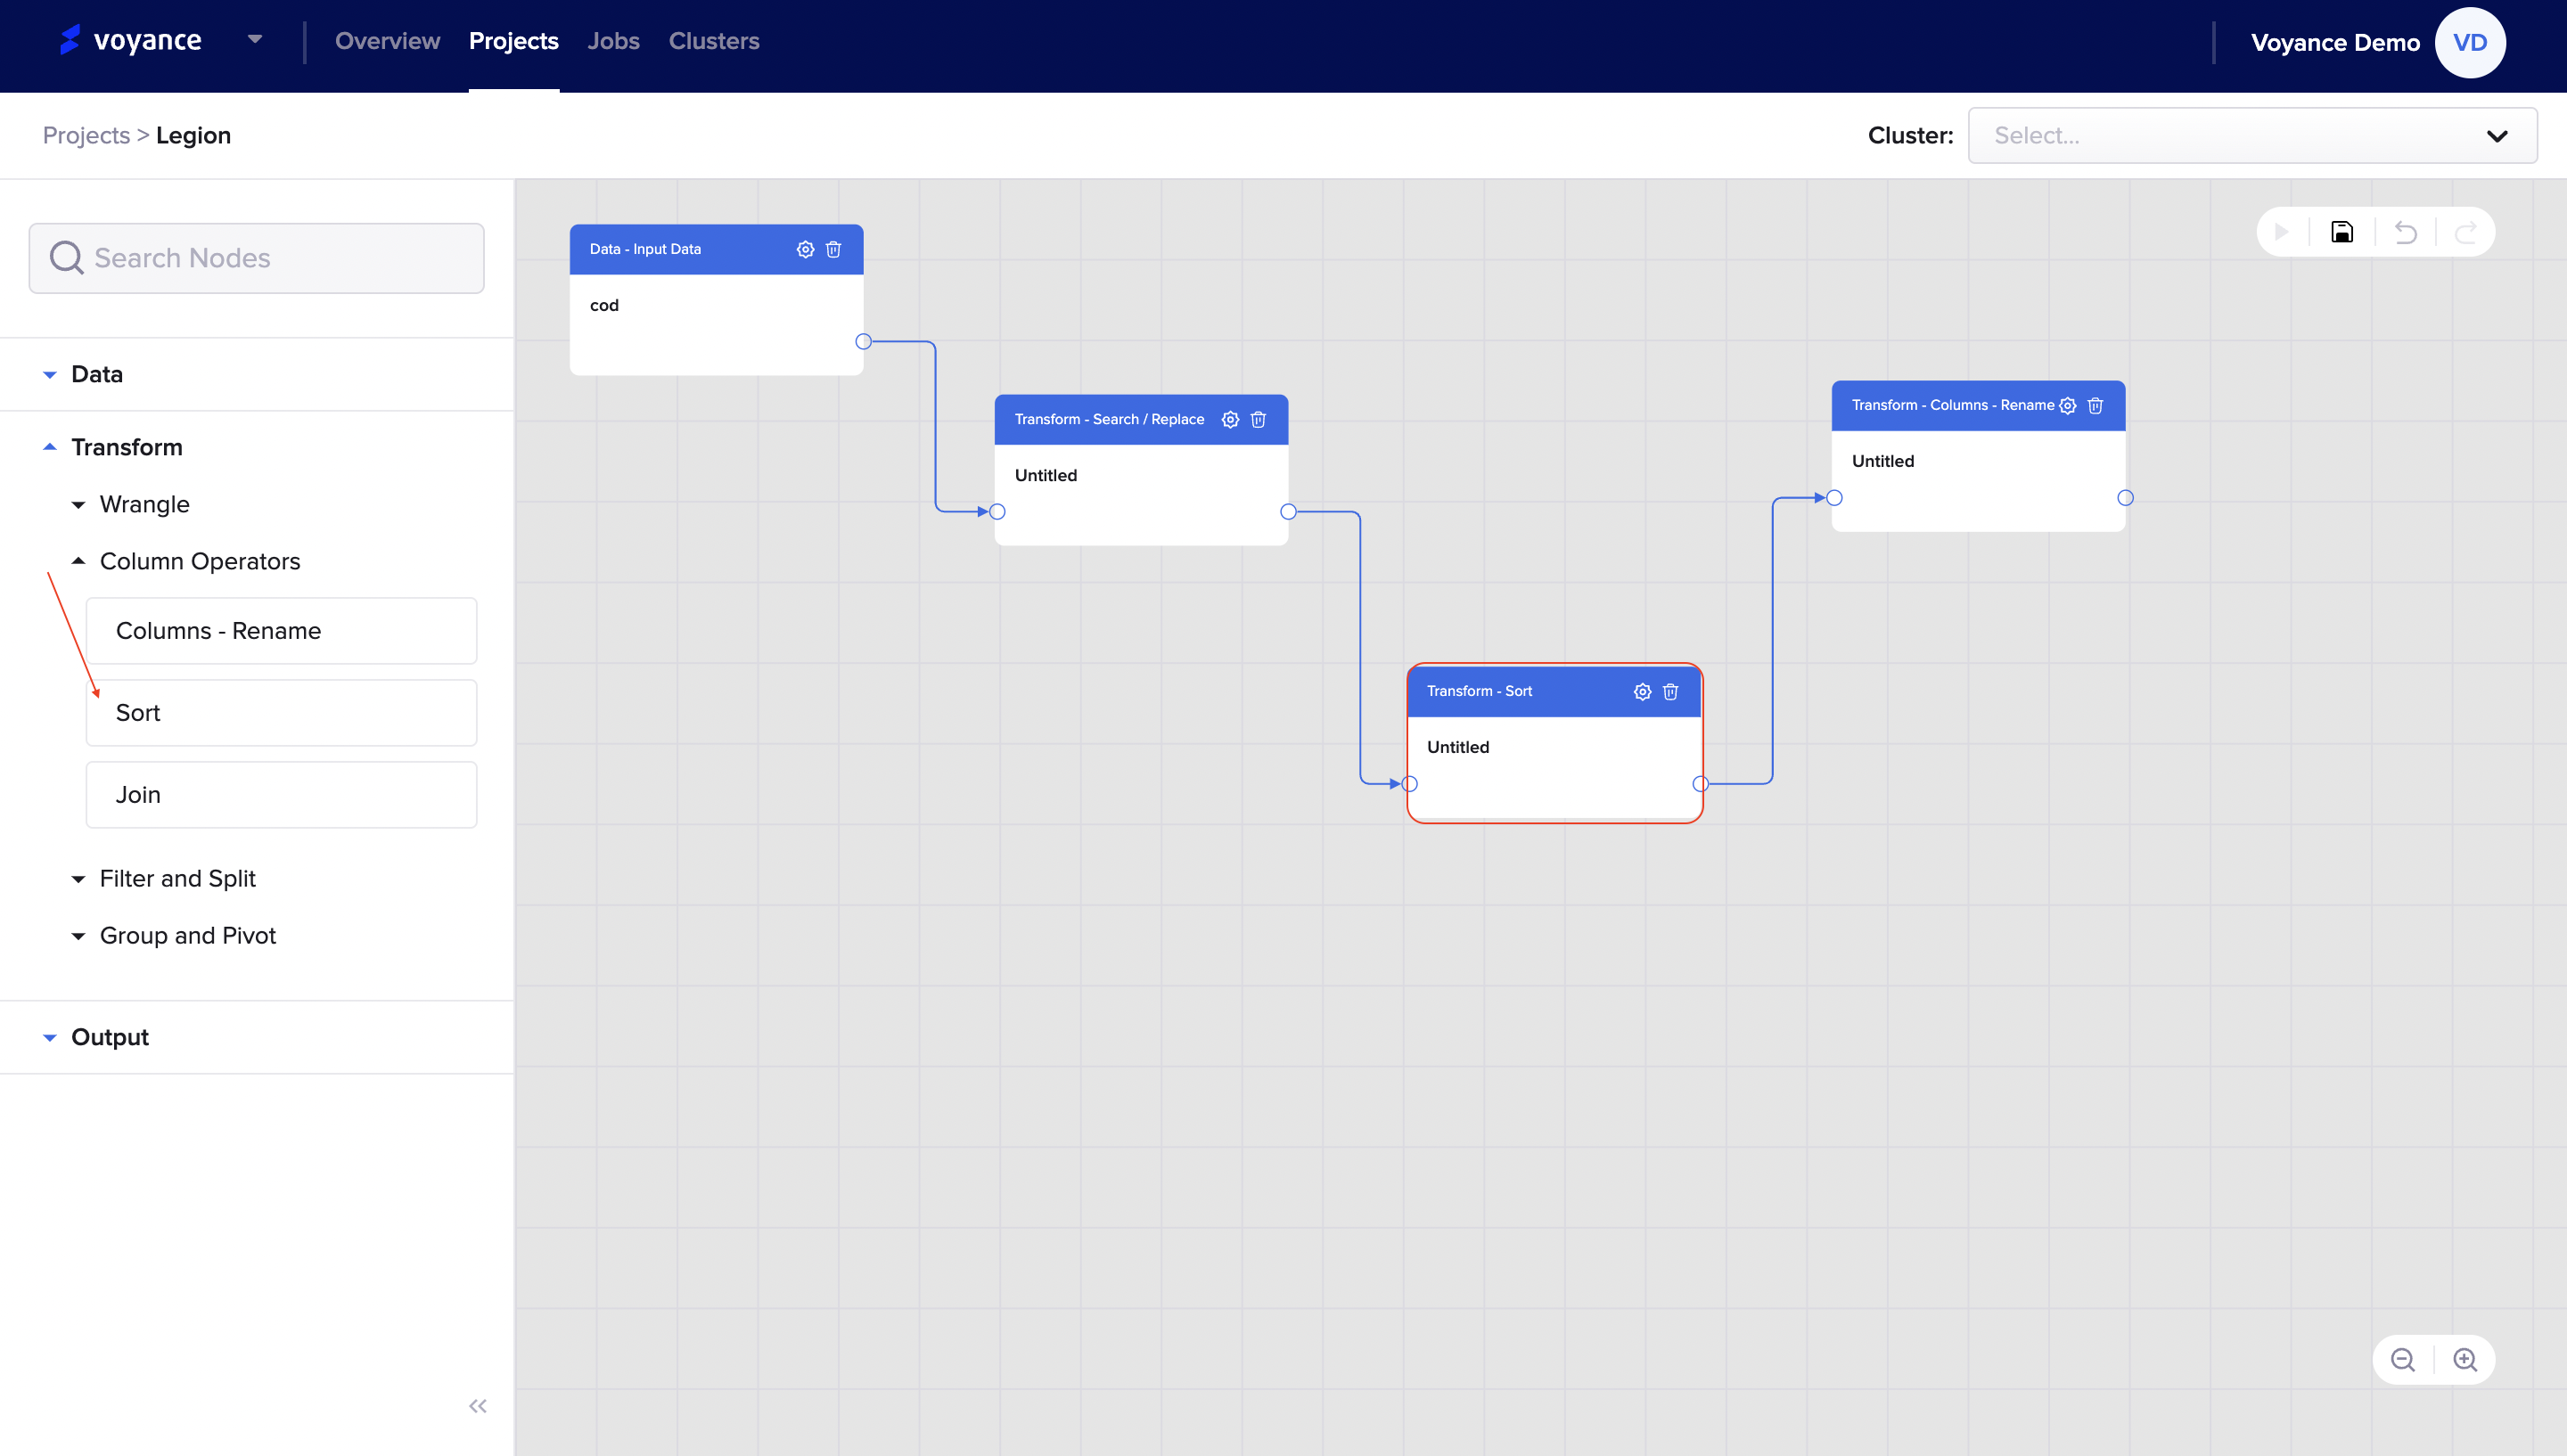
Column-Sort Editor
To edit the dialog box to sort out your data, click on the “Setting icon” at the top right of the sort dialog box,
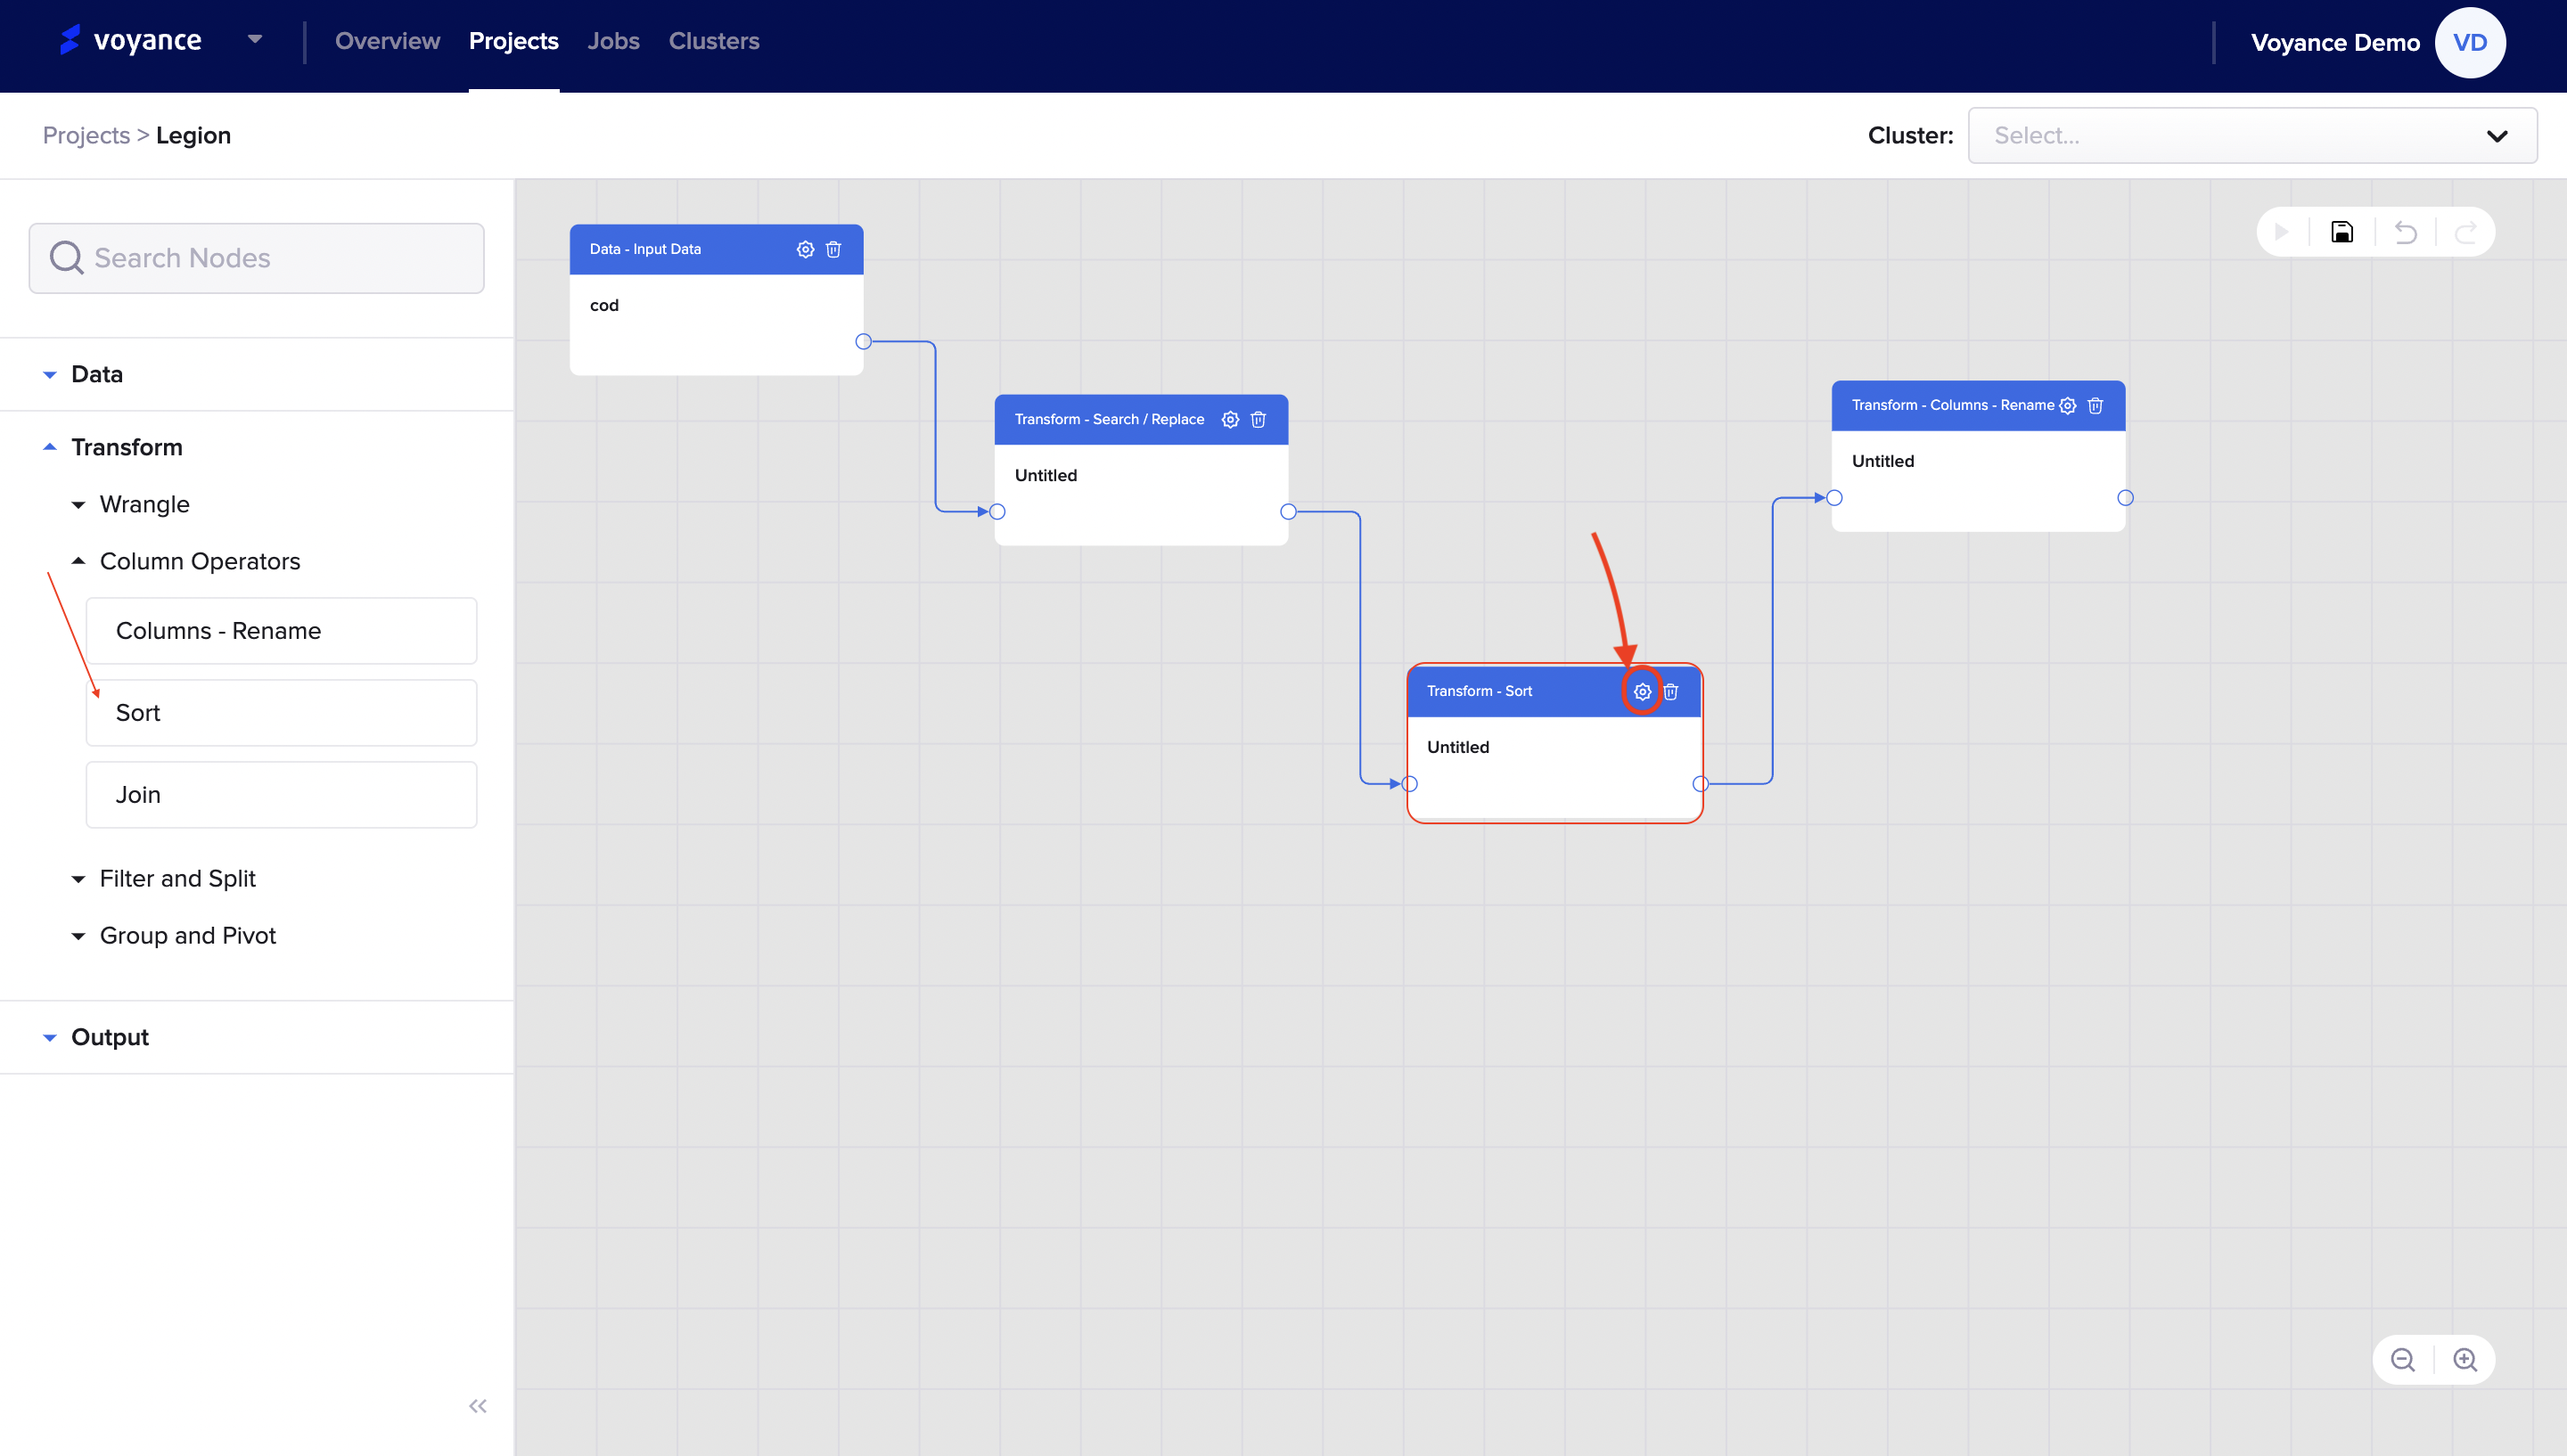
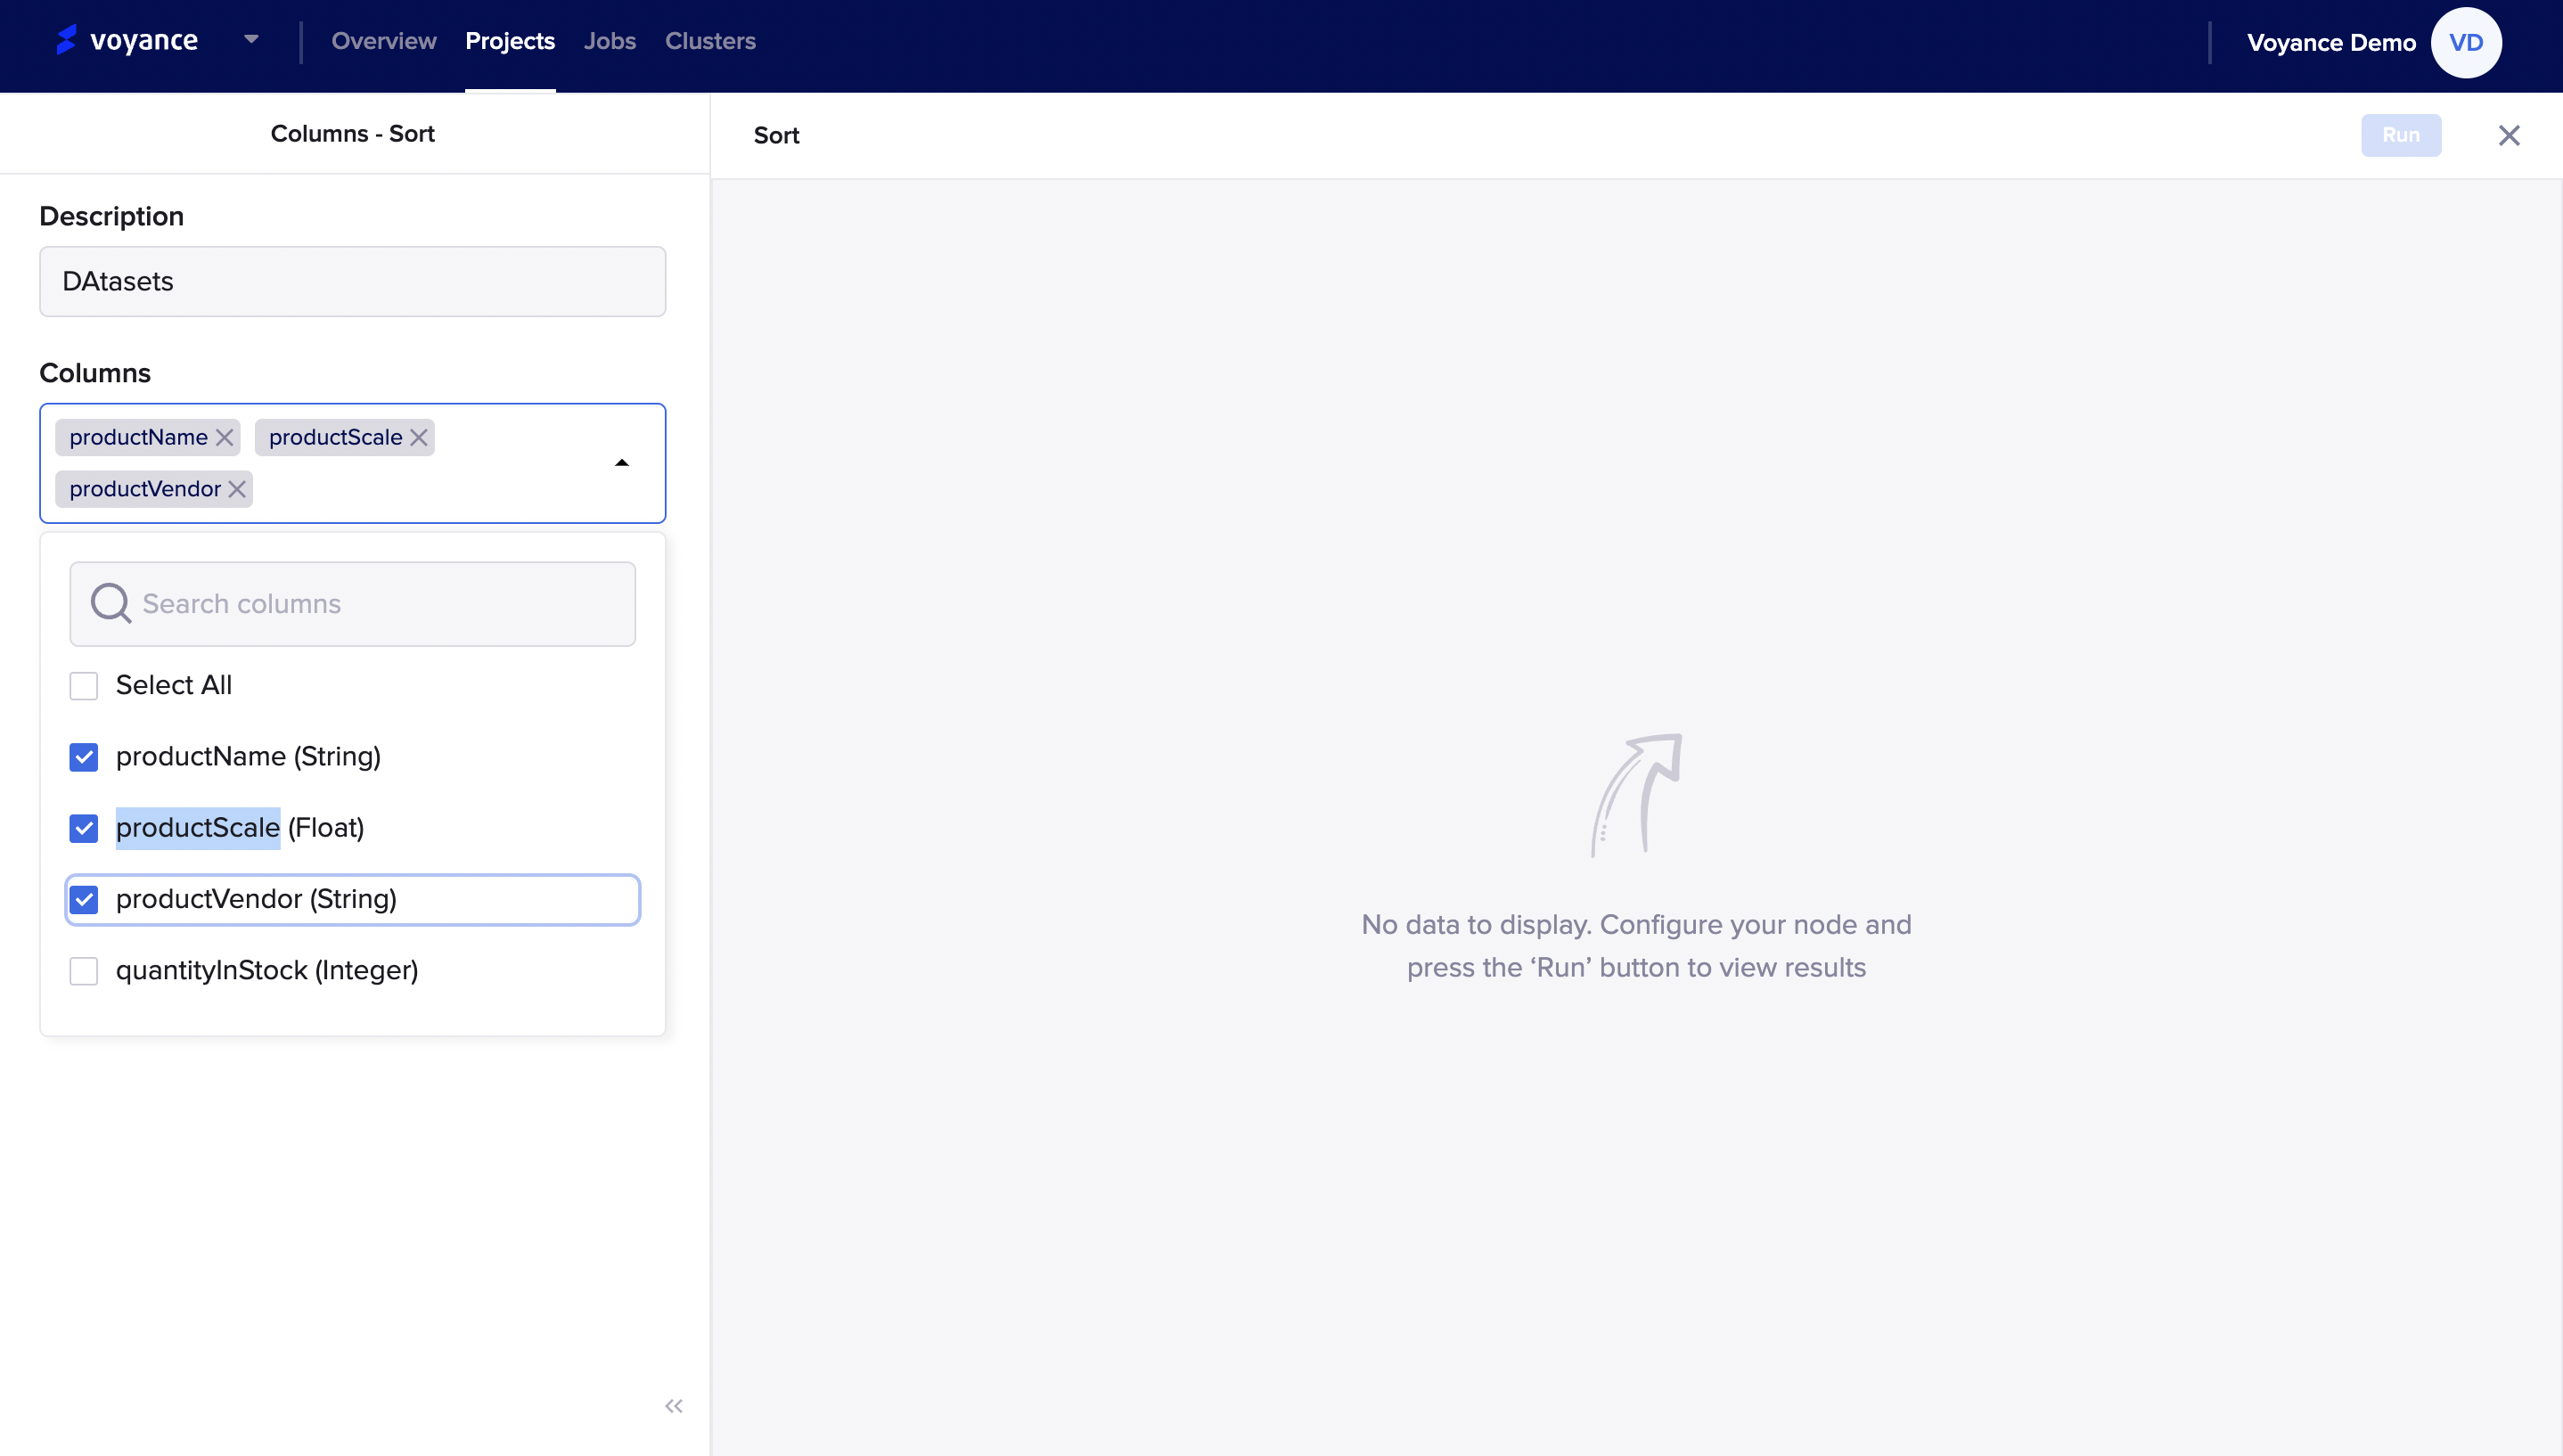
it redirects you to the sort page where you can sort out your data sets. Some of the parameters in the column-sort editors include:
Description:This is the name given to the column sort dialog box. it is not necessary to give it a name (optional). Once you name the sort column, it displays the name on the sort dialog box of the workflow.
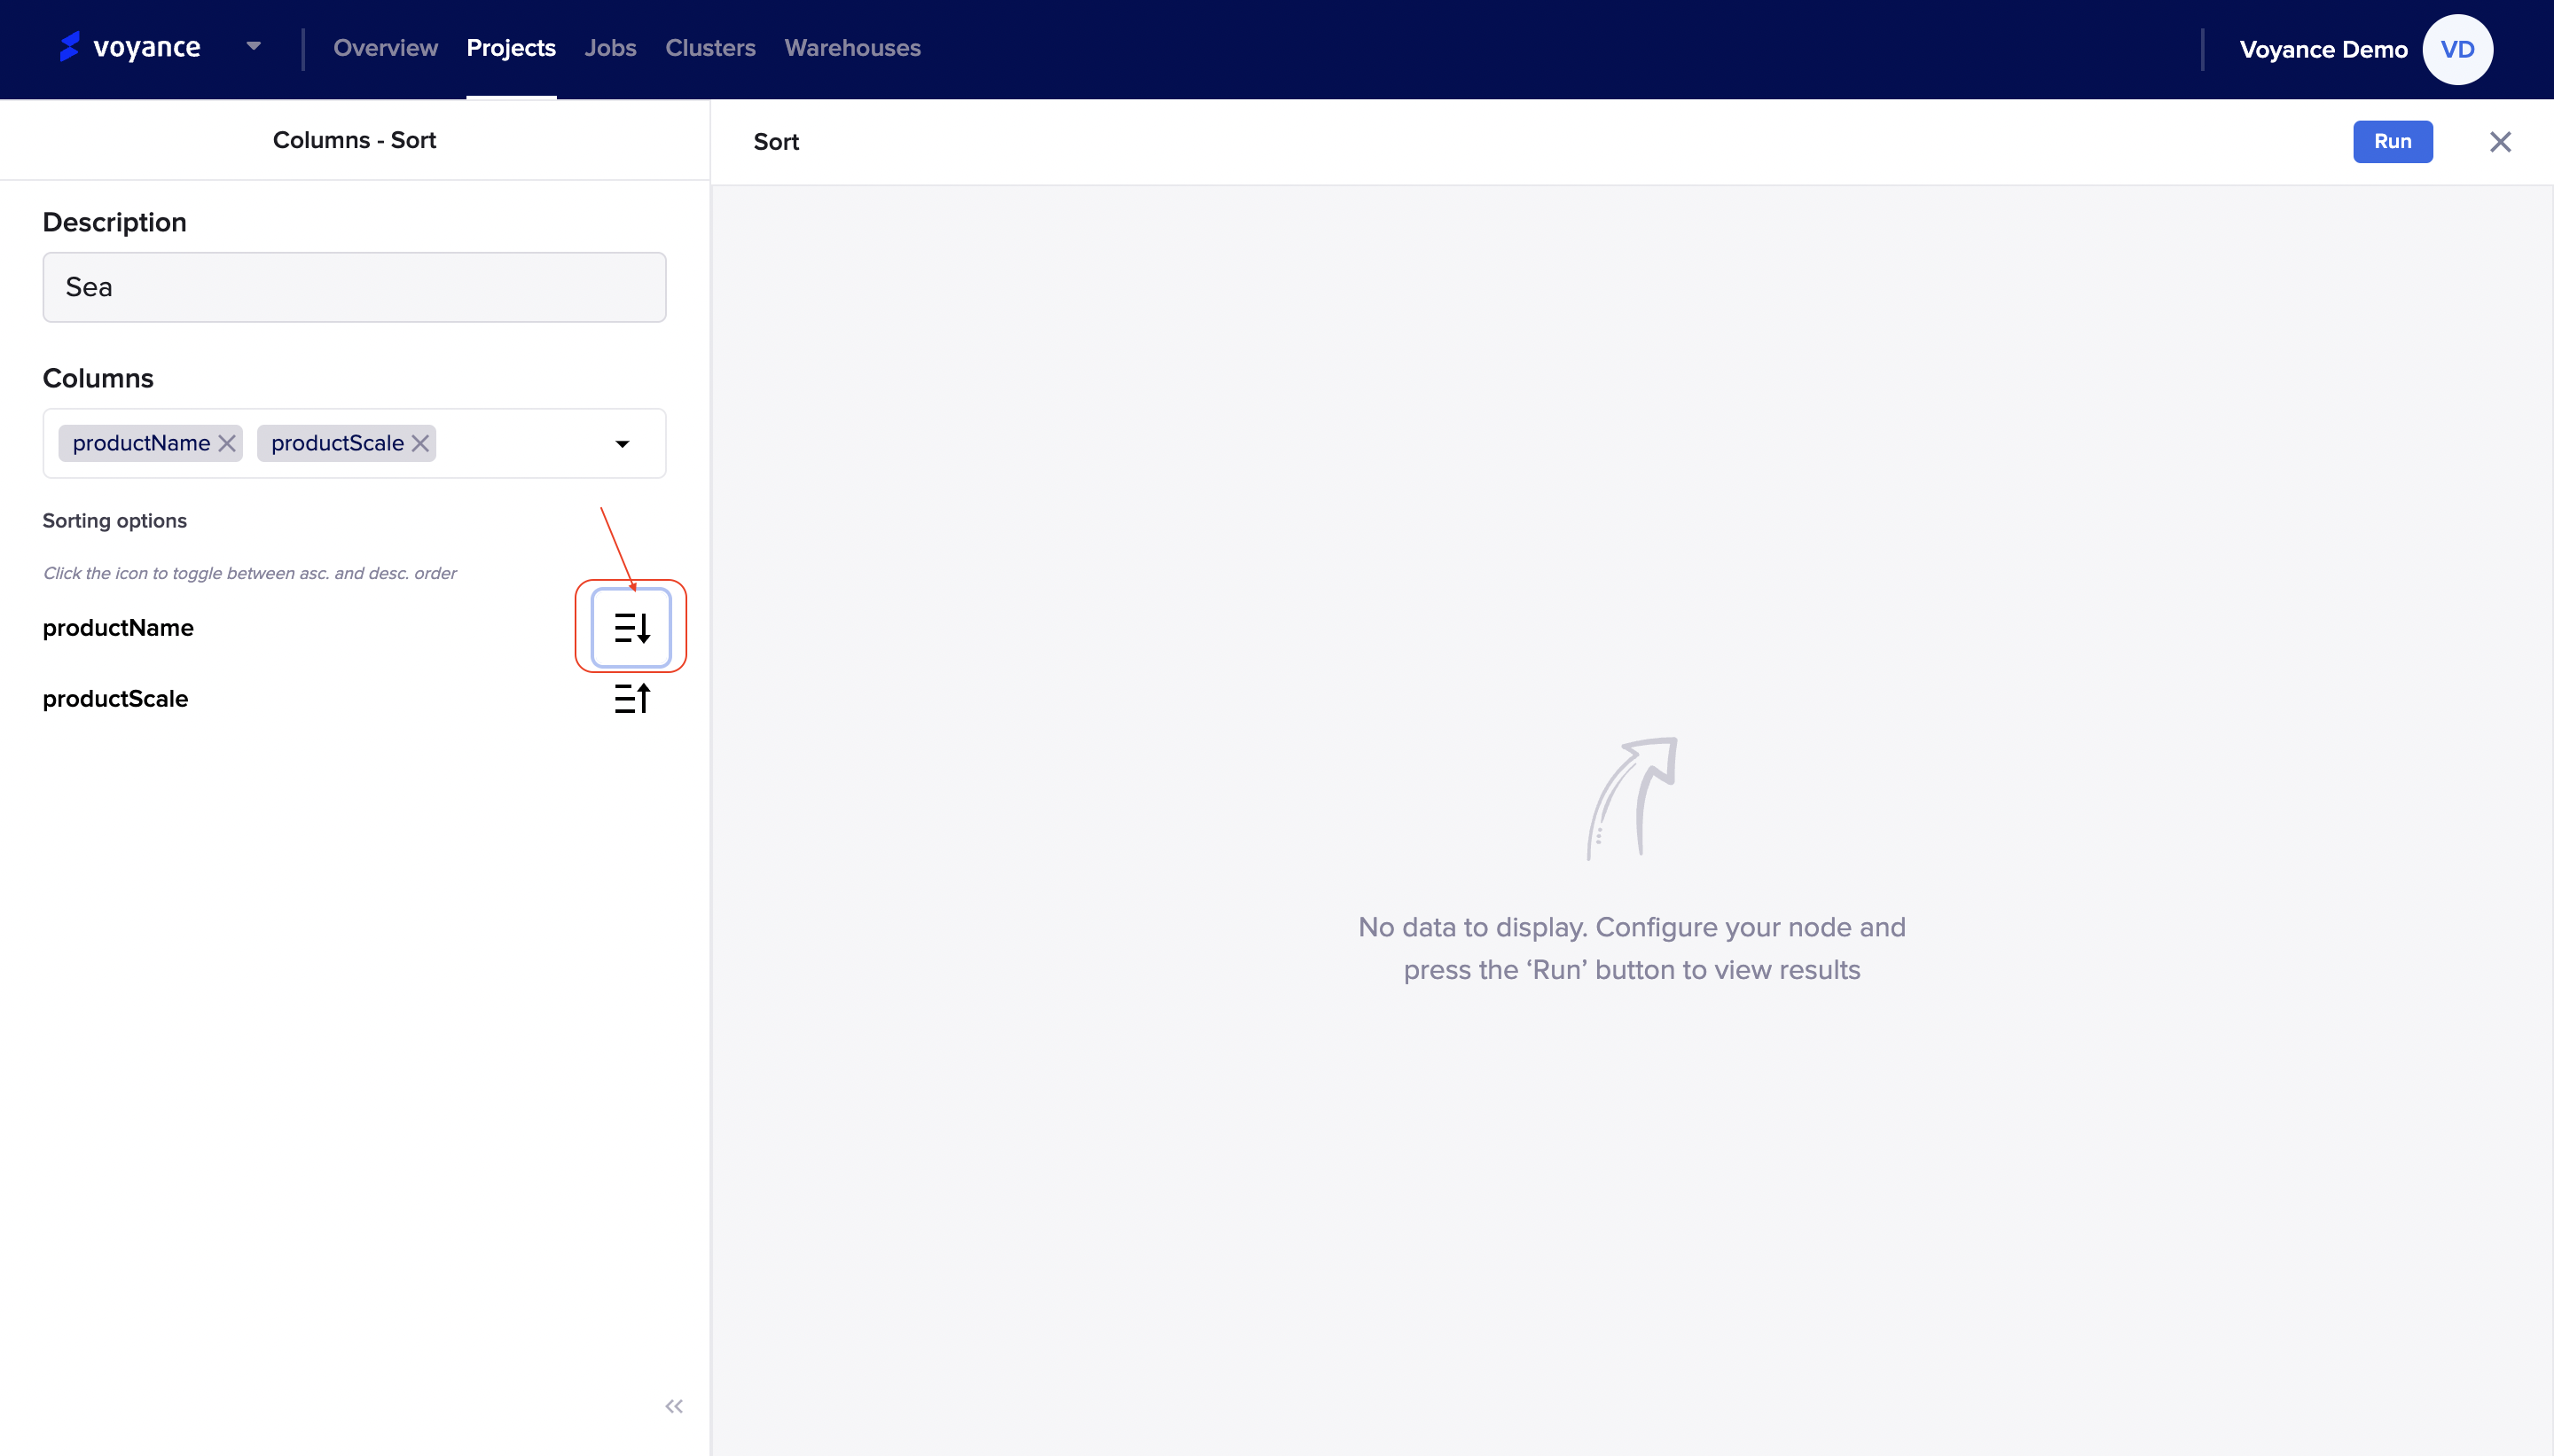
Columns: To sort out your datasets, you need to select the columns you want. To select a column, click on “Select Column”, there will be a drop-down of some input field to select from, click on the “Checkboxes” to select the column you want to use for sorting. you can select multiple checkboxes in the select column field.
You have the option to sort either in an ascending or descending order. Click on the arrow to toggle between ascending and descending order of the data
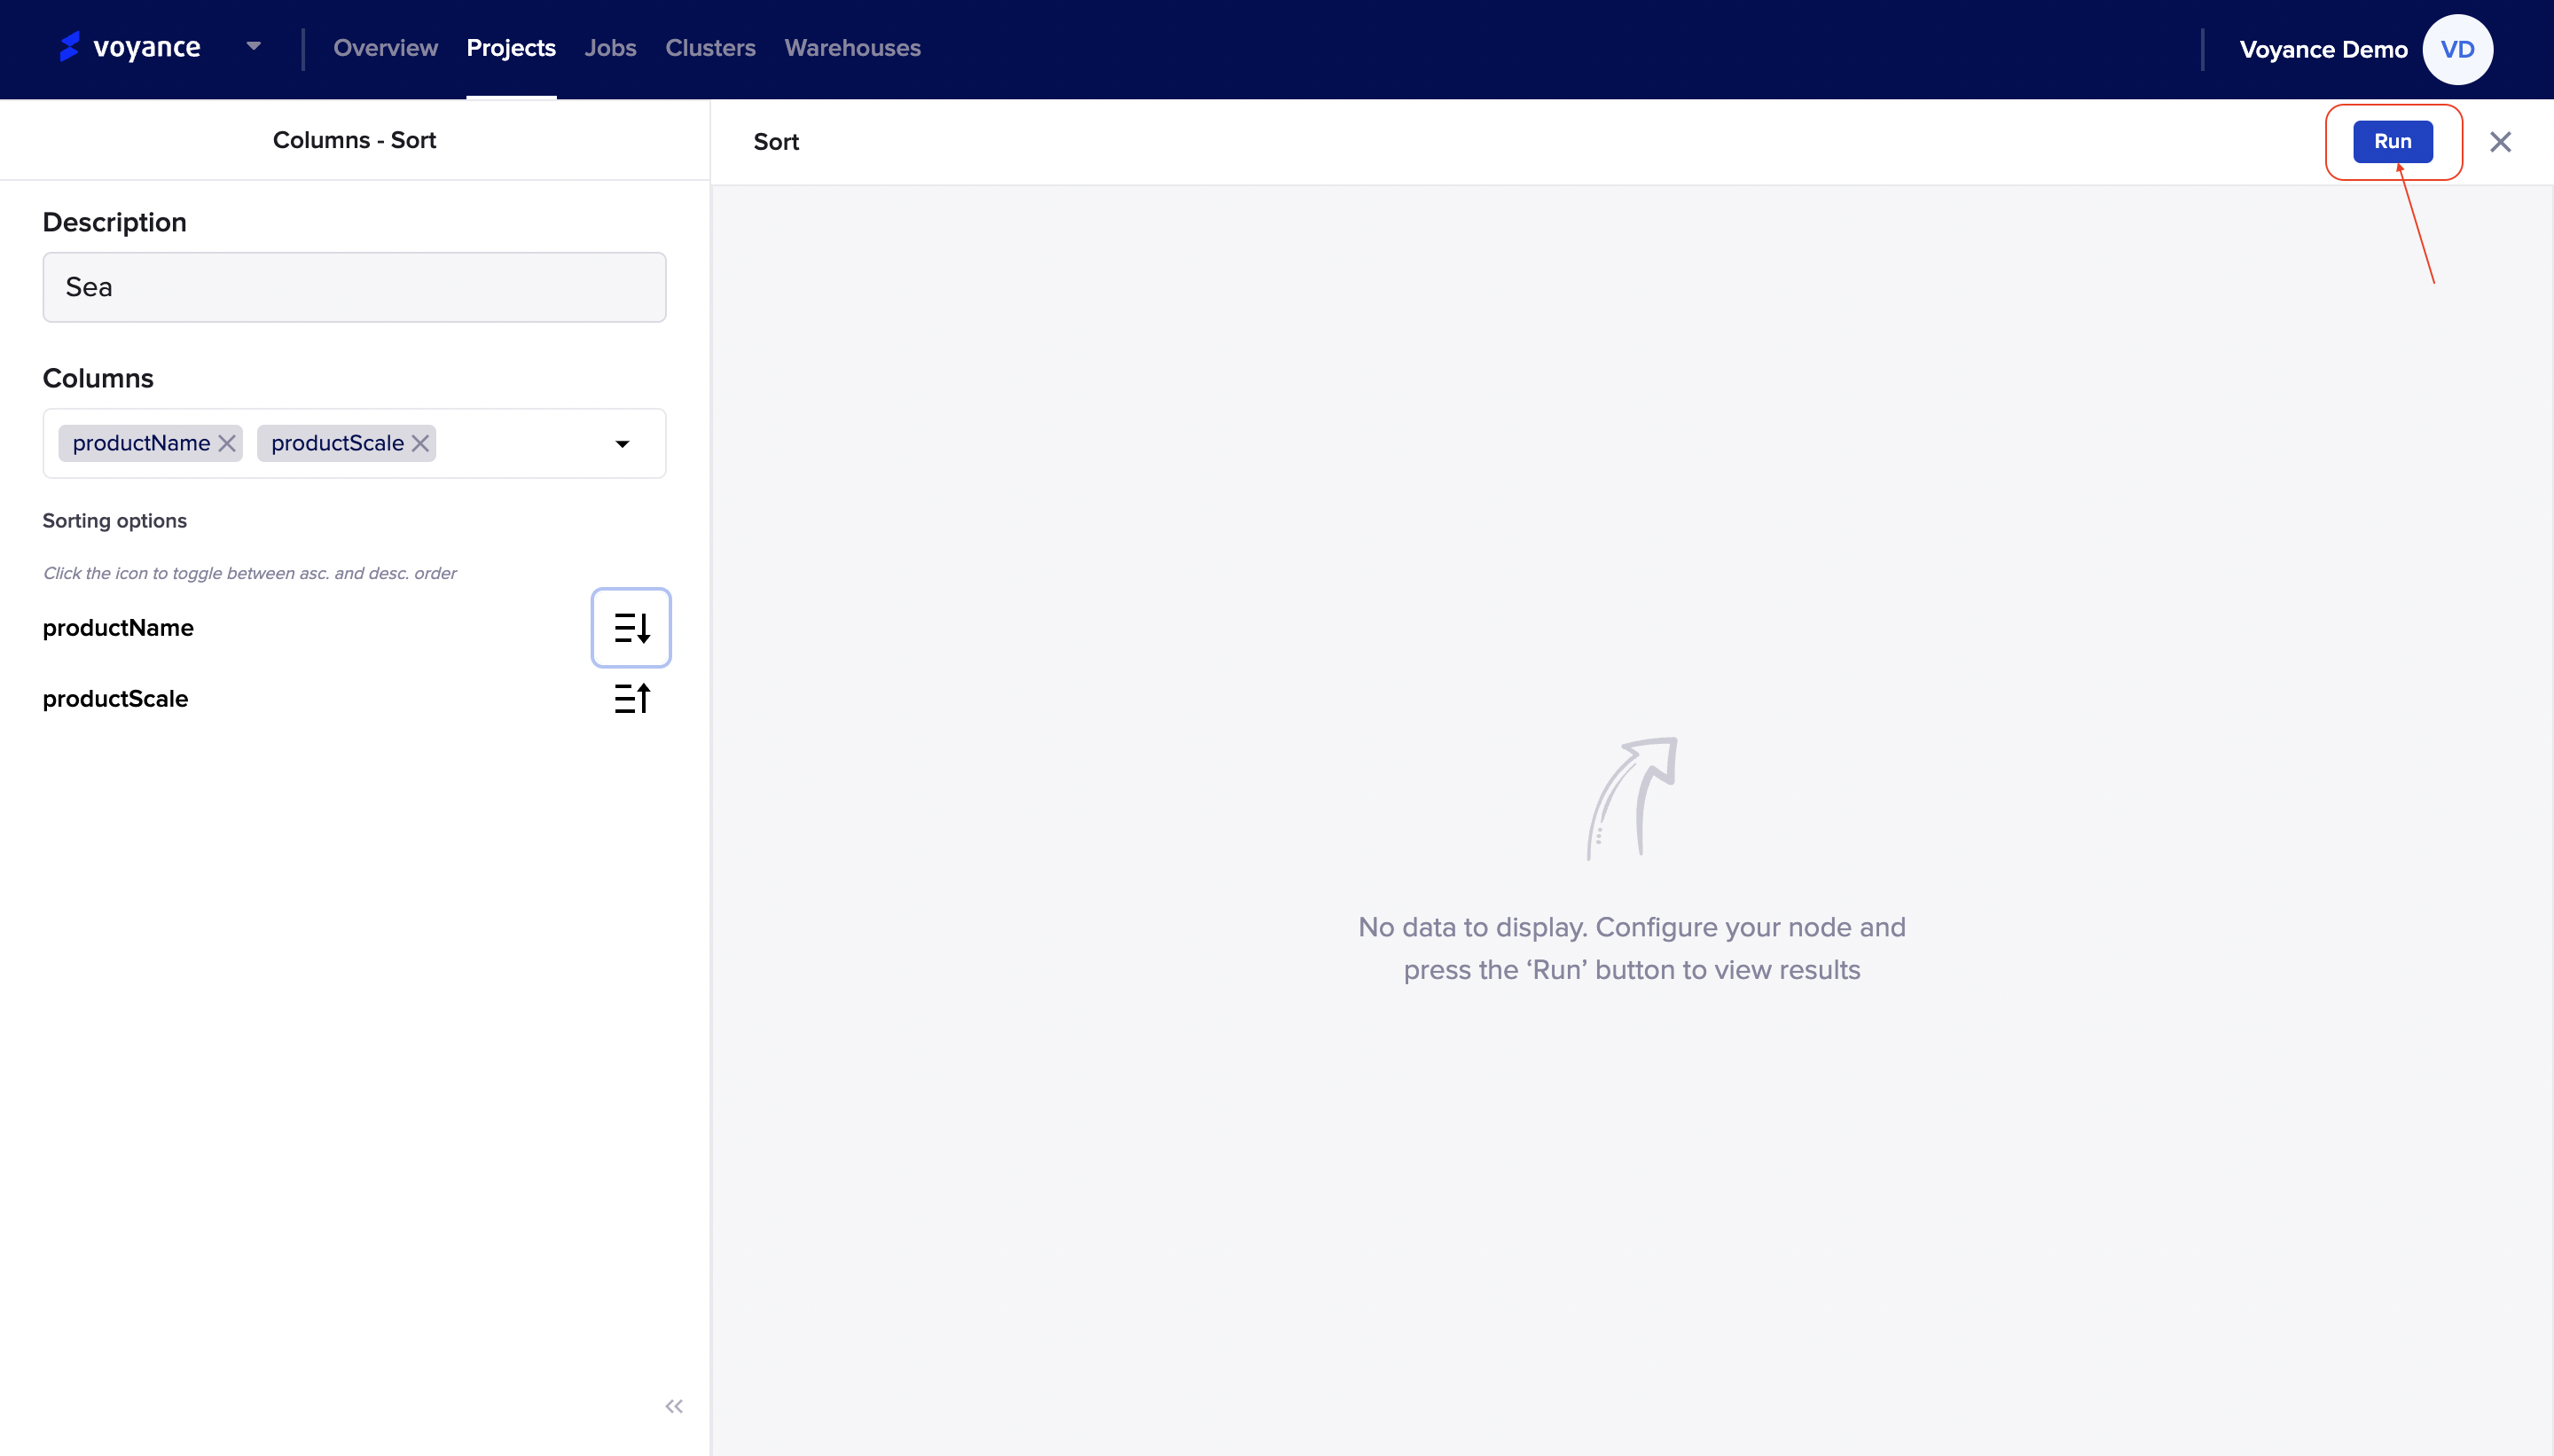
Run program
Once you have added the necessary fields for the node to configure, click on the "Run" button to view the result of the nodes
Join
Another aspect of the transformation of your data is the joining of data sets from different data sources and databases. A “Join” is a data operation in which two or more tables or datasets are merged into one based on the presence of matching values in one or more key columns that you specify. These shared columns are called the join keys of the two sets of rows that you are attempting to join.
The “Join” is part of the column operators under our data platform. To Join datasets, click on the “Column operators”, which shows you the drop-down feature options, and click and drag the “Join” to the project workflow.
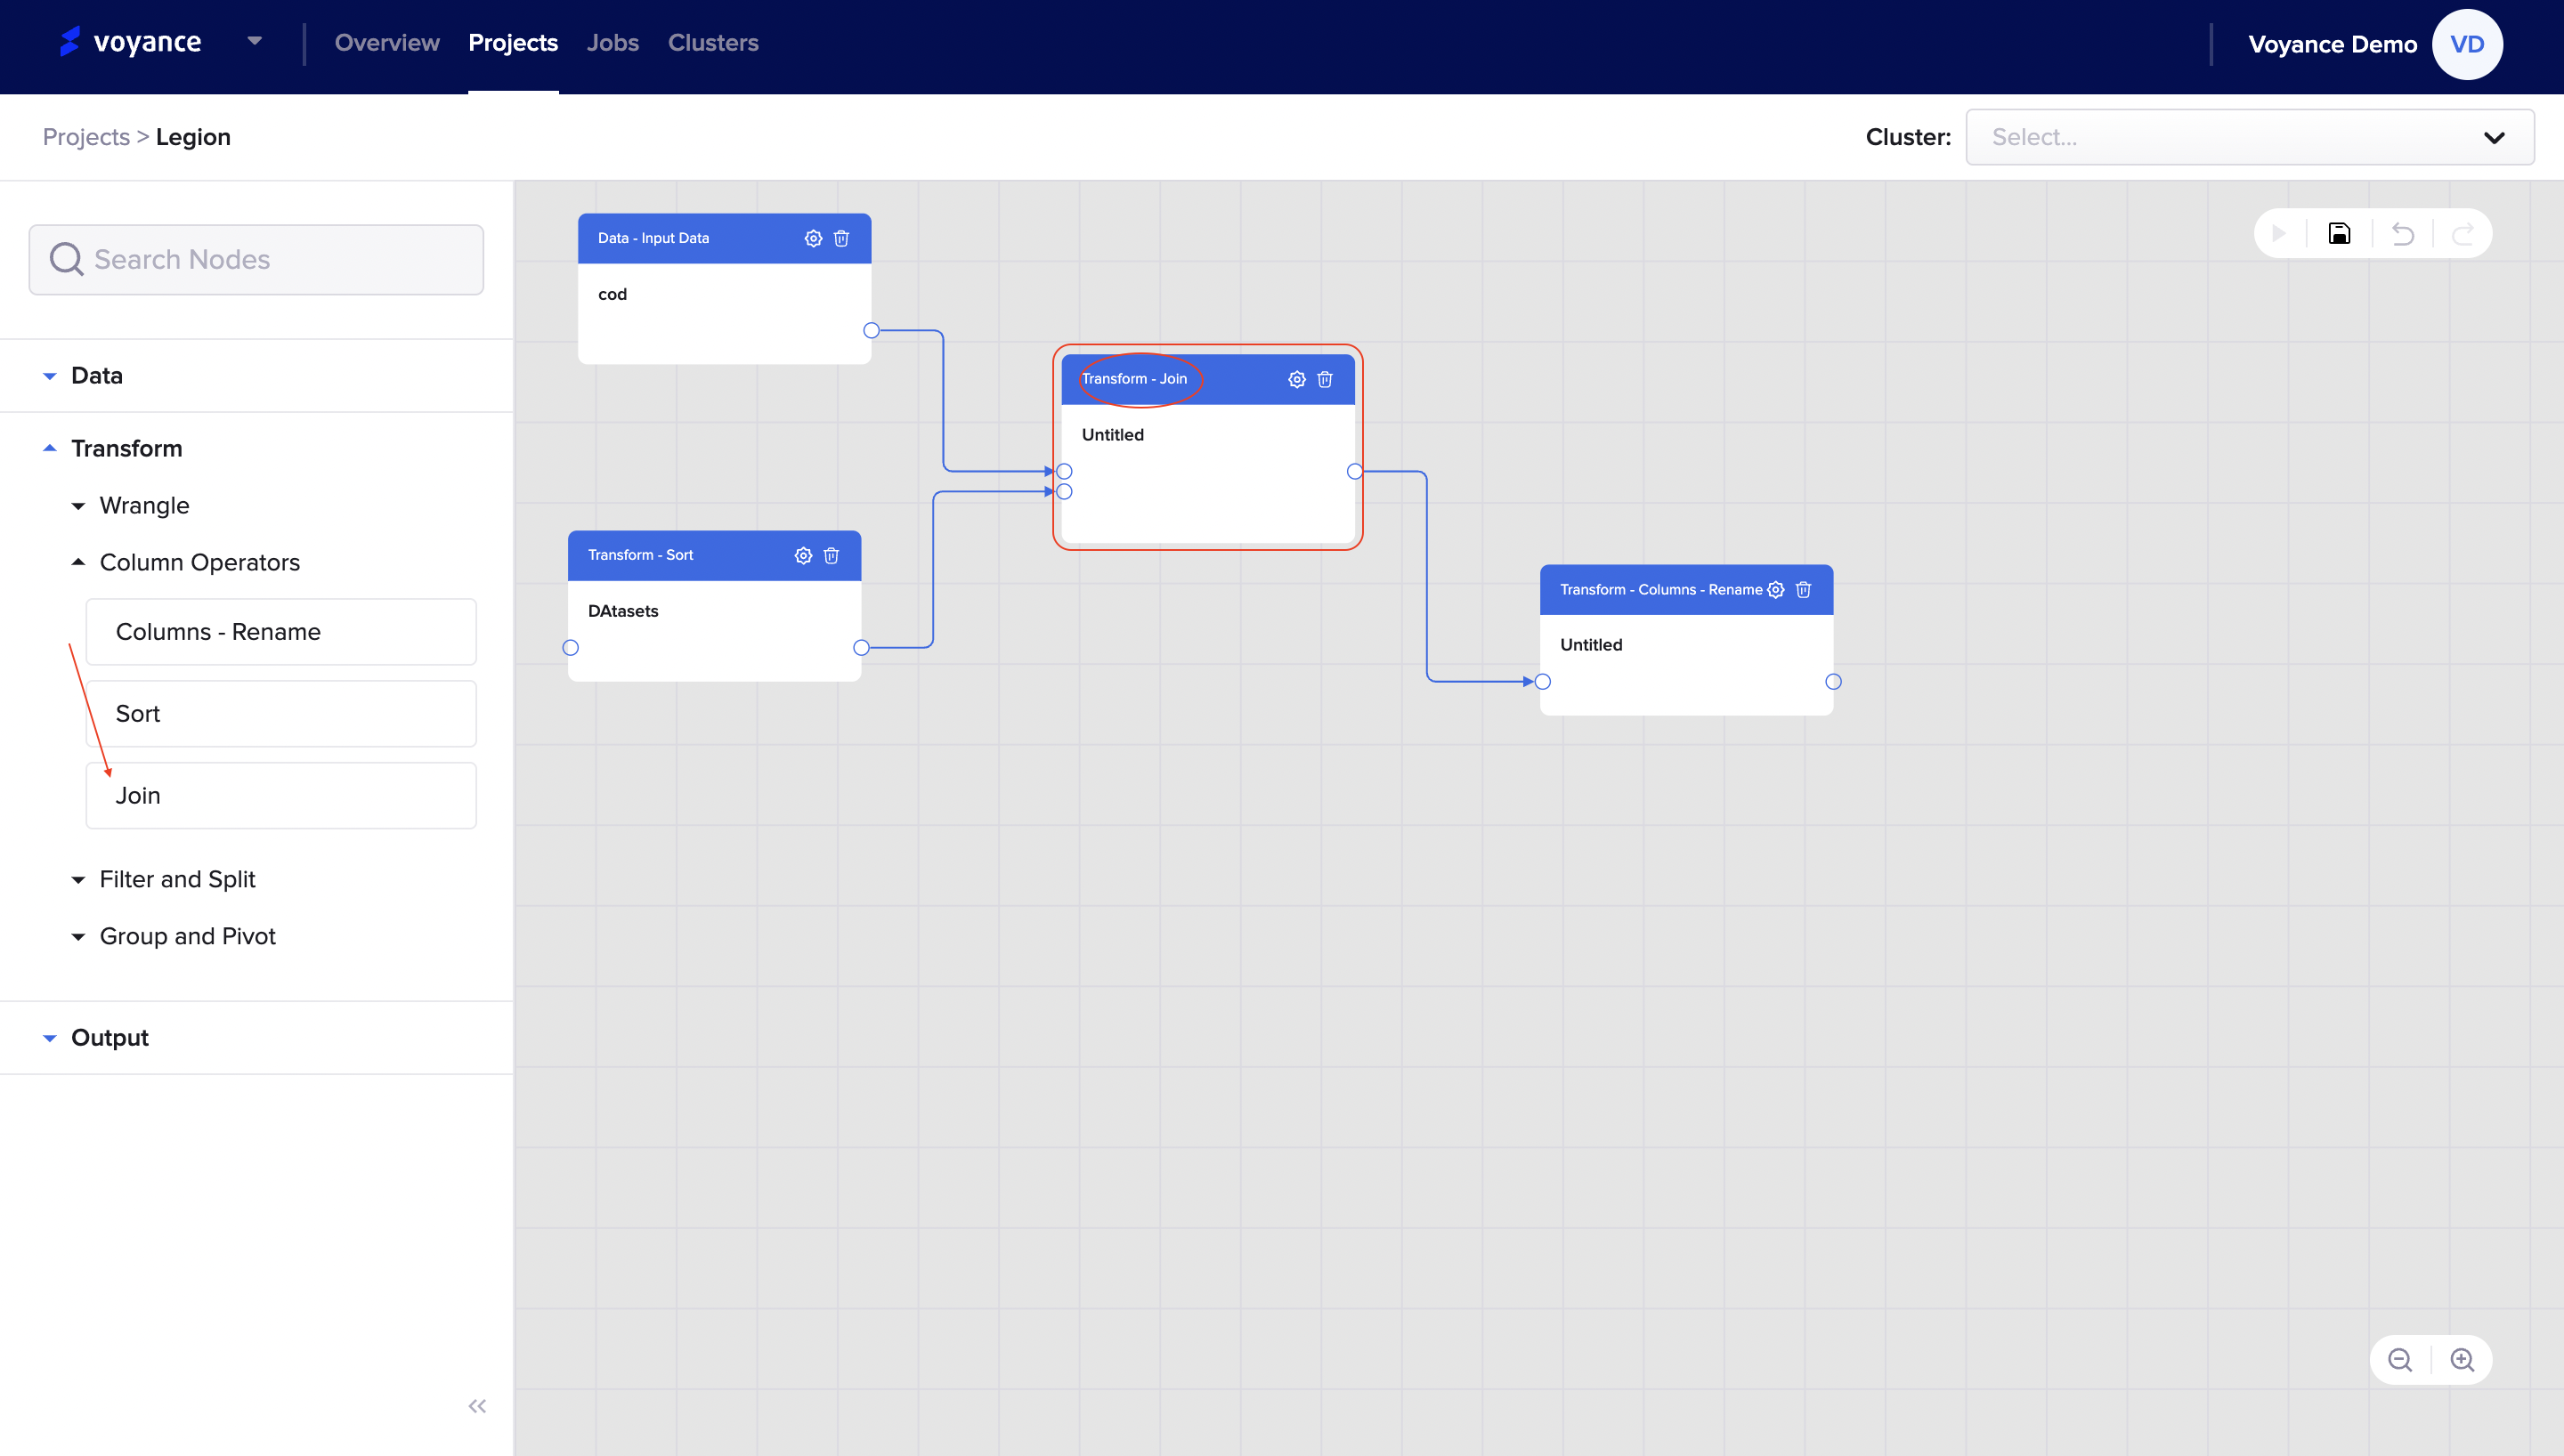
Column-Join Editor
when you want to edit the "Join" dialog box, click on the “Settings icon” at the top-right of the Join dialog box on the project workflow,
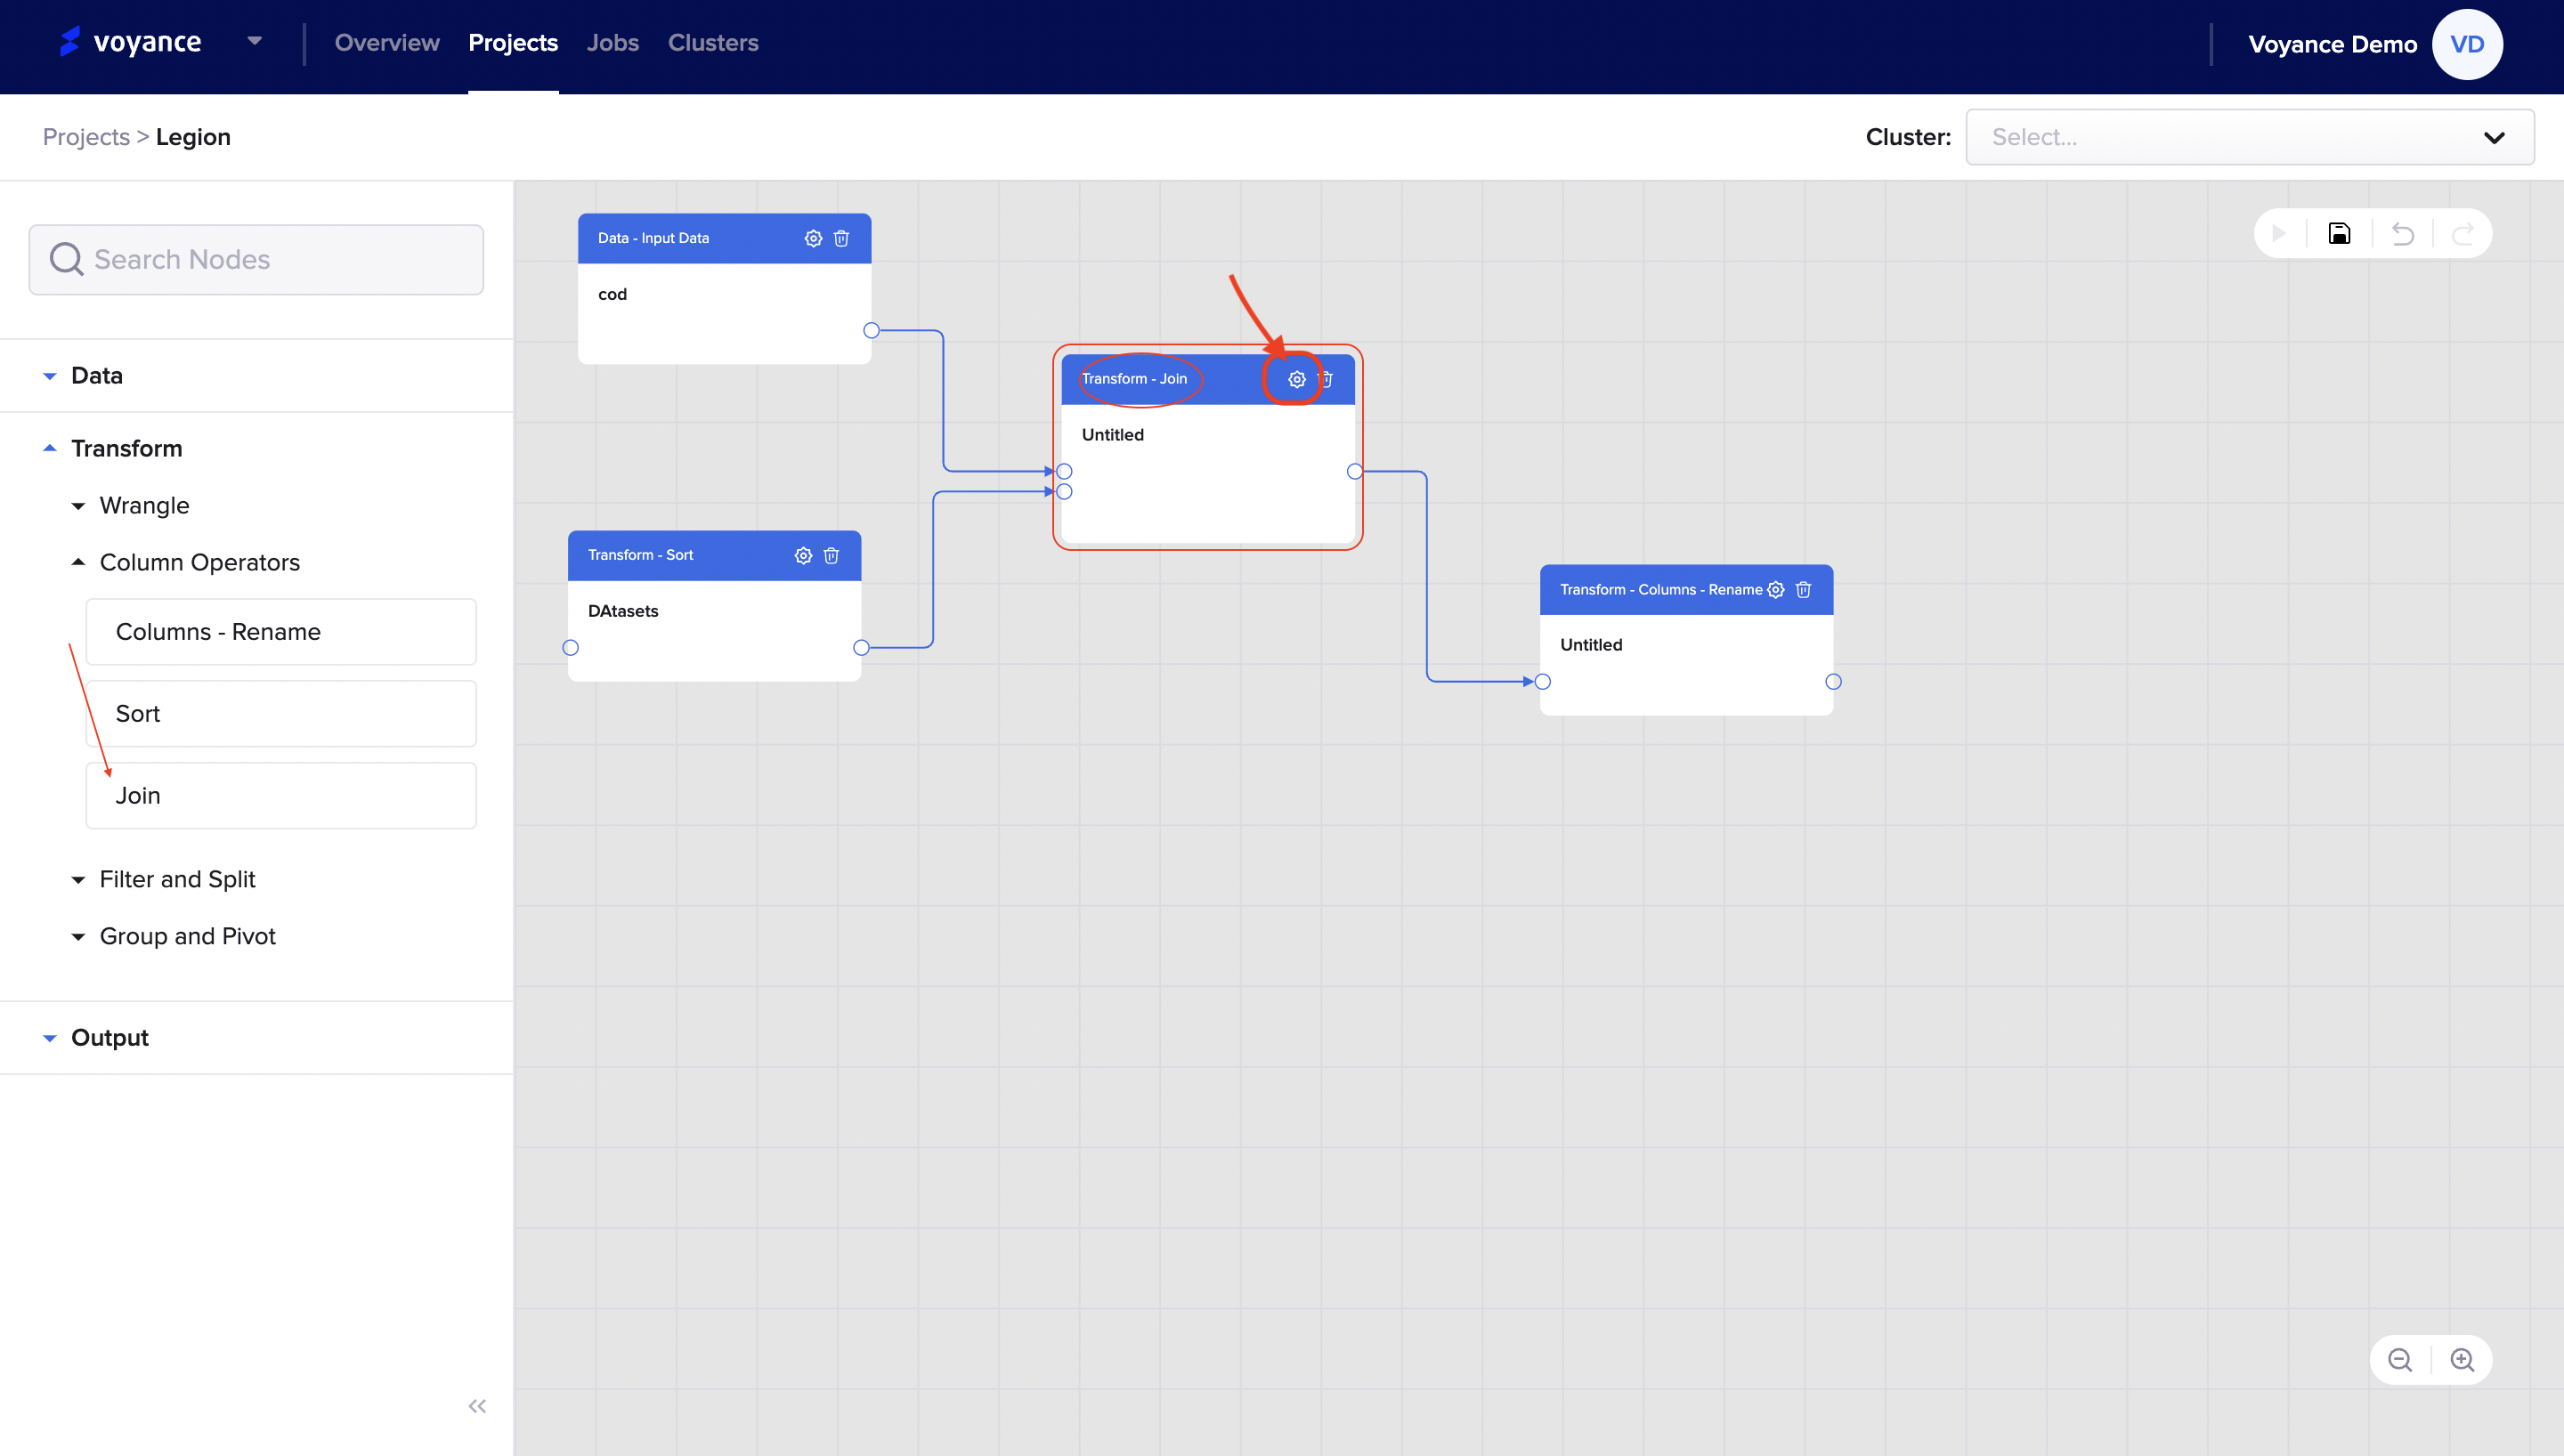
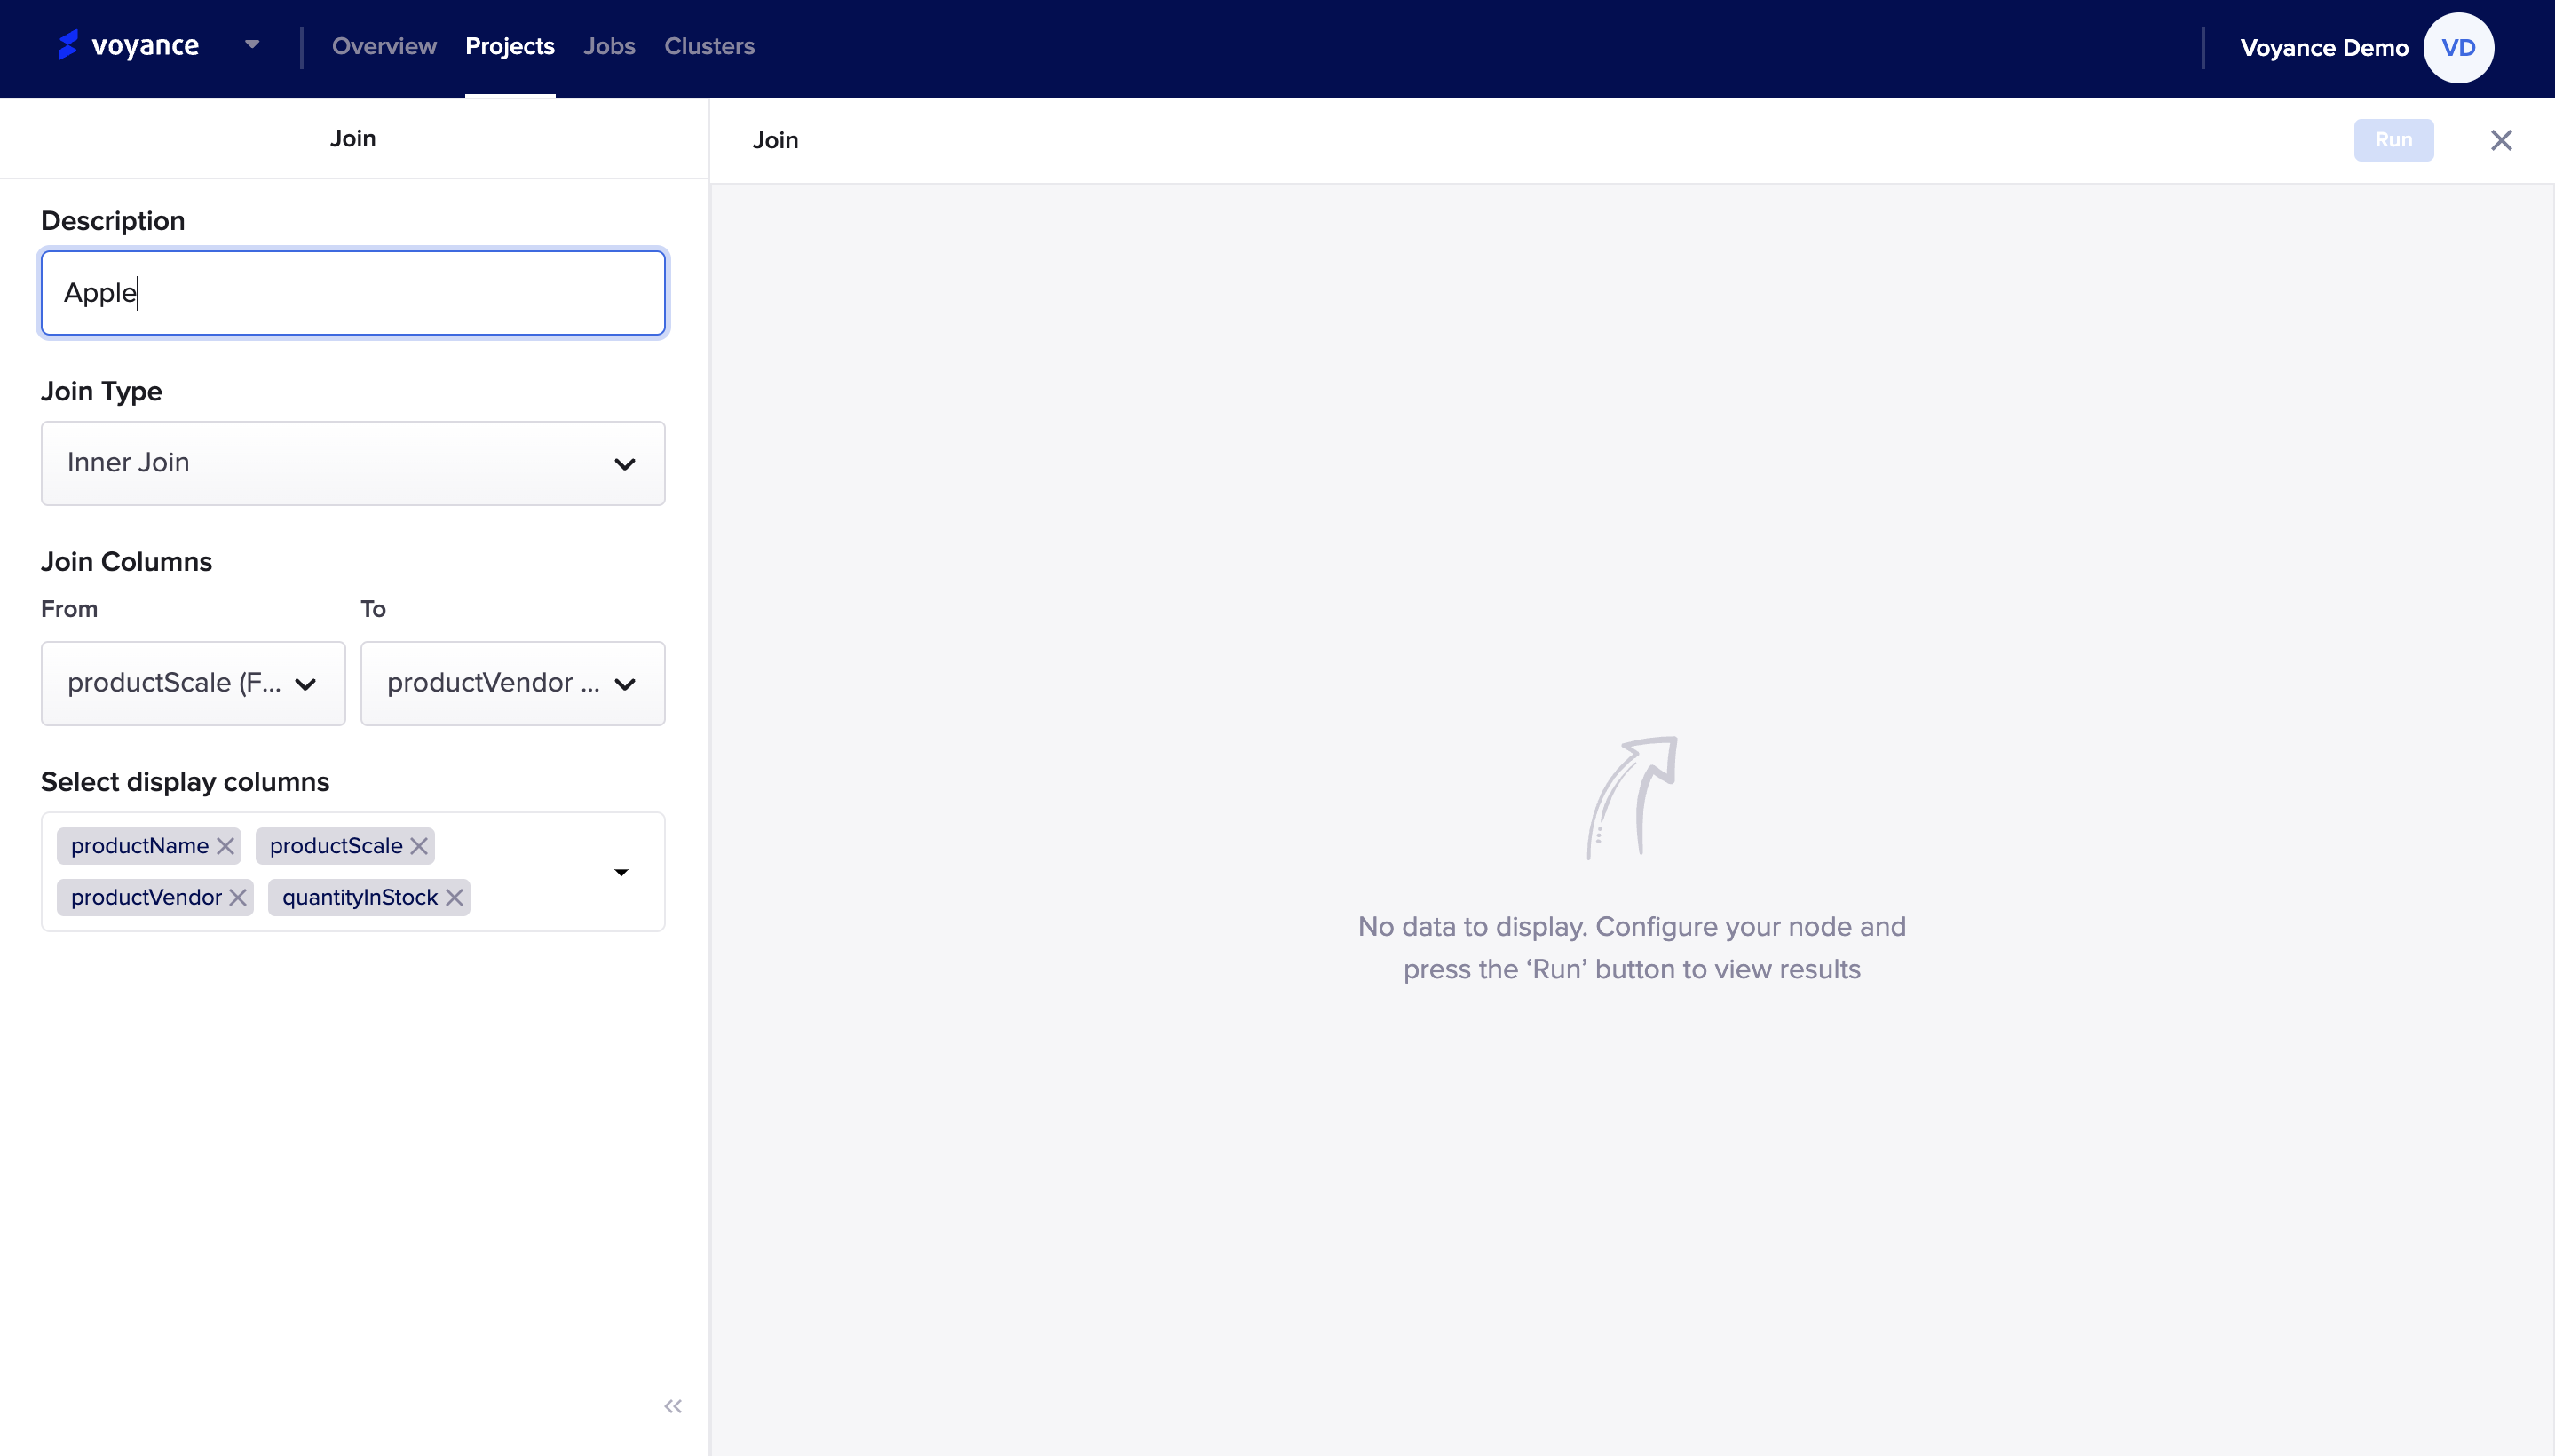
You will be redirected to the join dashboard where you can join several data together. There are some parameters which are very important to administer the Join feature tools which include:
Description: it is by giving a name to the join operations or showing a statement that describes the join dialog box. It is not necessary to give a name. Once the description has been given to the Join, It will show on the Join dialog box in the project workflow.
Join Type:This is the several types of joining that you can use to add your data together. with our data platform, we have several join types you can select from to perform your data transformation, we have the "Left Join, "Inner Join", "Right Join", "Full Join". which will enable you to join table from different angles of your data.
Join Column: This is to join data from one point to another point. Click on the drop-down (s) to select what column you want to select from and select the column you want to join together.
Select display column: when you want to select display, click on the drop-down and click on the checkbox(es) to select a column. You have the option to select more than one columns.
Run program
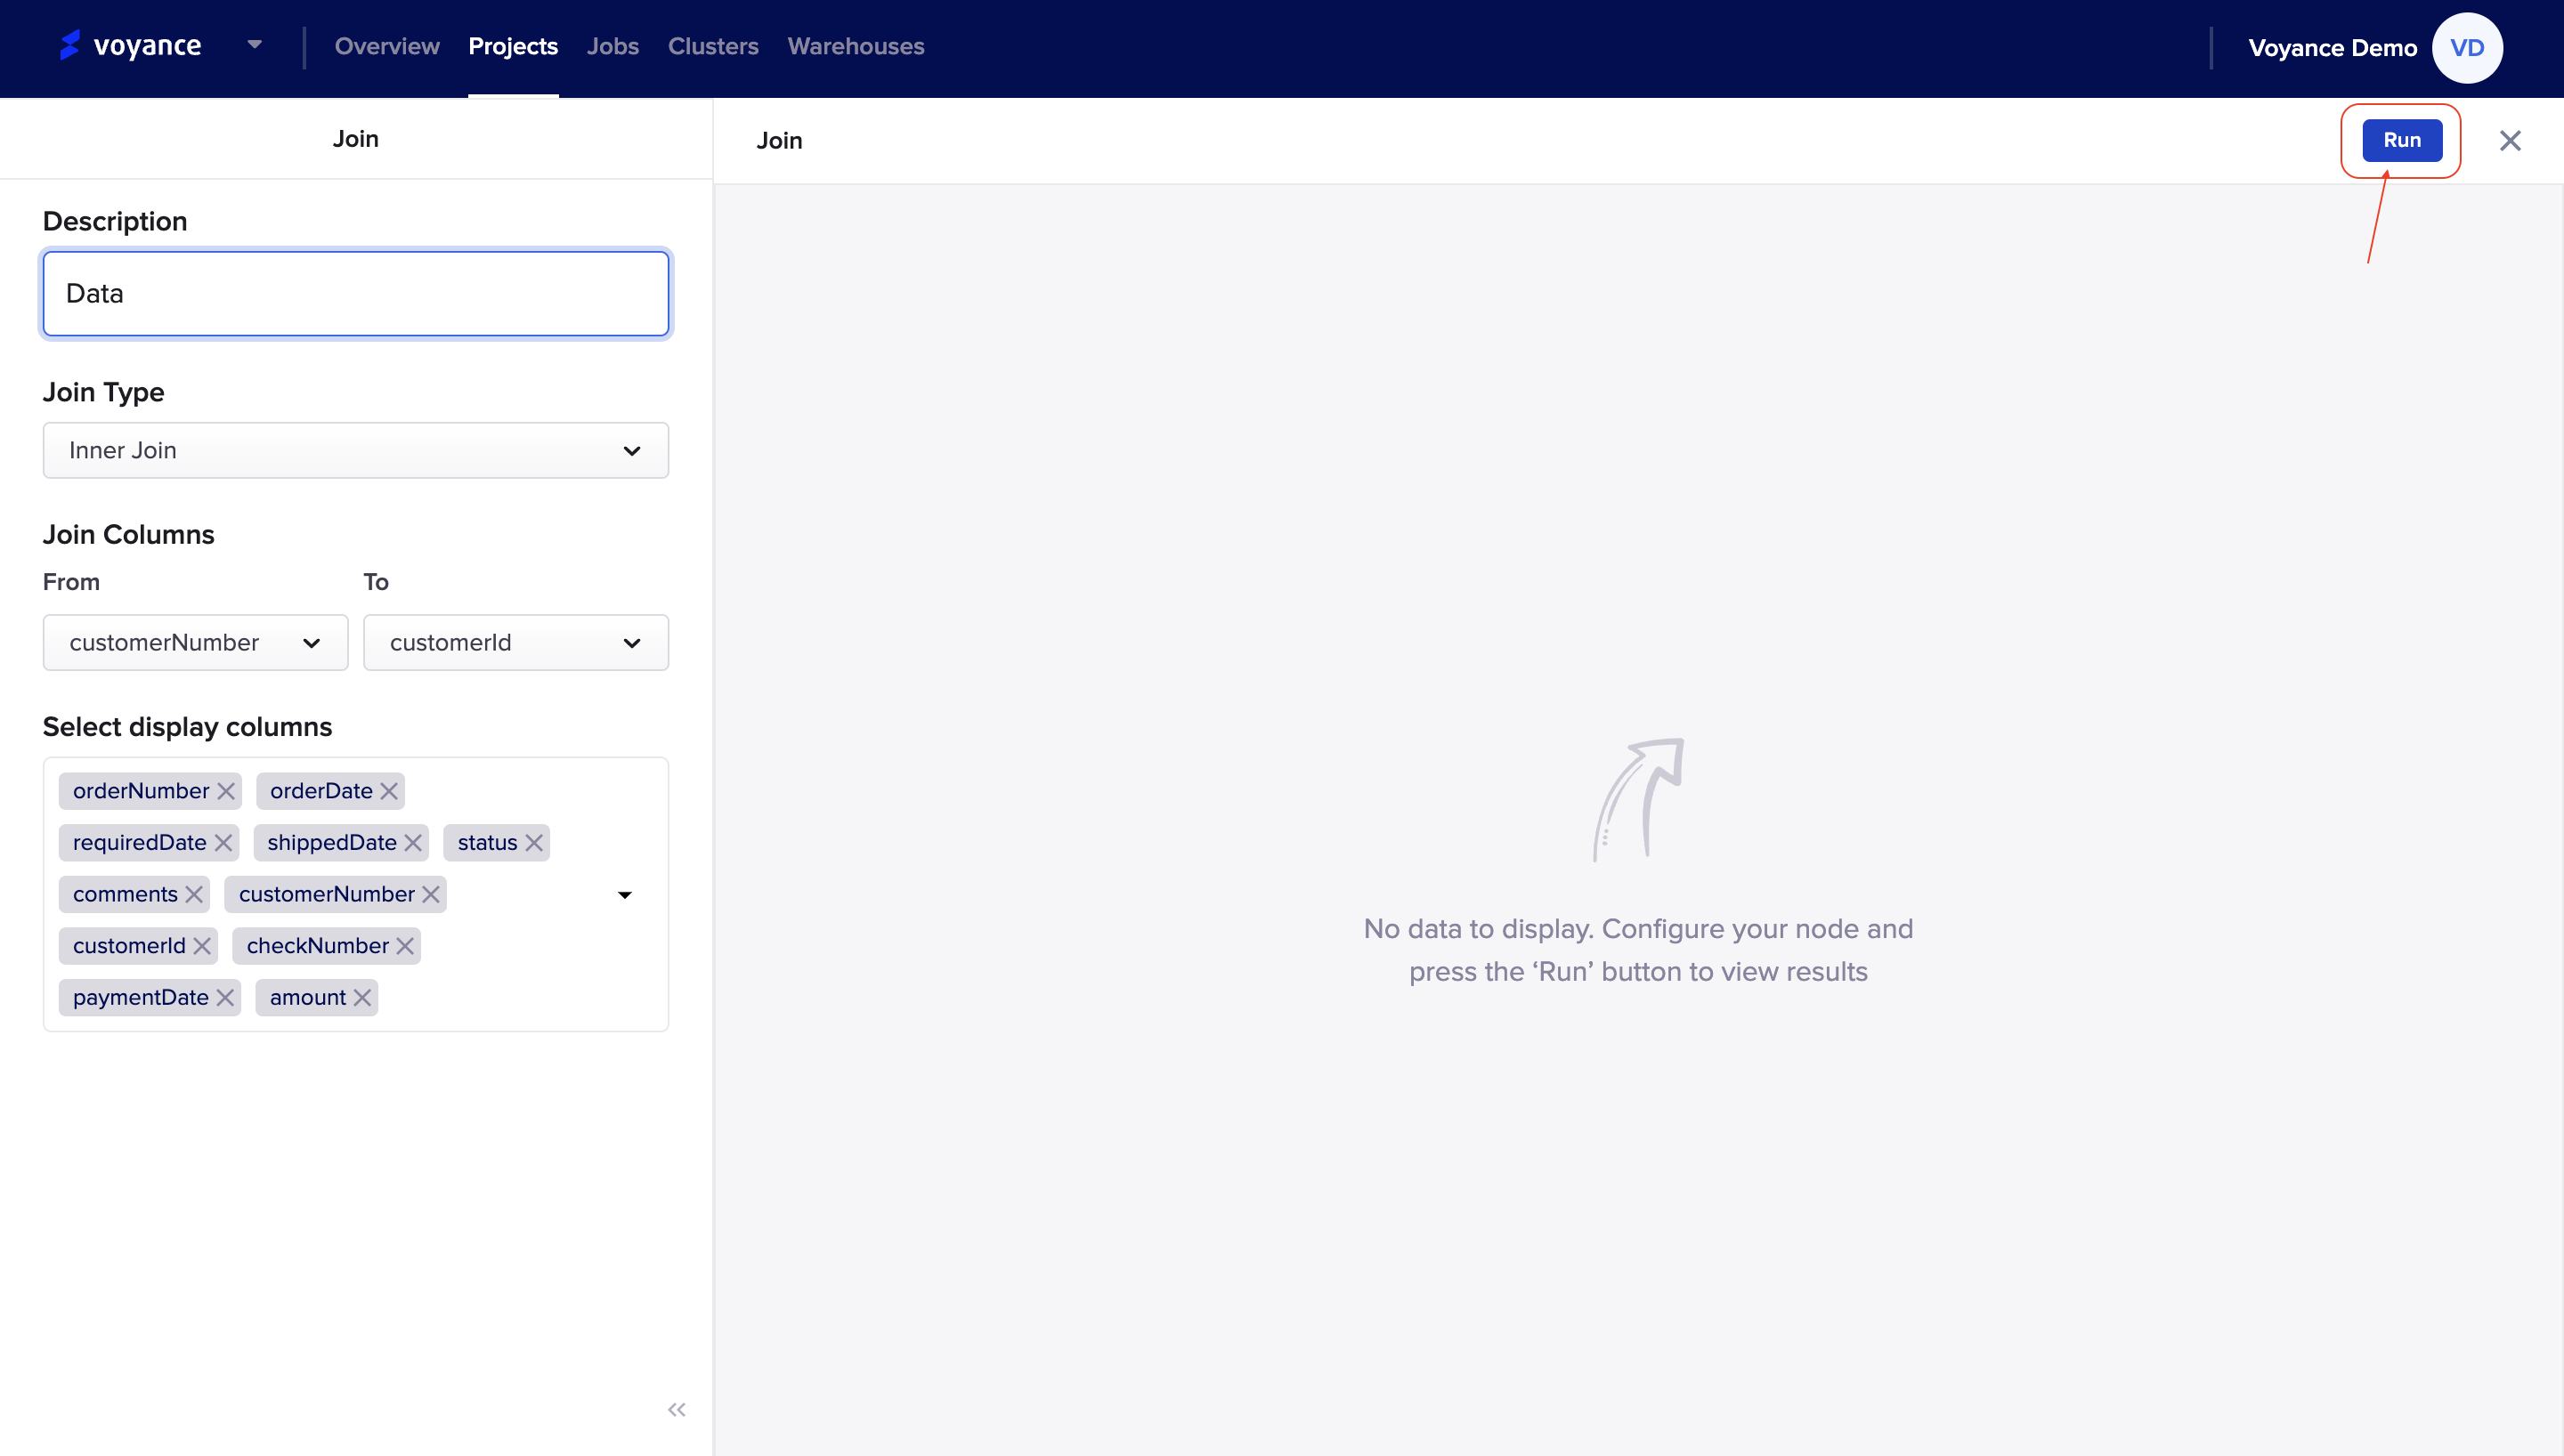
Once you have added the necessary fields for the node to configure, click on the "Run" button to analyze and view the result of the data nodes.
SQL Editor
The SQL Editor is one of the transformation capabilities under the column operators. An SQL Editor is a transformation process that enables you to perform and execute all kinds of SQL queries. To select the SQL editor, click on the "Transform > column operators under the column operators, click and drag SQL Editor to the workflow. it displays a dialog box on the workflow where you can be able to edit and perform SQL queries on your data.
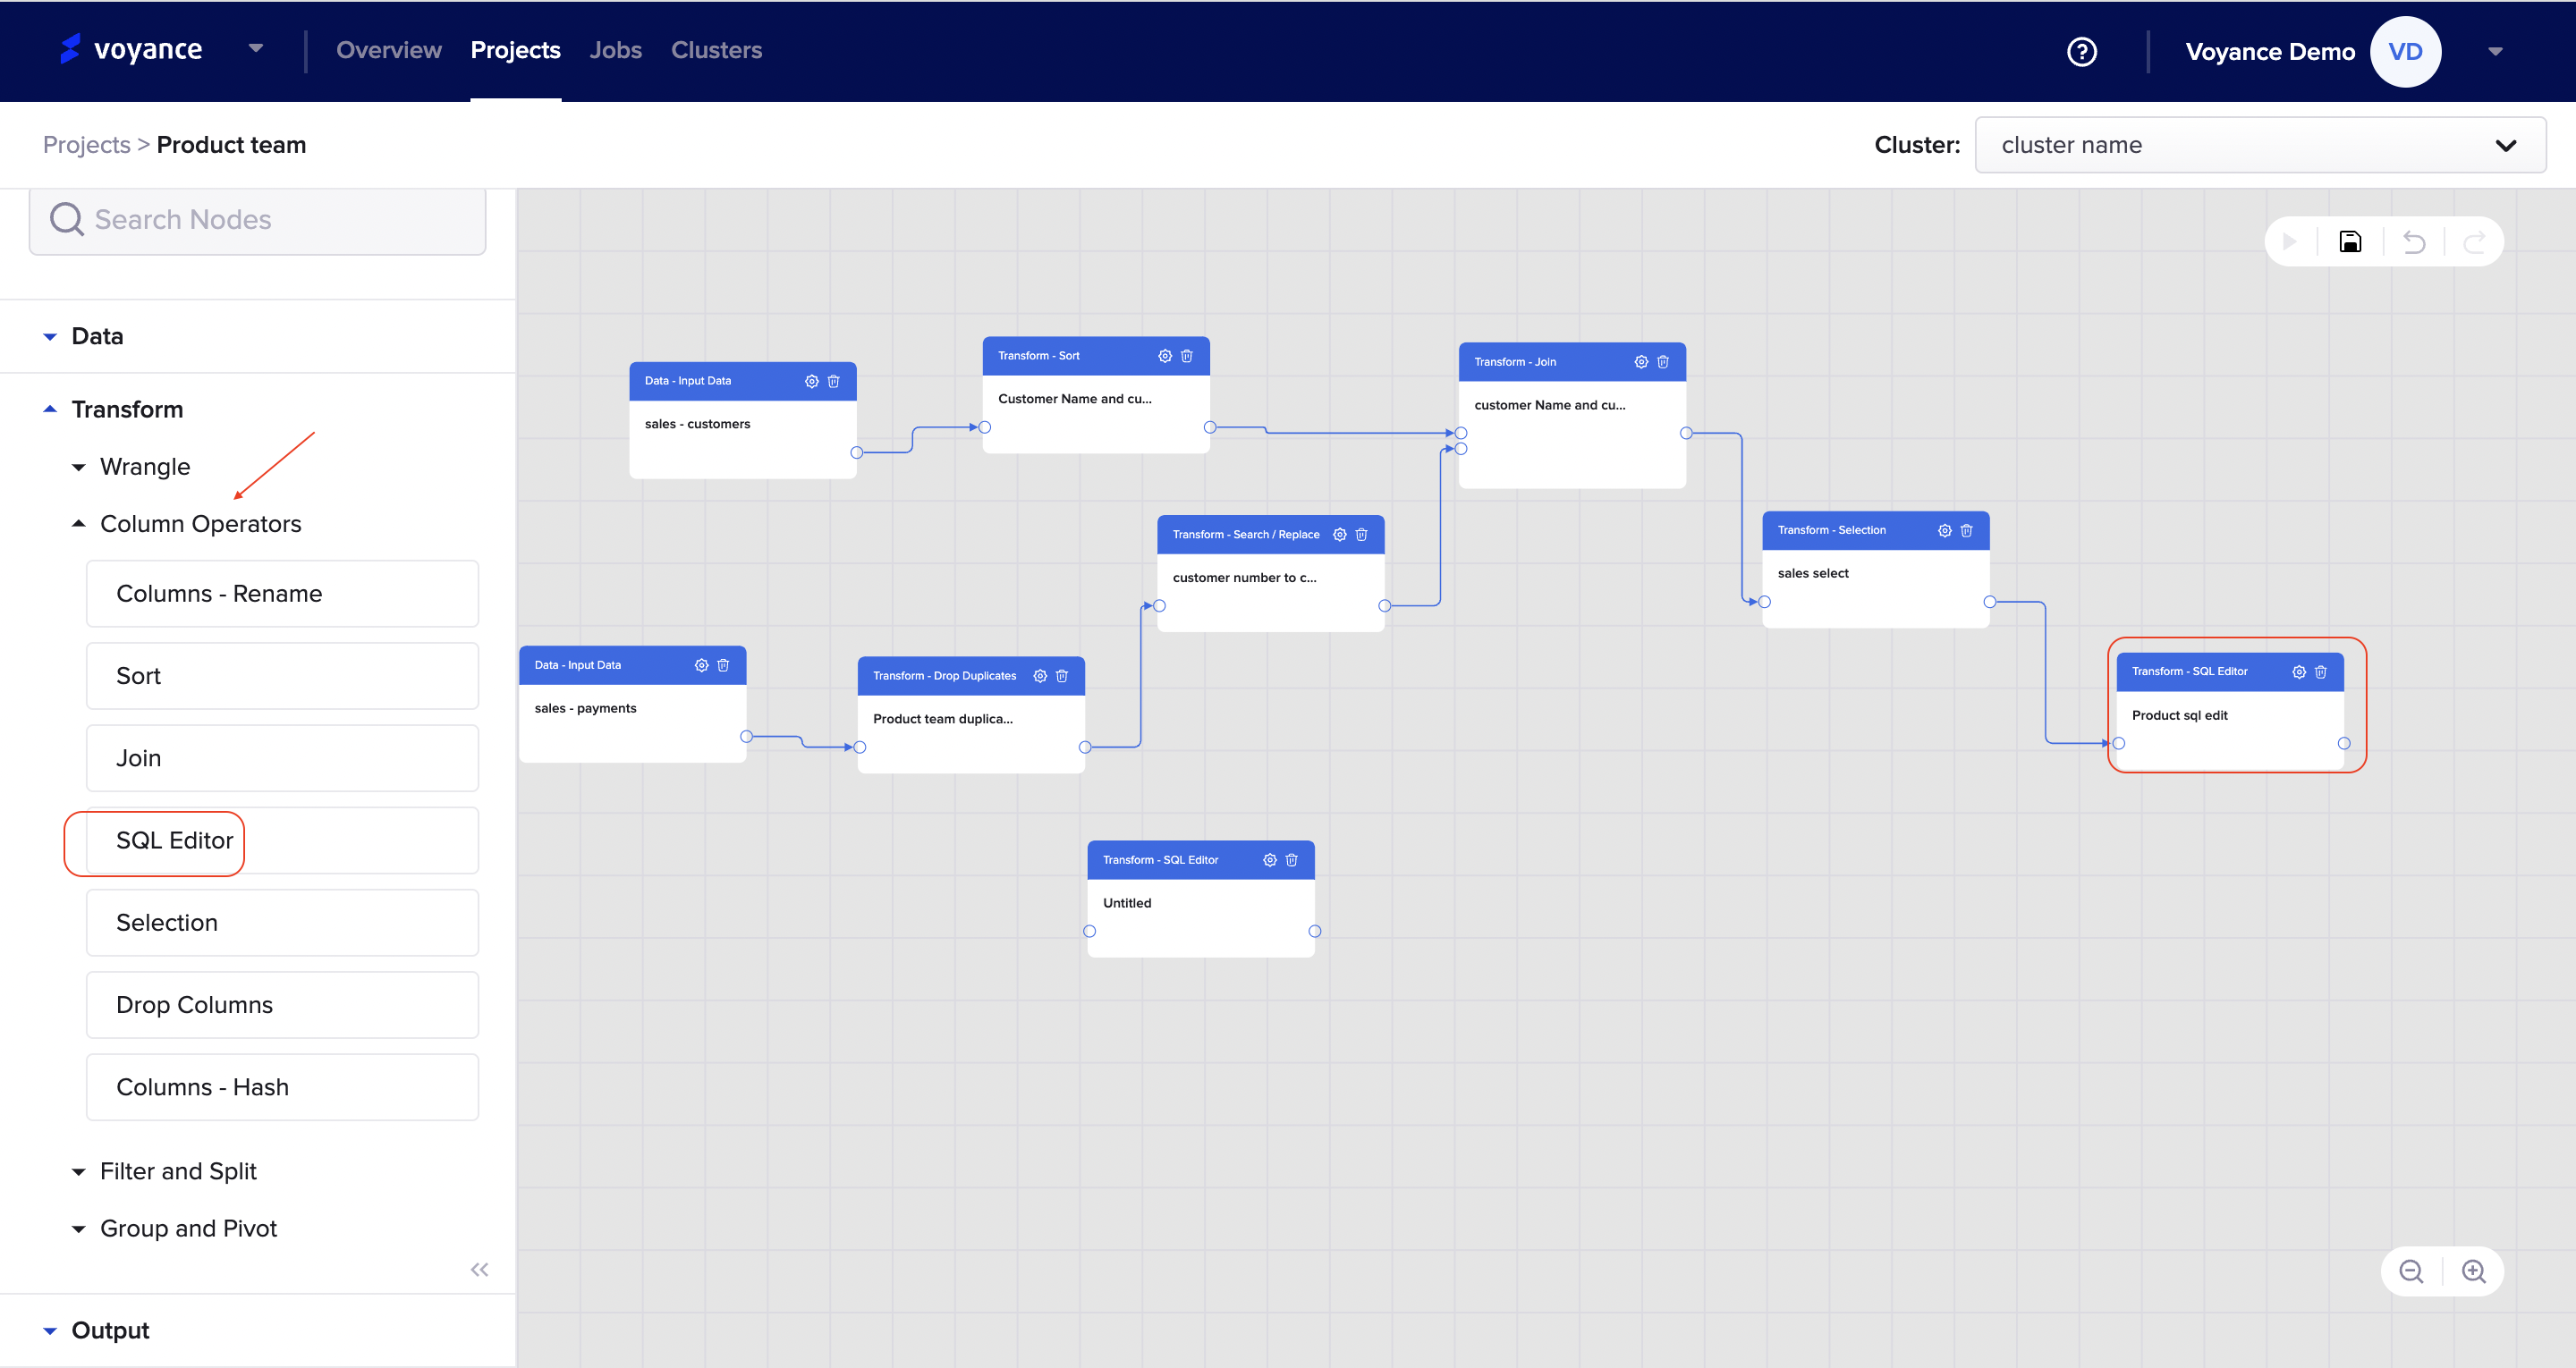
Edit SQL Editor
To edit an SQL Editor from the workflow, click on the "setting icon at the top right of the dialog box under the SQL editor
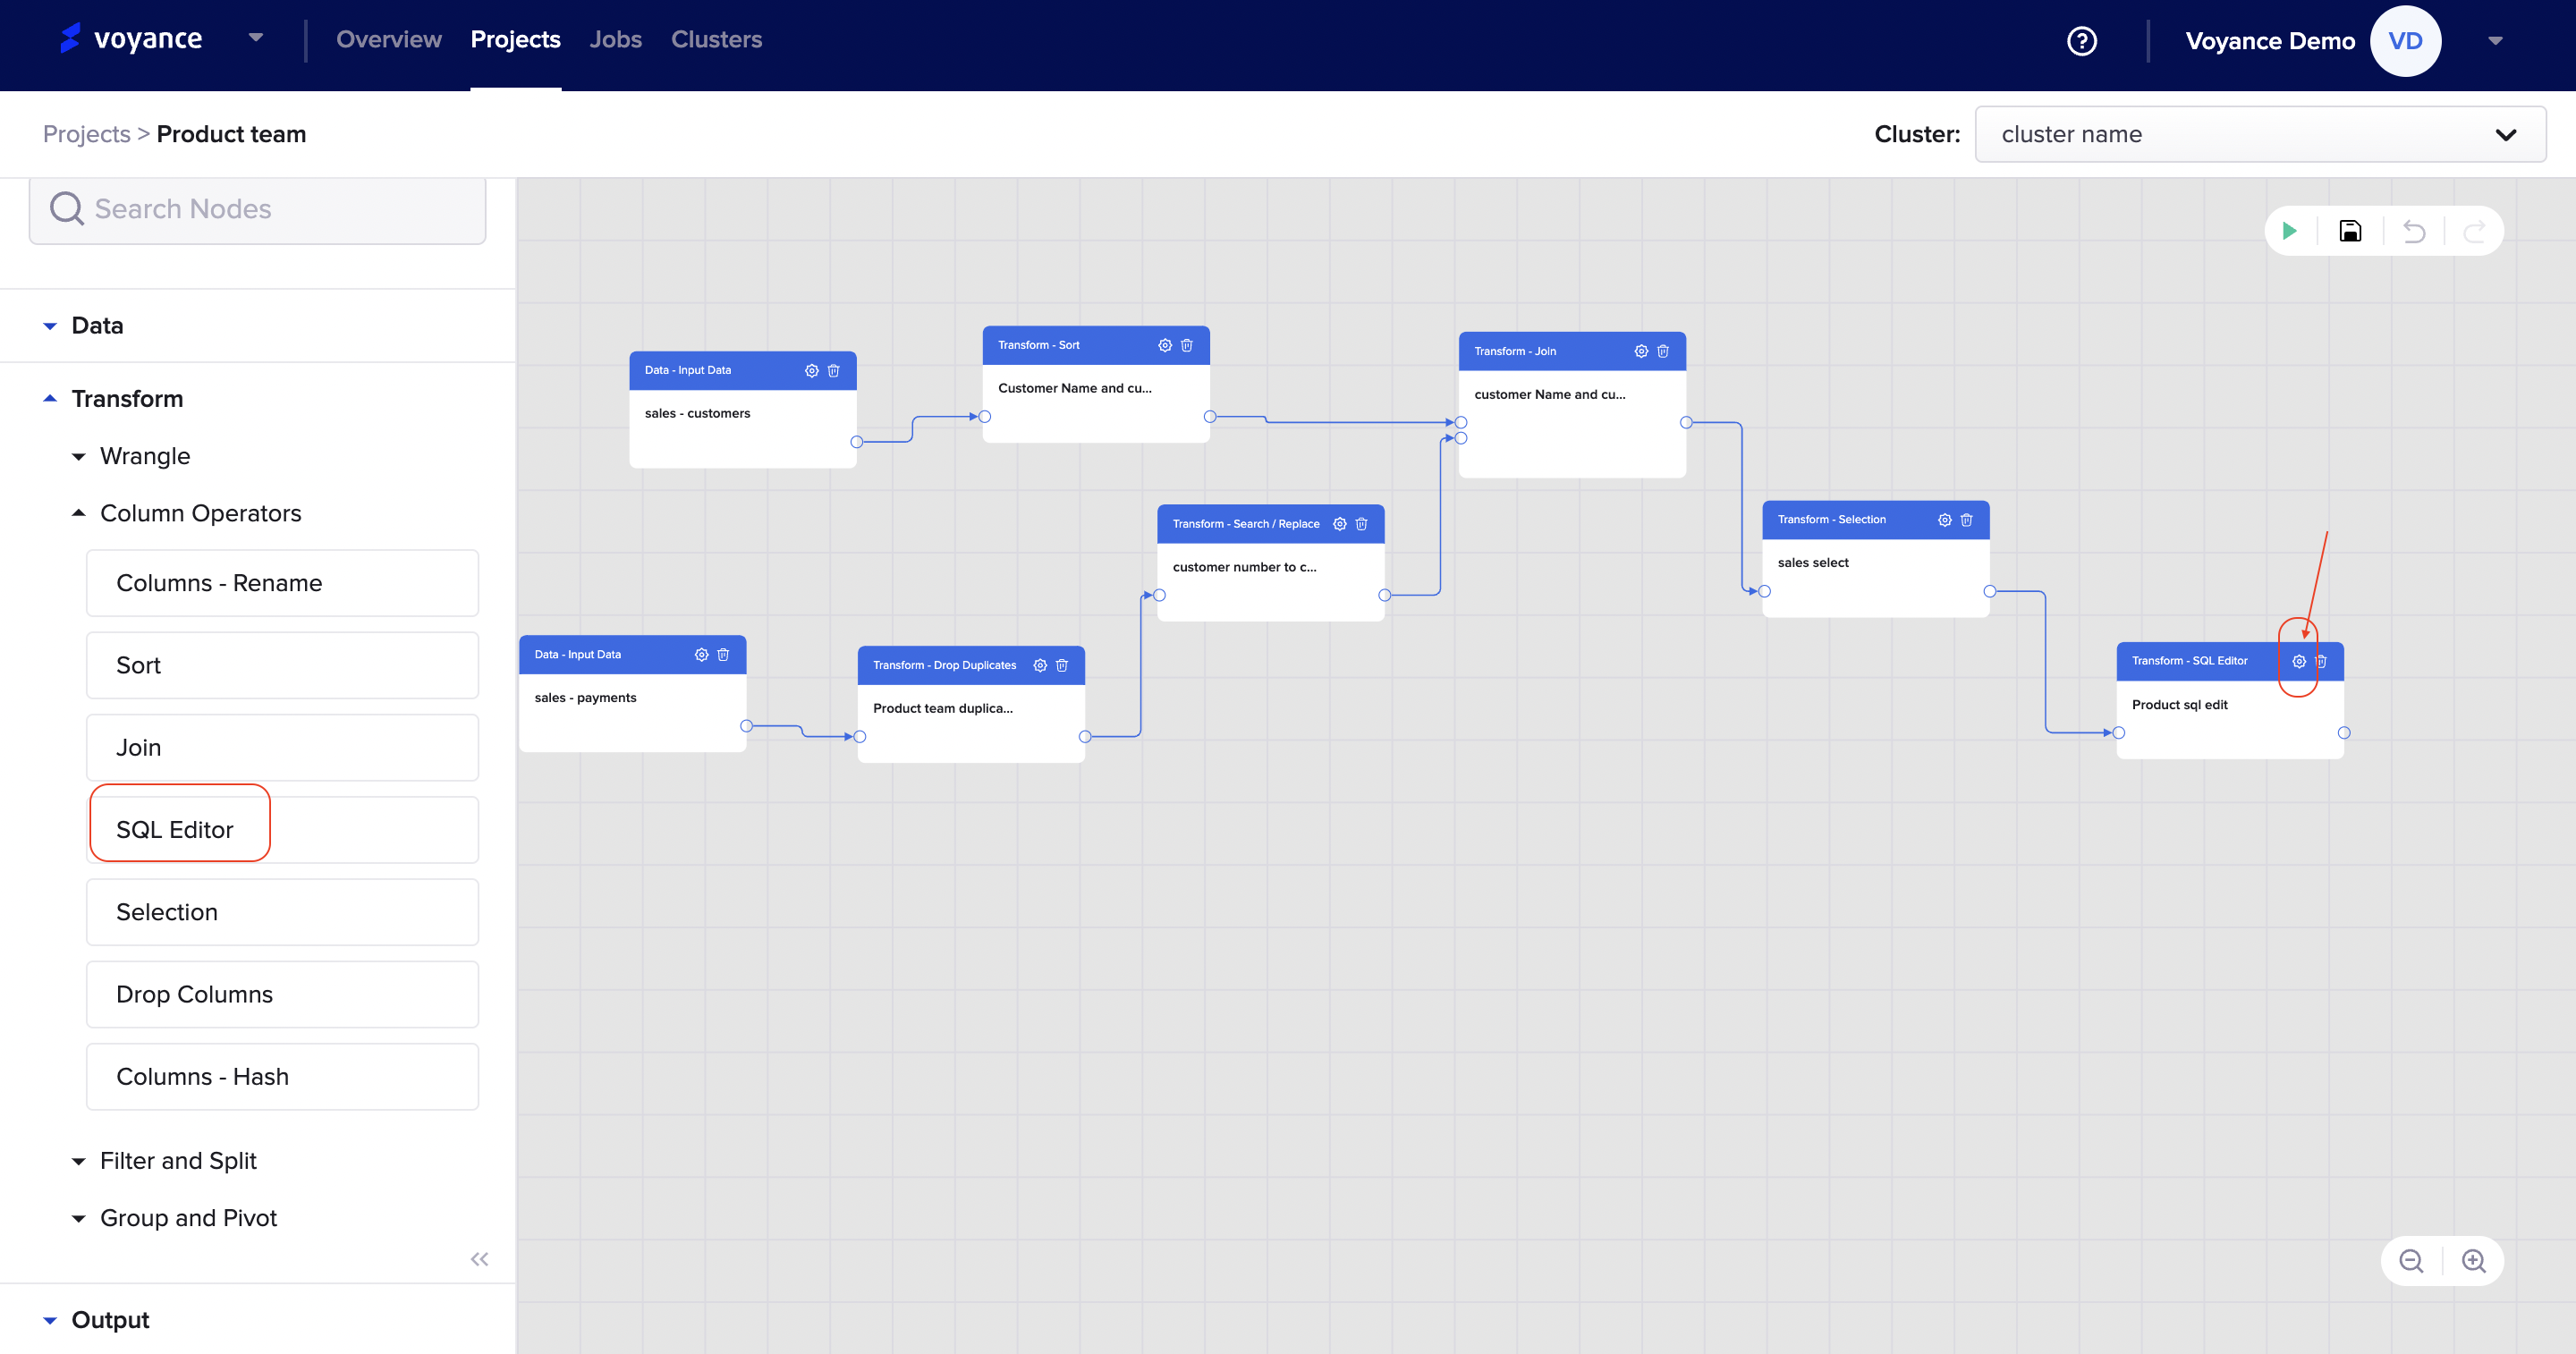
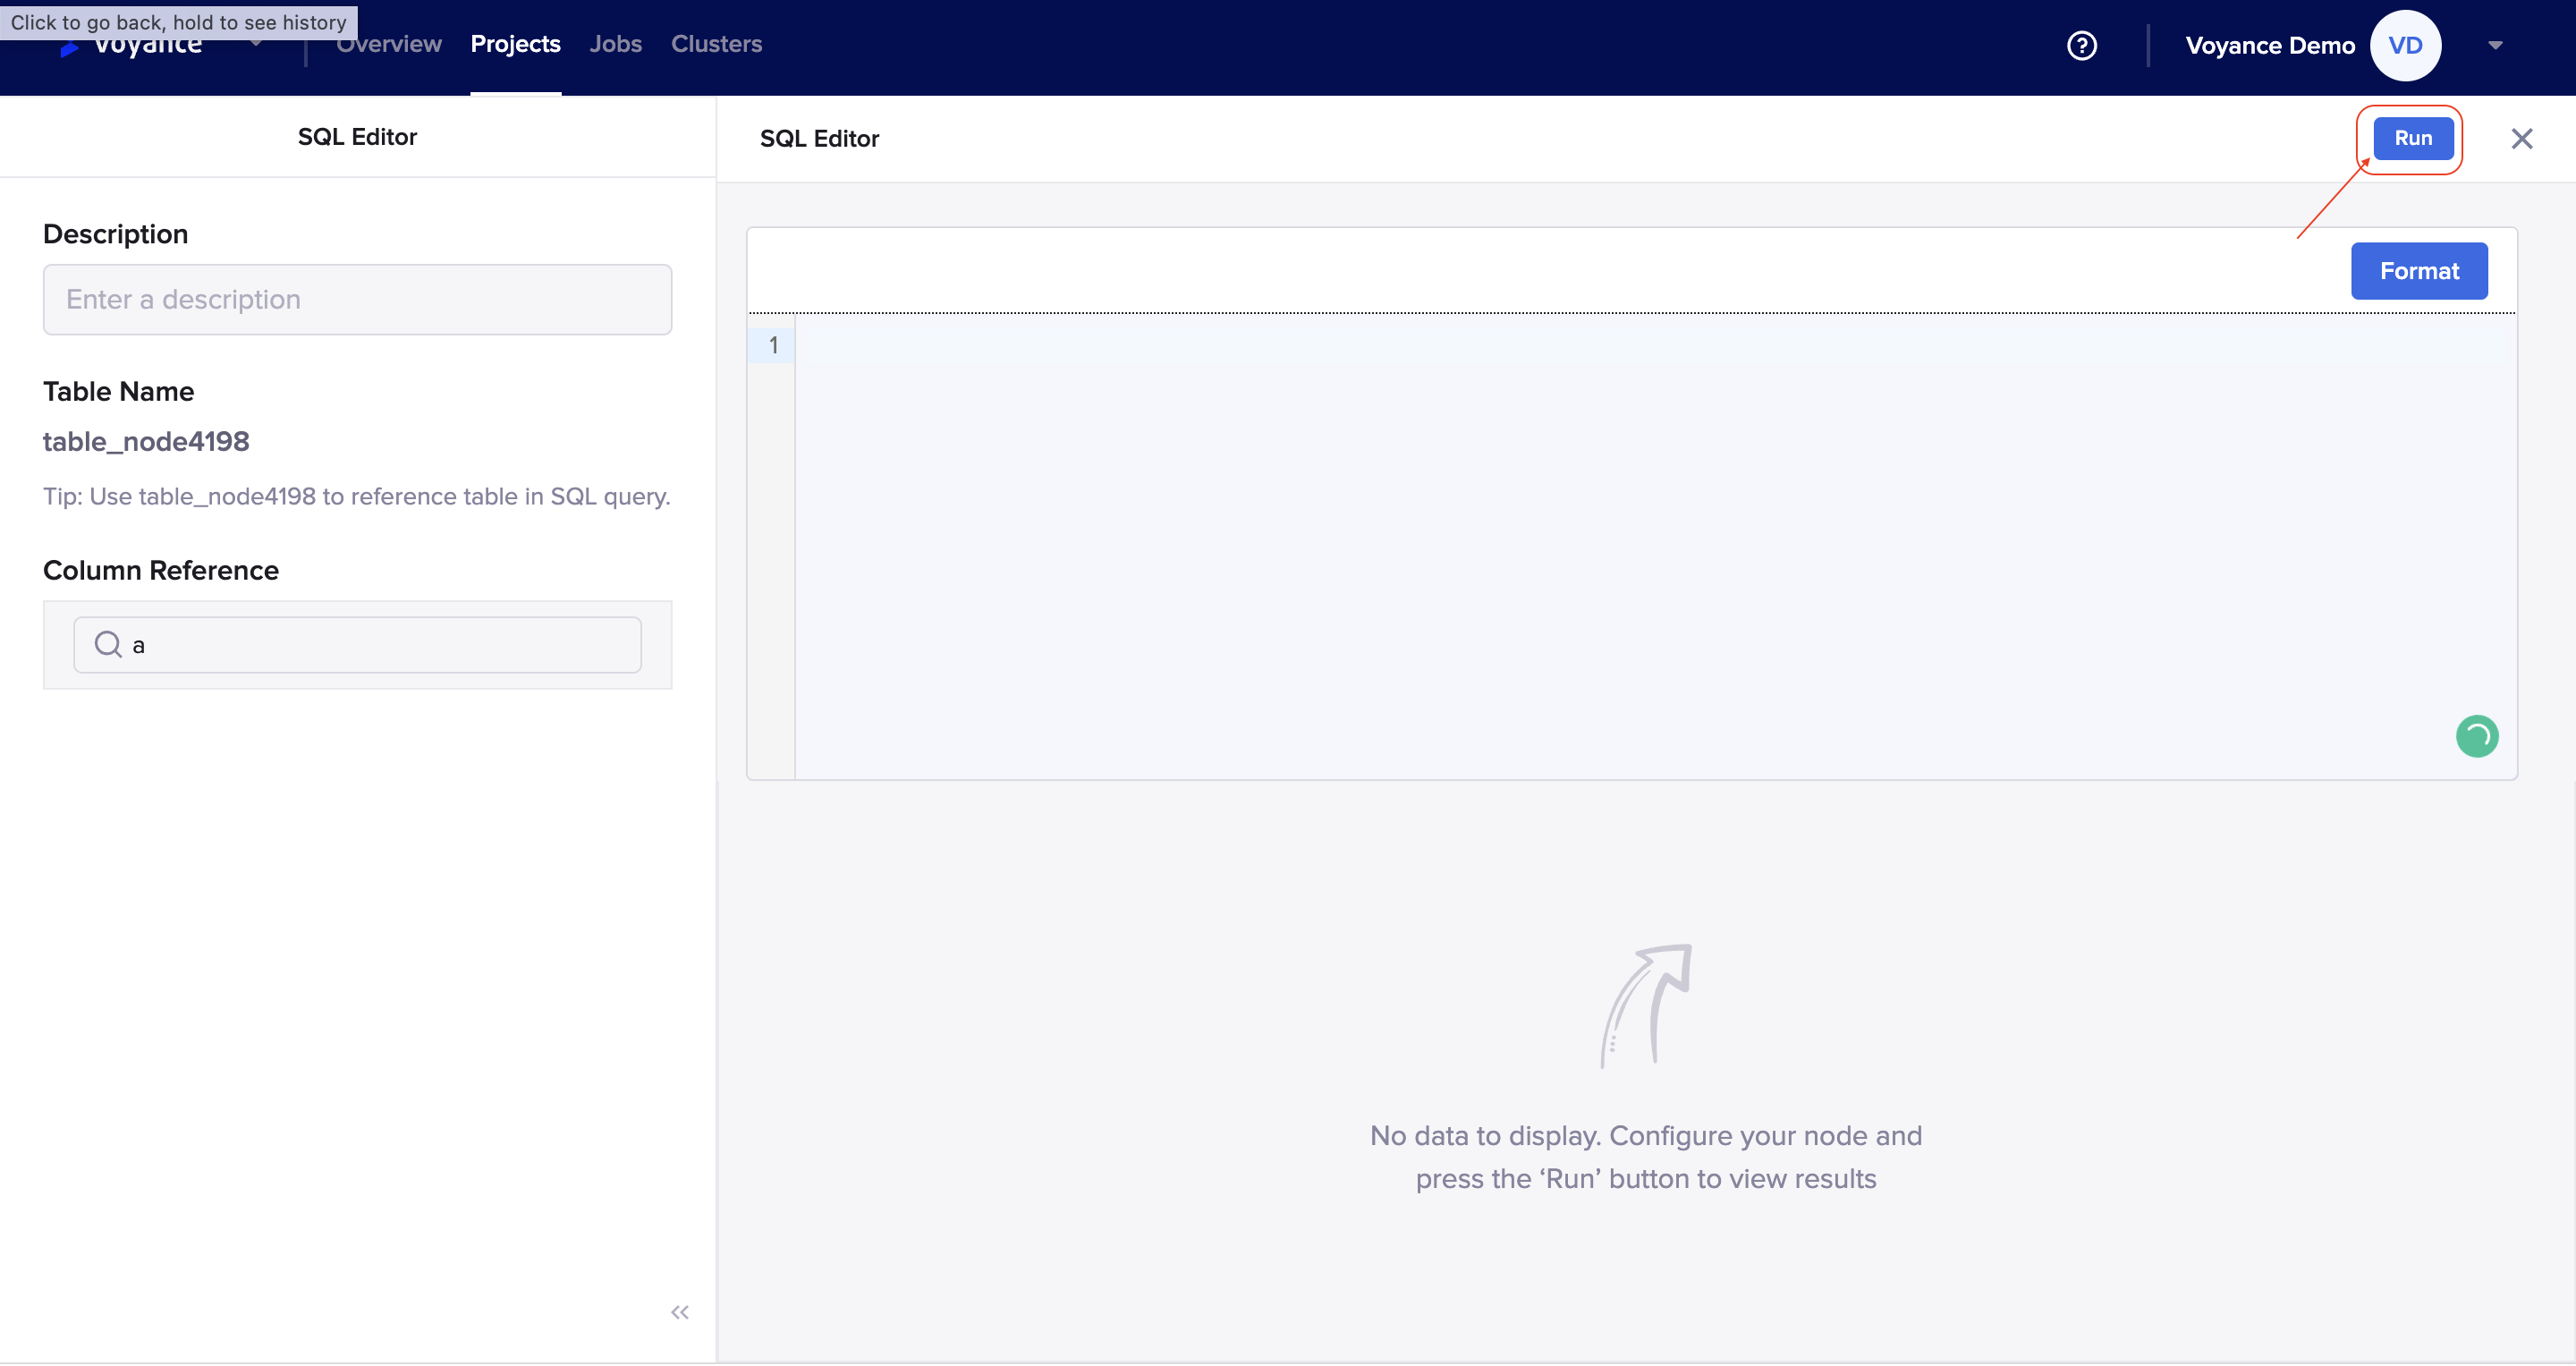
you will be redirected to the SQL editor dashboard where you can perform, analyze, and format SQL queries on your data. fill in the parameters on the dashboard to be able to perform your transformation:
Description: Give a title or description to the SQL process you want to perform which is displayed on dialog box
Column reference: Give a column reference which is qualified by a table and schema name. you fill in the
Run Program
To preview your data, click on *Run at the top right of the dashboard to be able to analyze and view the result of the transformation. To cancel the run process, click on the (X) to cancel the process.
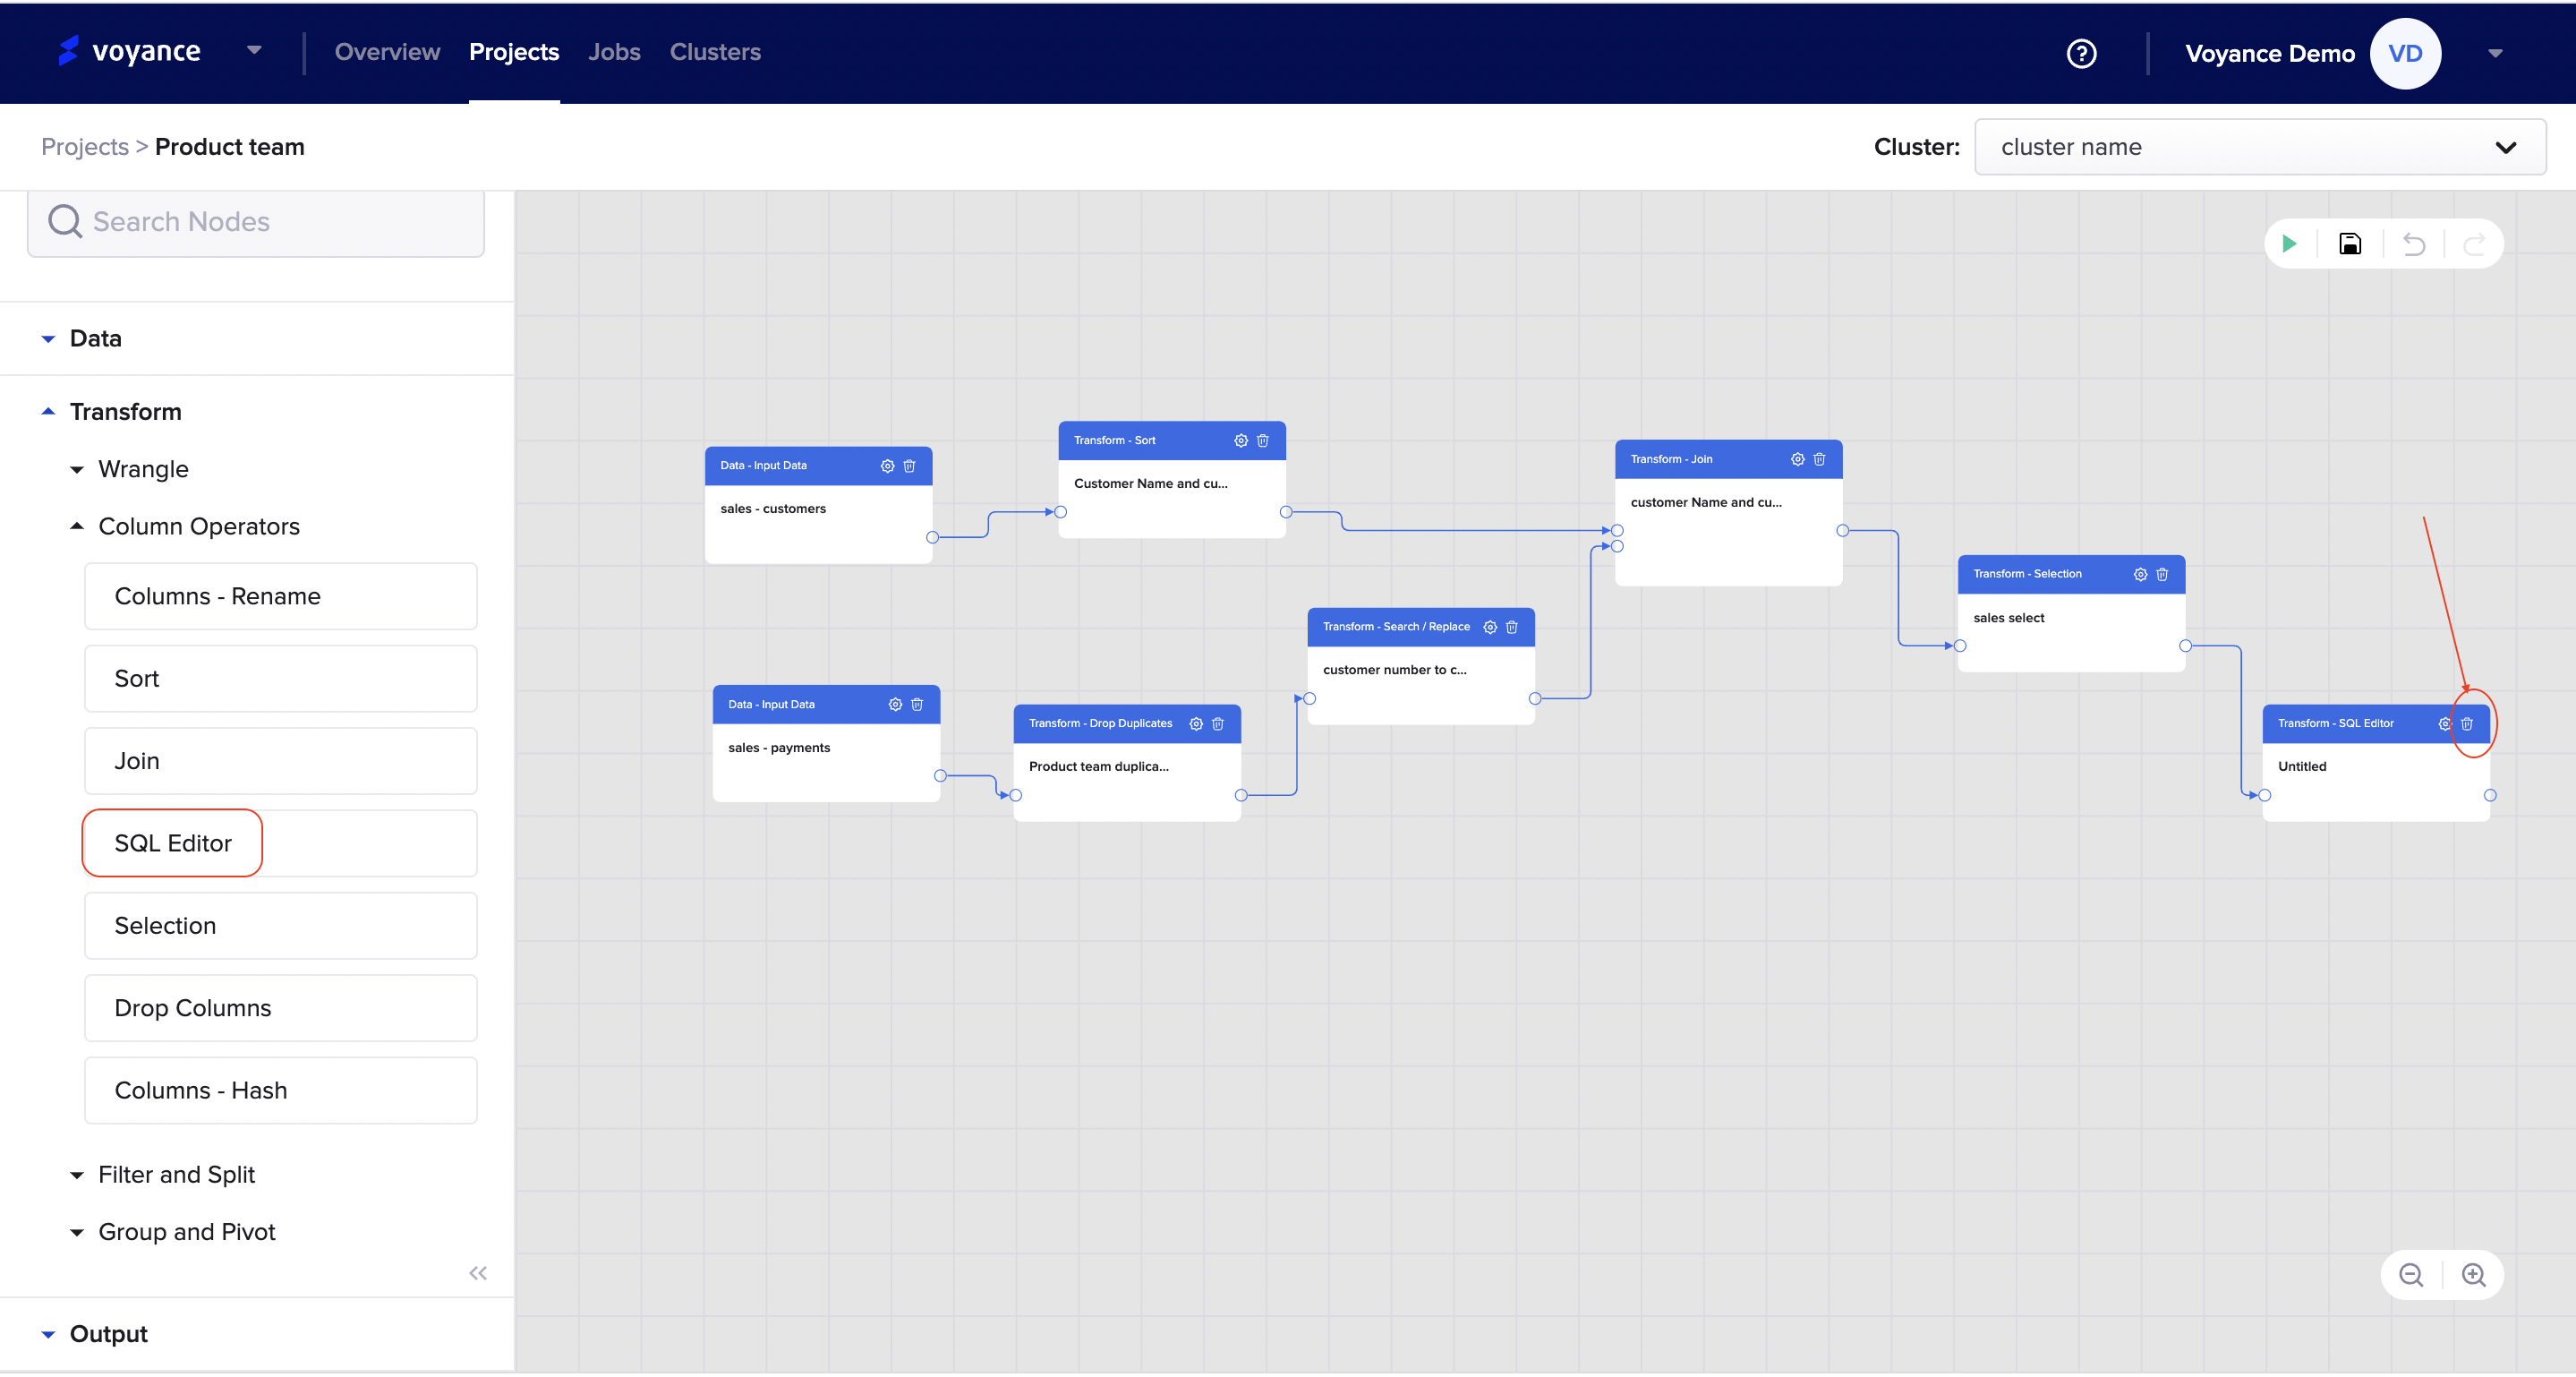
Delete SQL Editor Transform
To delete the SQL transform, click on the *Delete icon at the top-right of the dialog box.
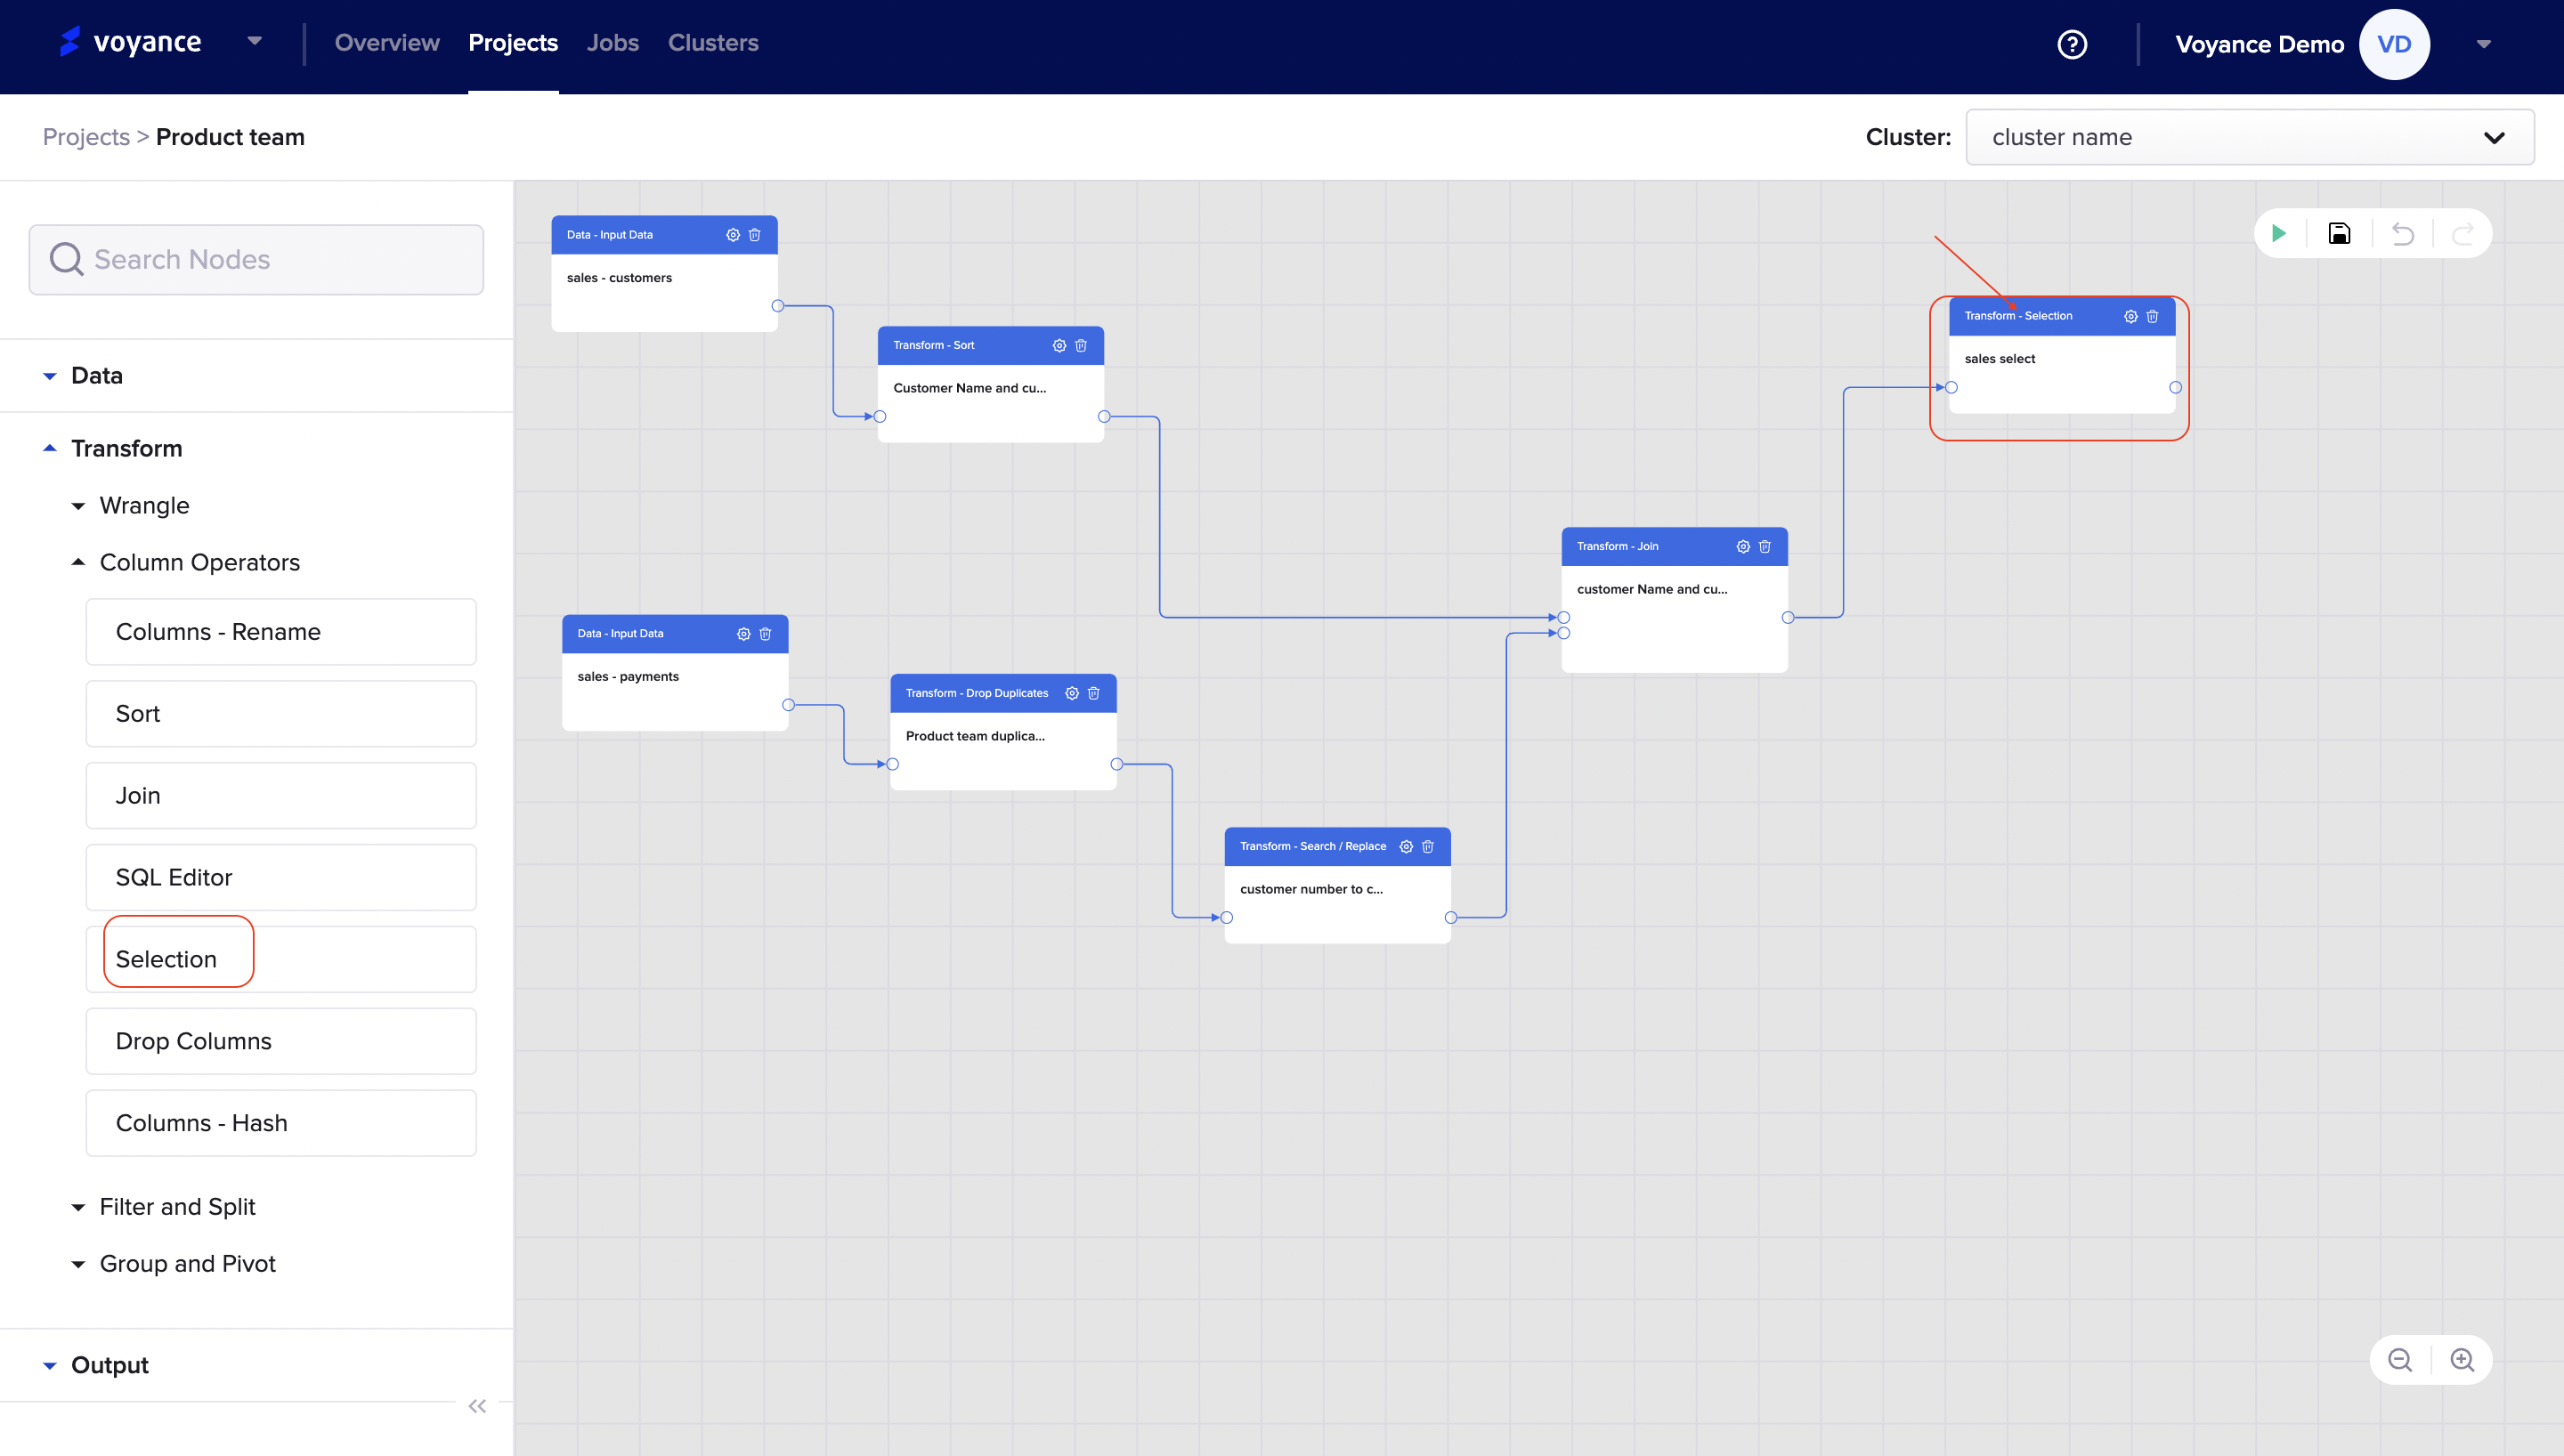
Selection
The selection feature is a part of the transformation process under the column operators. It is the process of selecting columns from your dataset to perform transformations. To perform selection, click on "Transform>Column operators, click and drag the selection feature under the column operators to the workflow. The selection appears on the workflow where you can edit the process to perform the transformation.
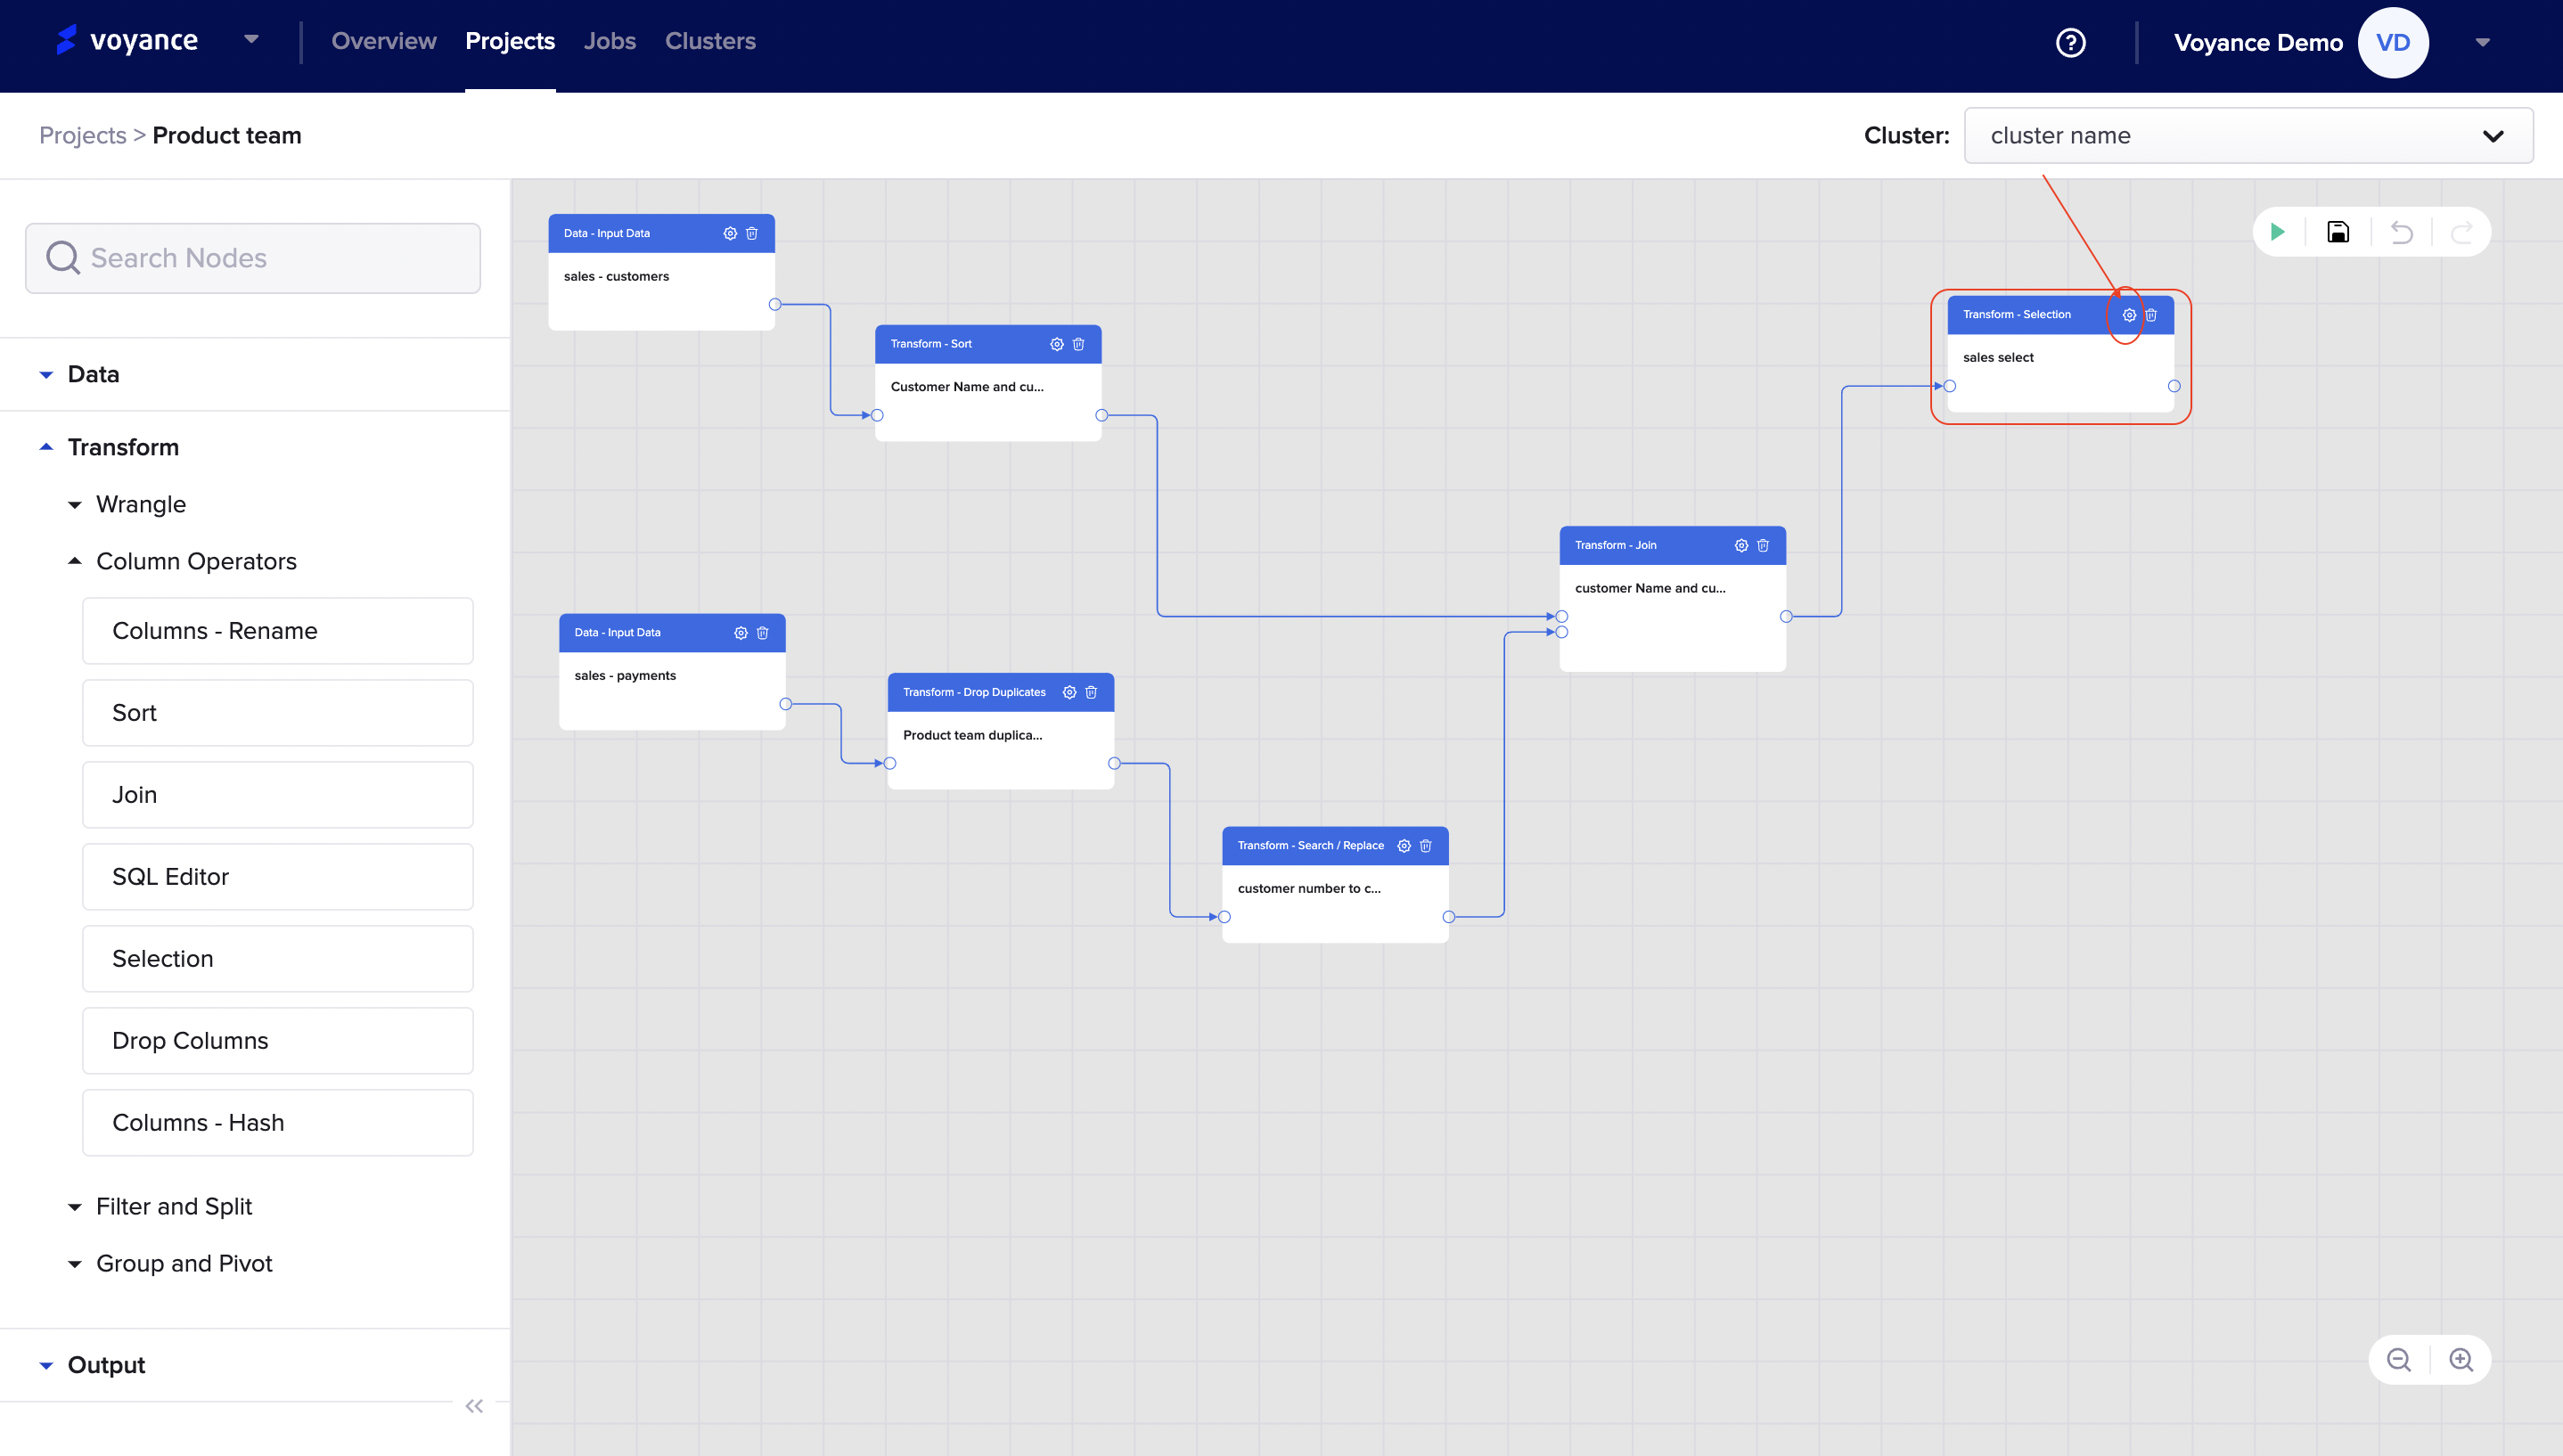
Edit the Selection Process
To edit the selection transformation process, click on the *Settings icon at the top-right corner of the selection dialog box on the workflow.
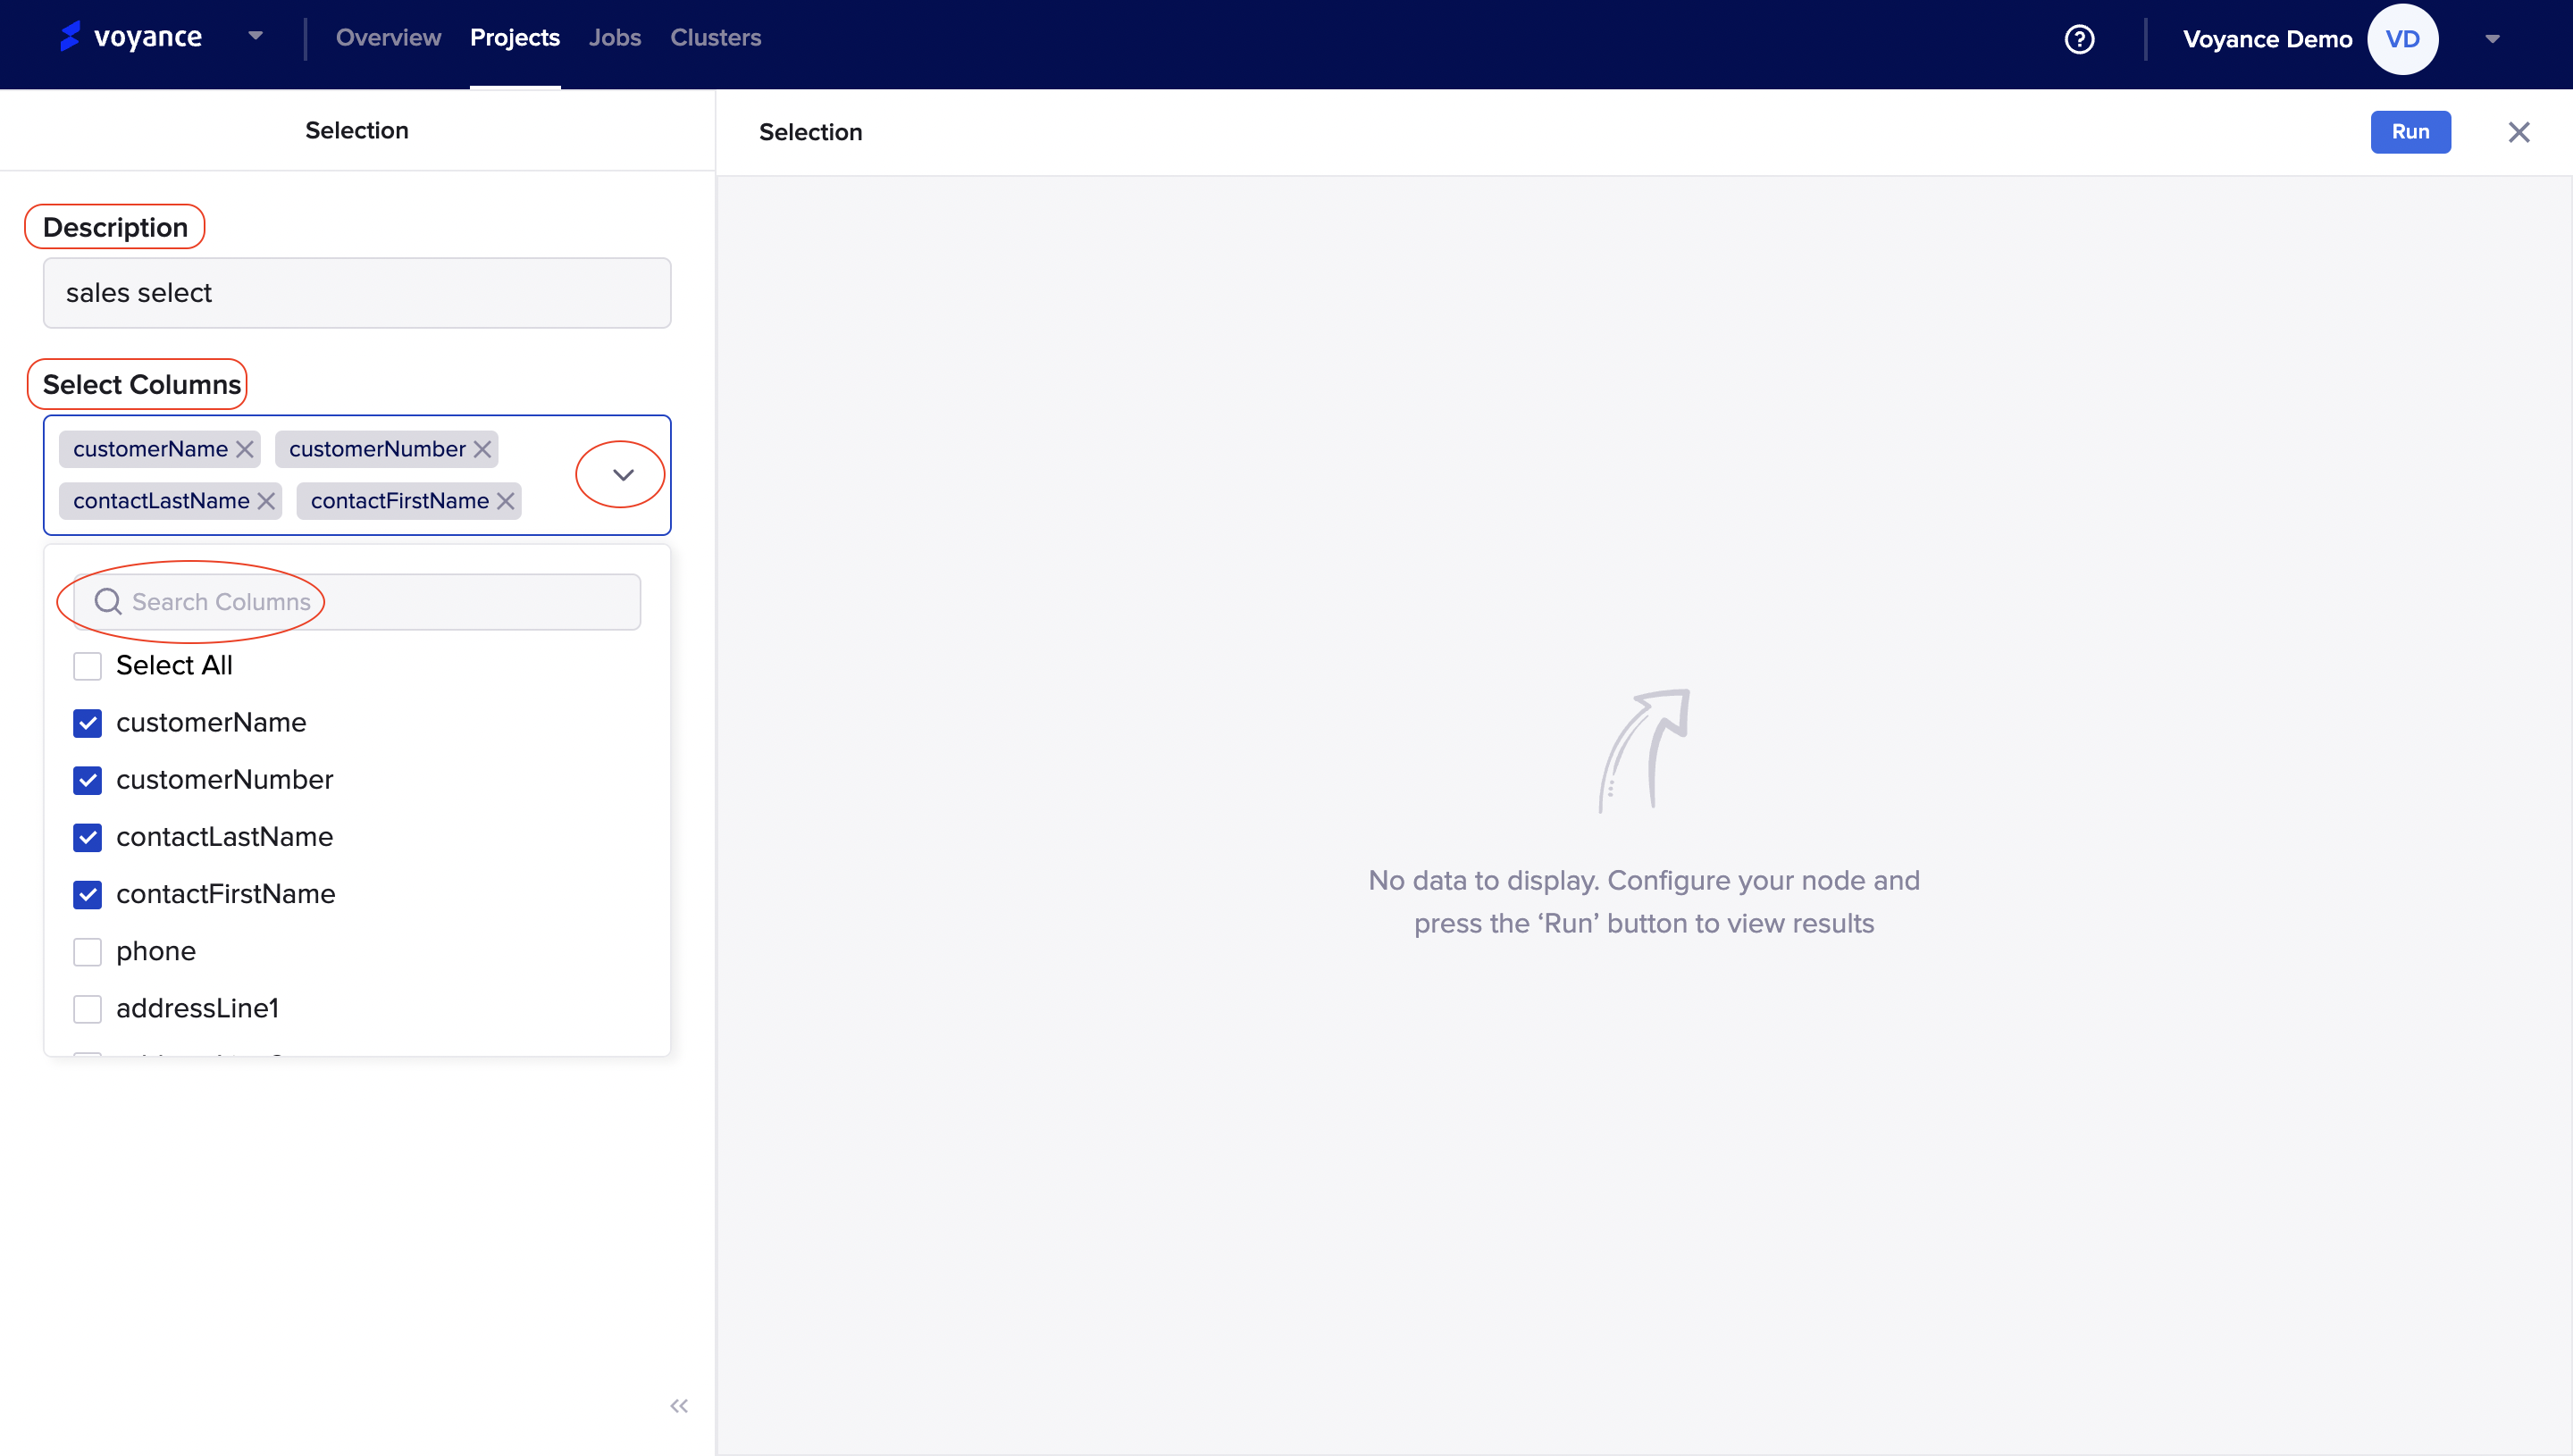
It redirects you to the selection dashboard where you can select your columns from your datasets and analyze the columns selected. Fill in the parameters on the dashboard to be able to perform the transformation.
Description: Give a title or name to the selection process you want to perform.
Select Column:To select columns, click on the drop-down to view the columns available for selection. To select the columns, click on the "checkbox(es)" to select the columns you want to use for your transformation. You have the option of selecting all of the columns. Every column selected will be displayed on the select column tab for analysis.
You have the option to search for columns you want to use for transformation using keywords for the search.
Run Program
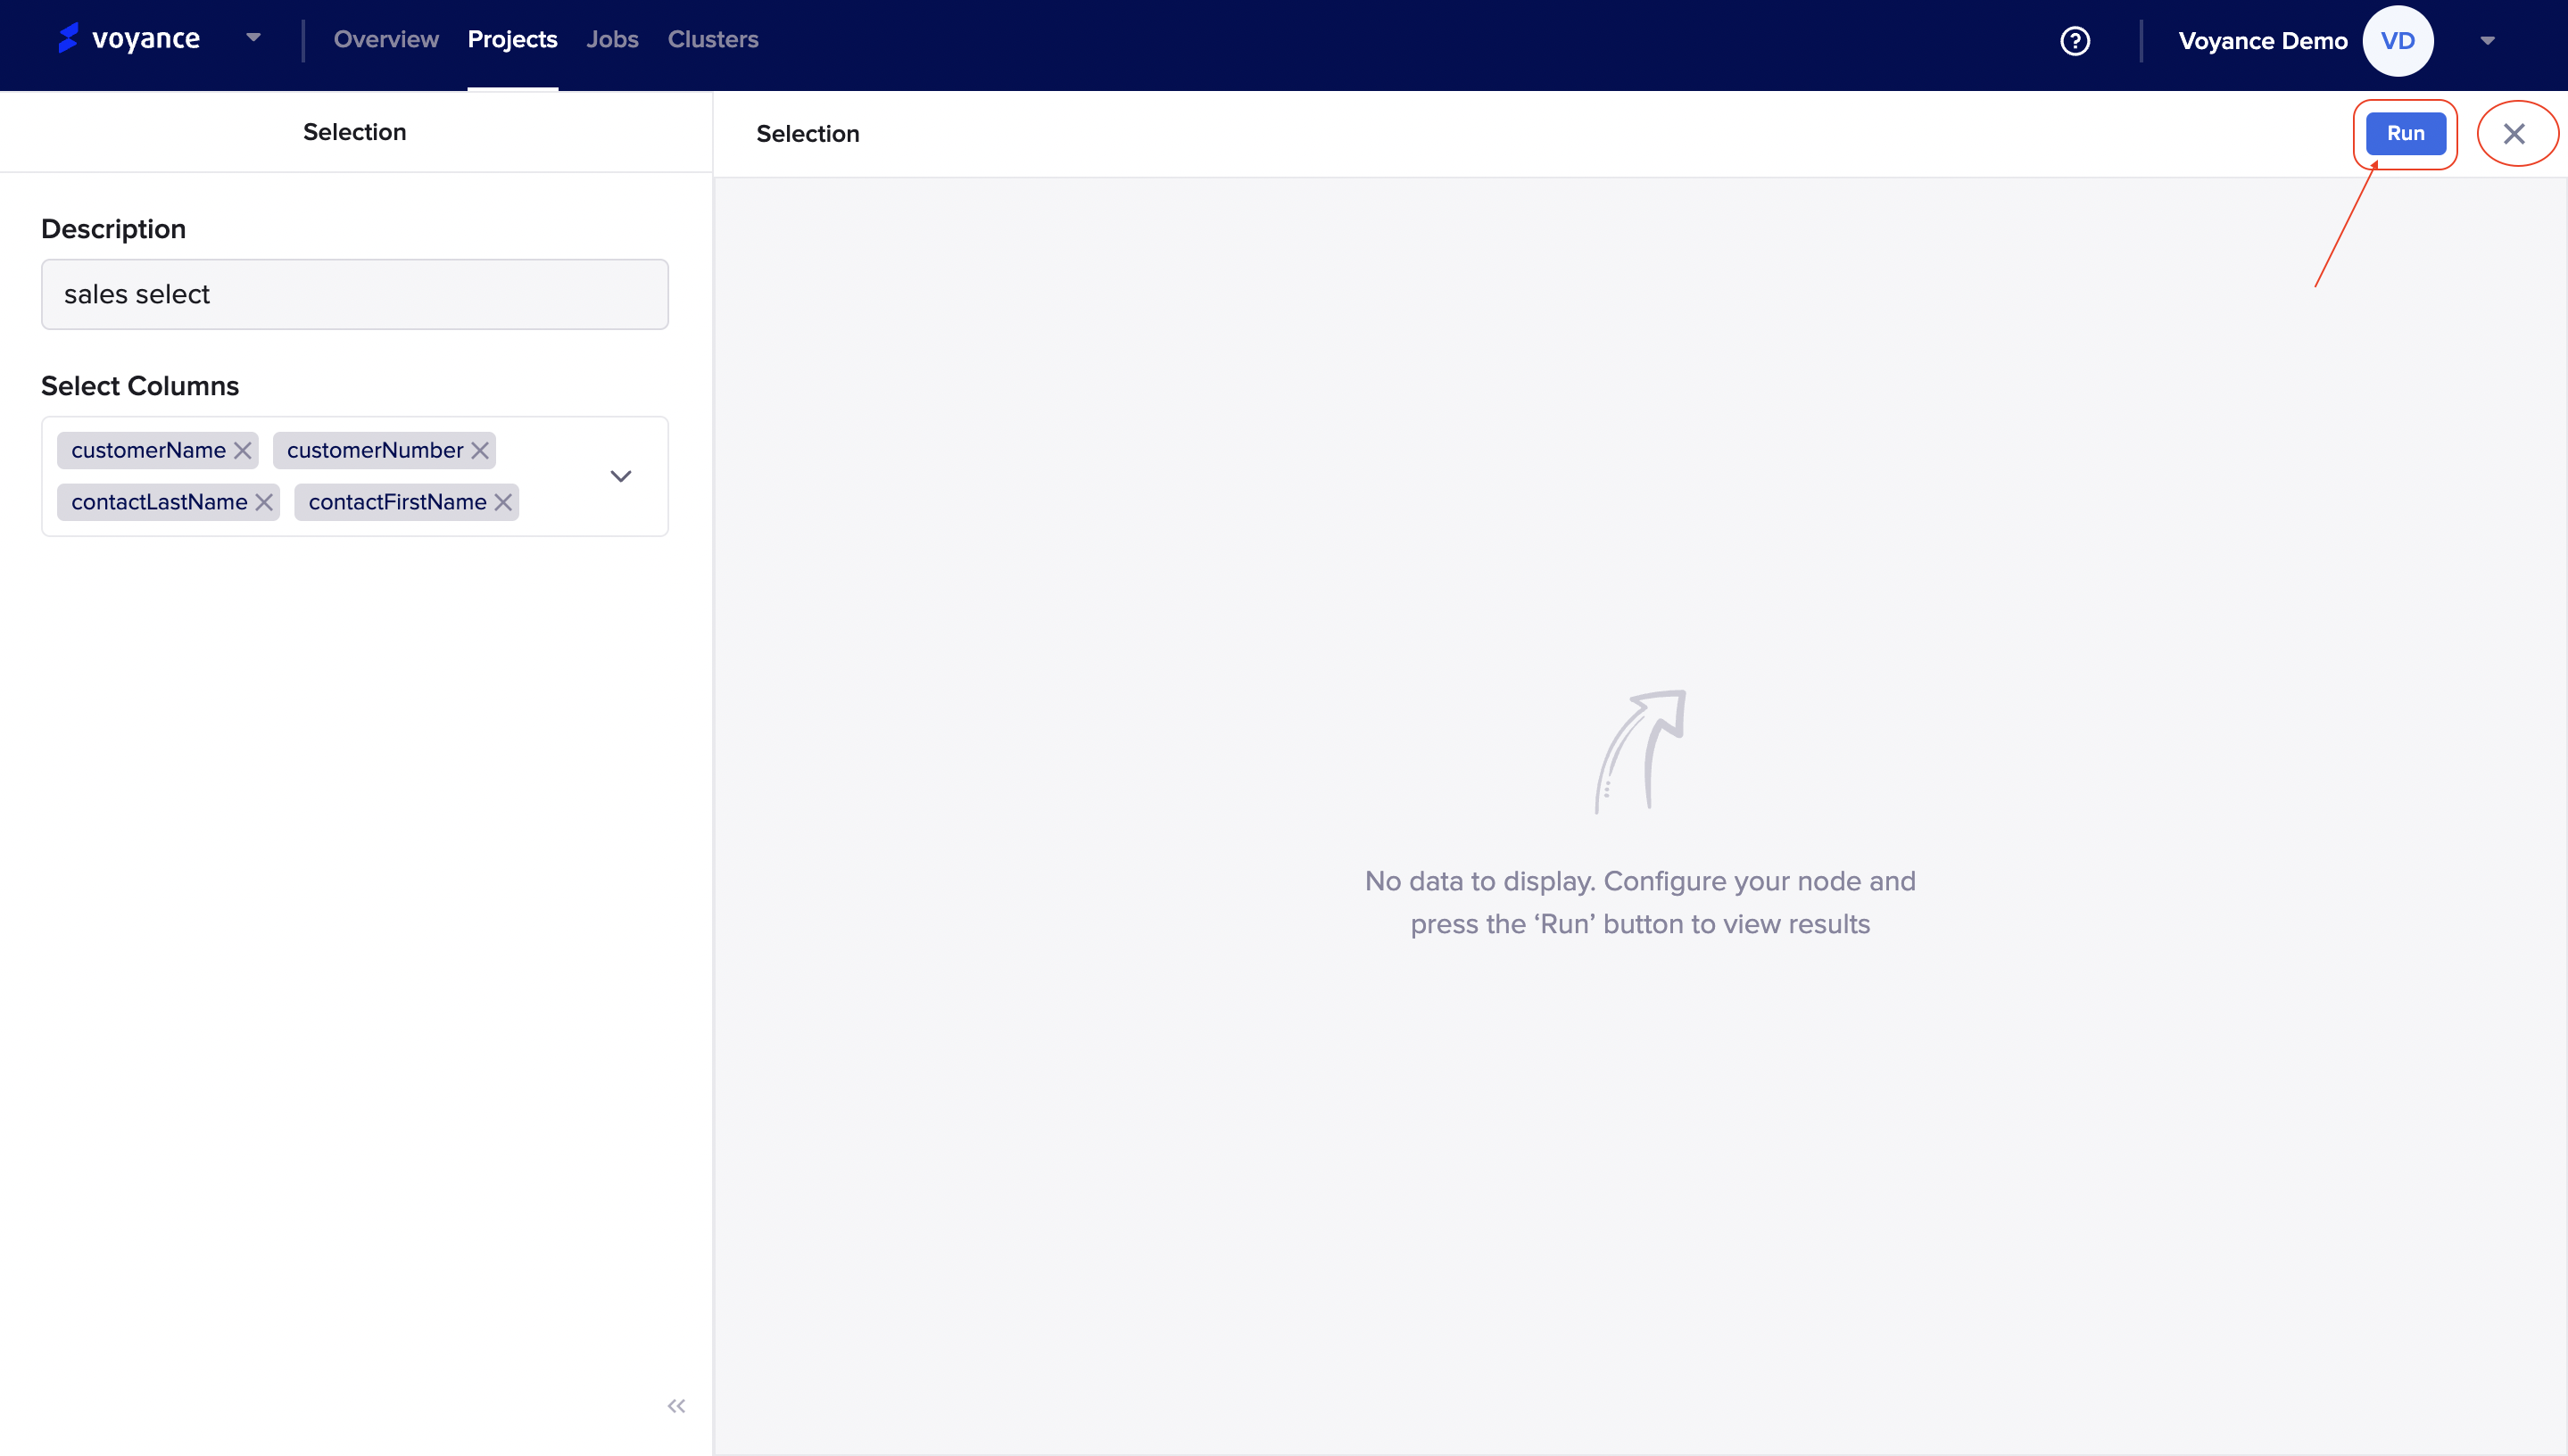
Once the parameters have been filled, you need to run the graph to view its performance. Click on the *Run at the top-right corner of the dashboard to analyze the graph. To cancel the run process, click on the (X) beside the run tab in the top-right corner to cancel the run process
Delete Selection Transform
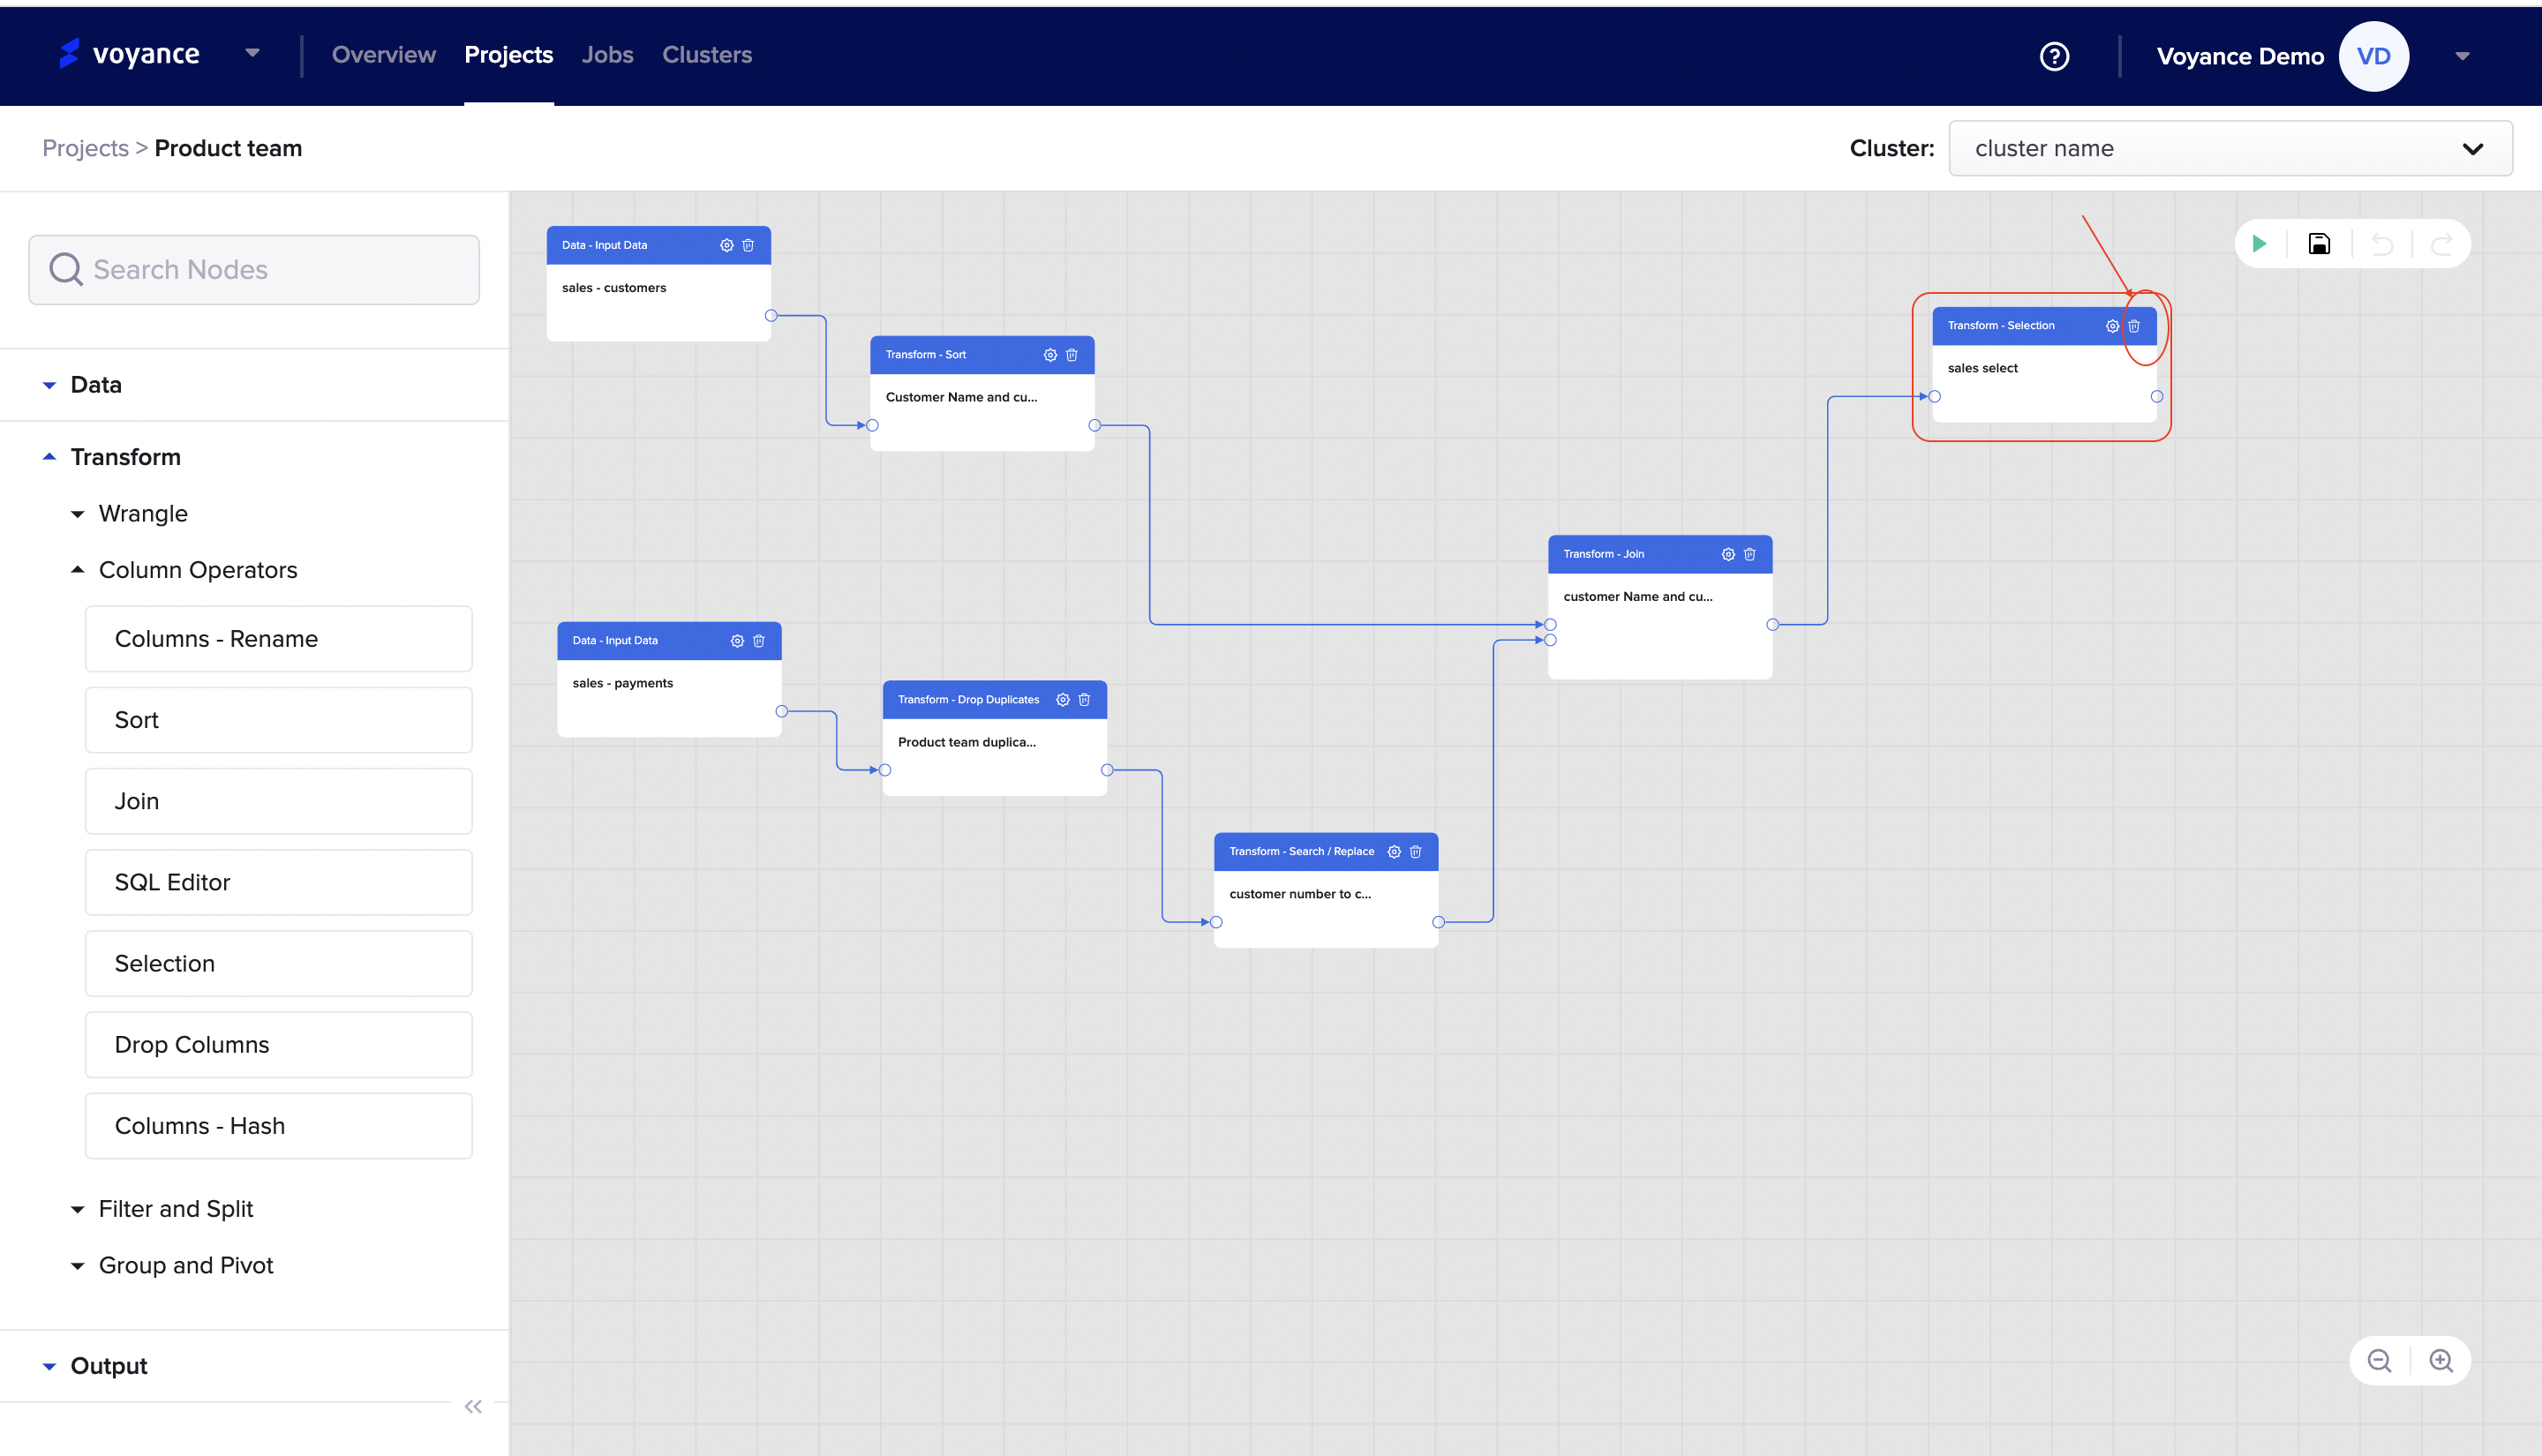
To delete the selection transform capabilities, click on the Delete icon at the top-right of the selection dialog box on the workflow
Drop Columns
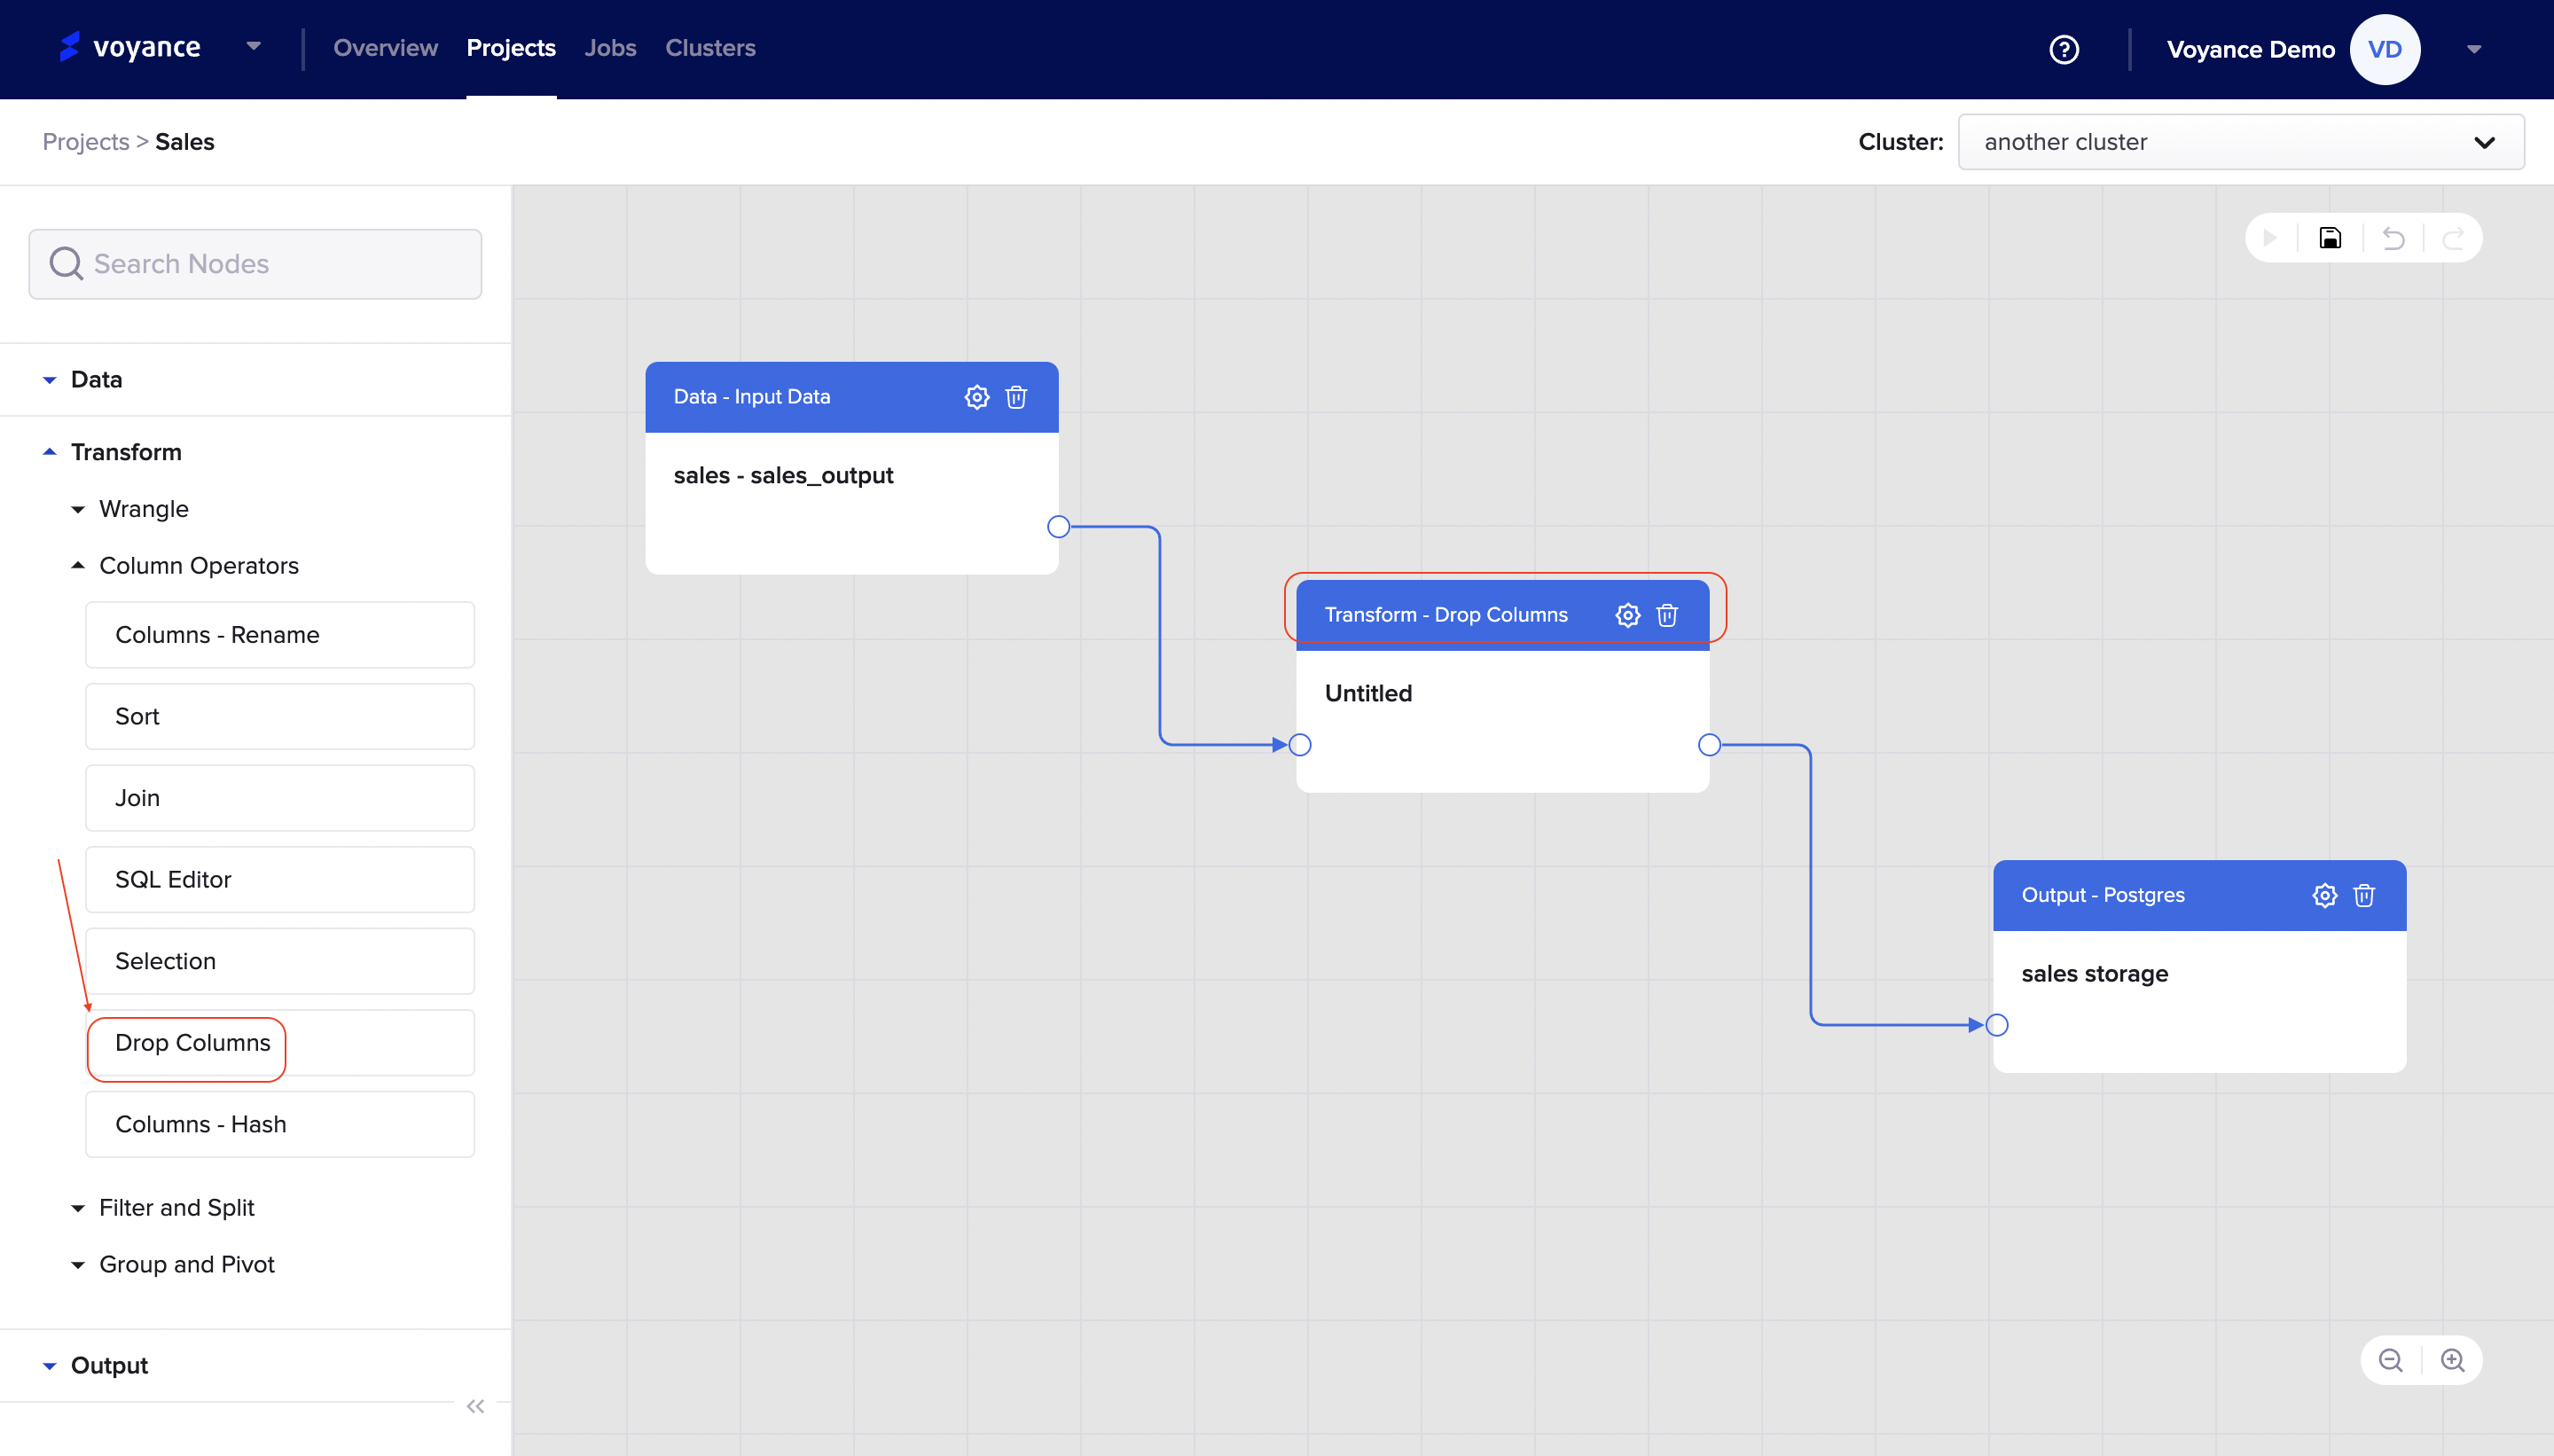
Drop column is part of column operators which enables you to. remove or delete columns from datasets. To drop columns, drag and drop the drop column tab under the column operators to the project workflow.
Edit Drop Columns
To edit the drop column dialog box on the workflow, click on the Settings icon at the top-right of the dialog box on the workflow.
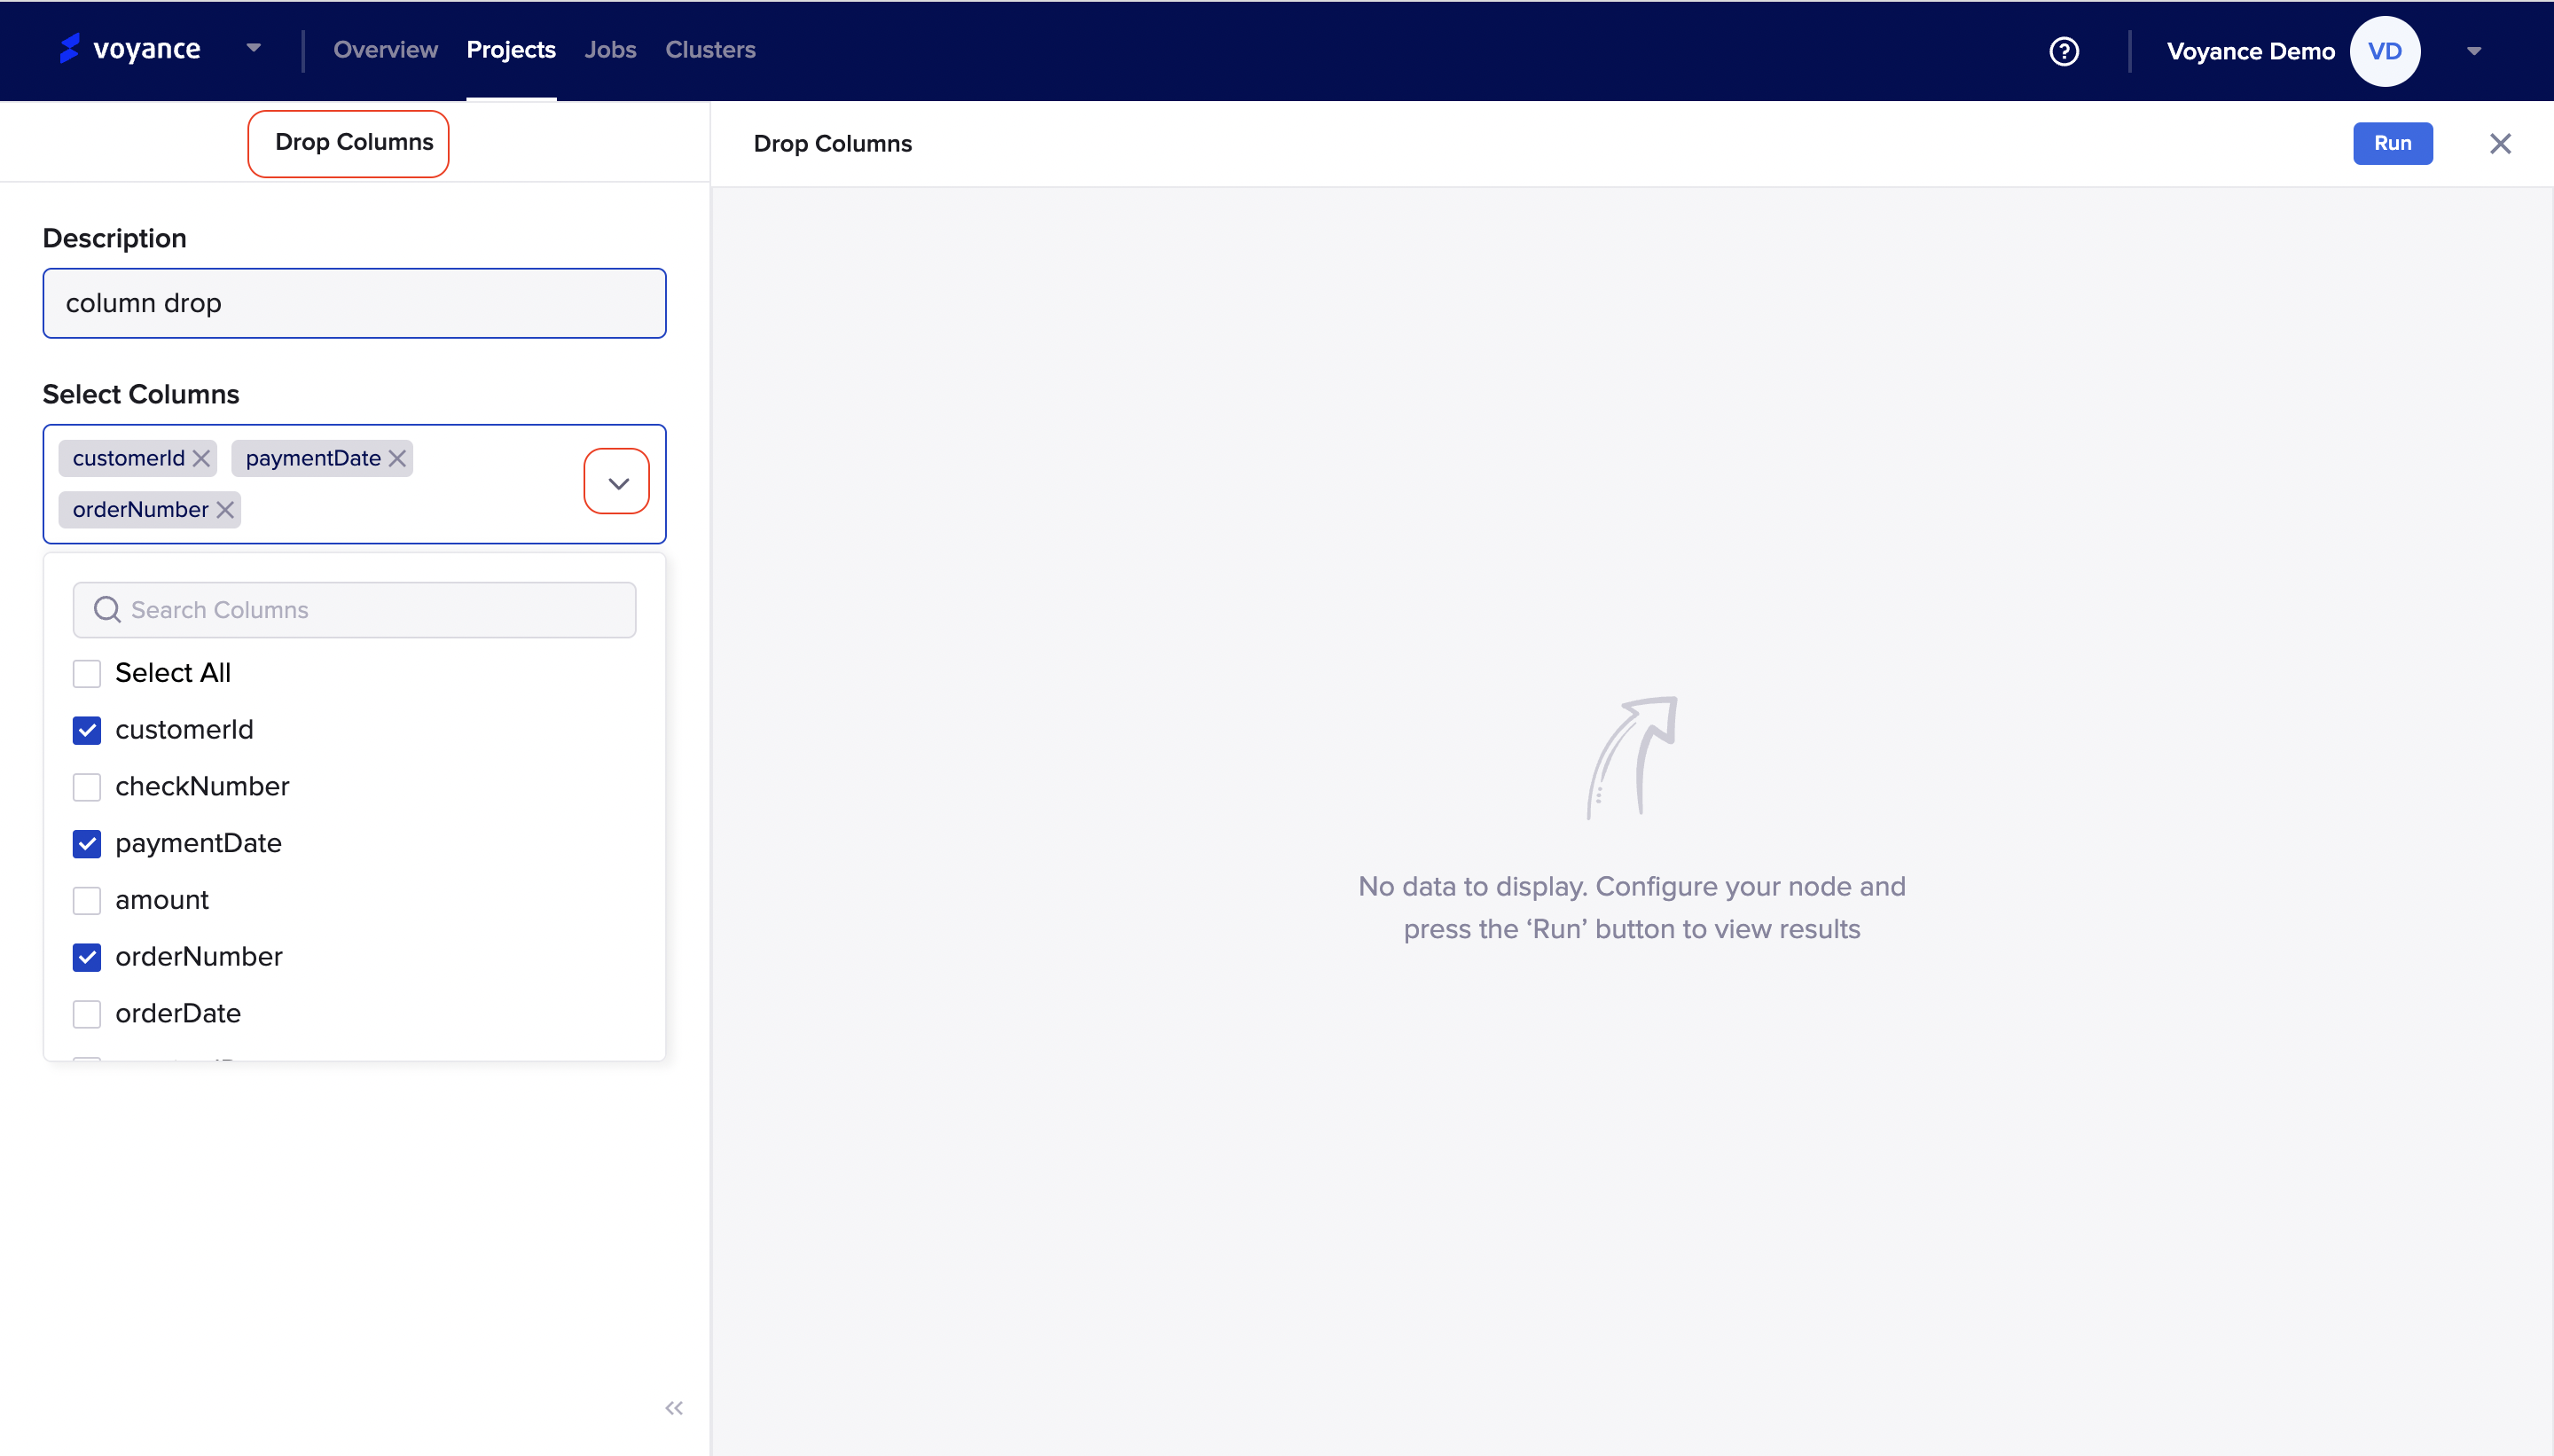
it redirects you to the drop column dashboard or page where you perform and remove columns from your datasets. To drop columns from your database or datasets, you will need to fill in the parameters on the page:
Description: Give a title or name to the drop column dashboard.
Select Columns: To select the columns to drop, click on the drop-down arrow and click on the checkbox(es) to select columns, whatever columns are selected will be displayed on the select column tab. you have the option to search columns.
Run Program
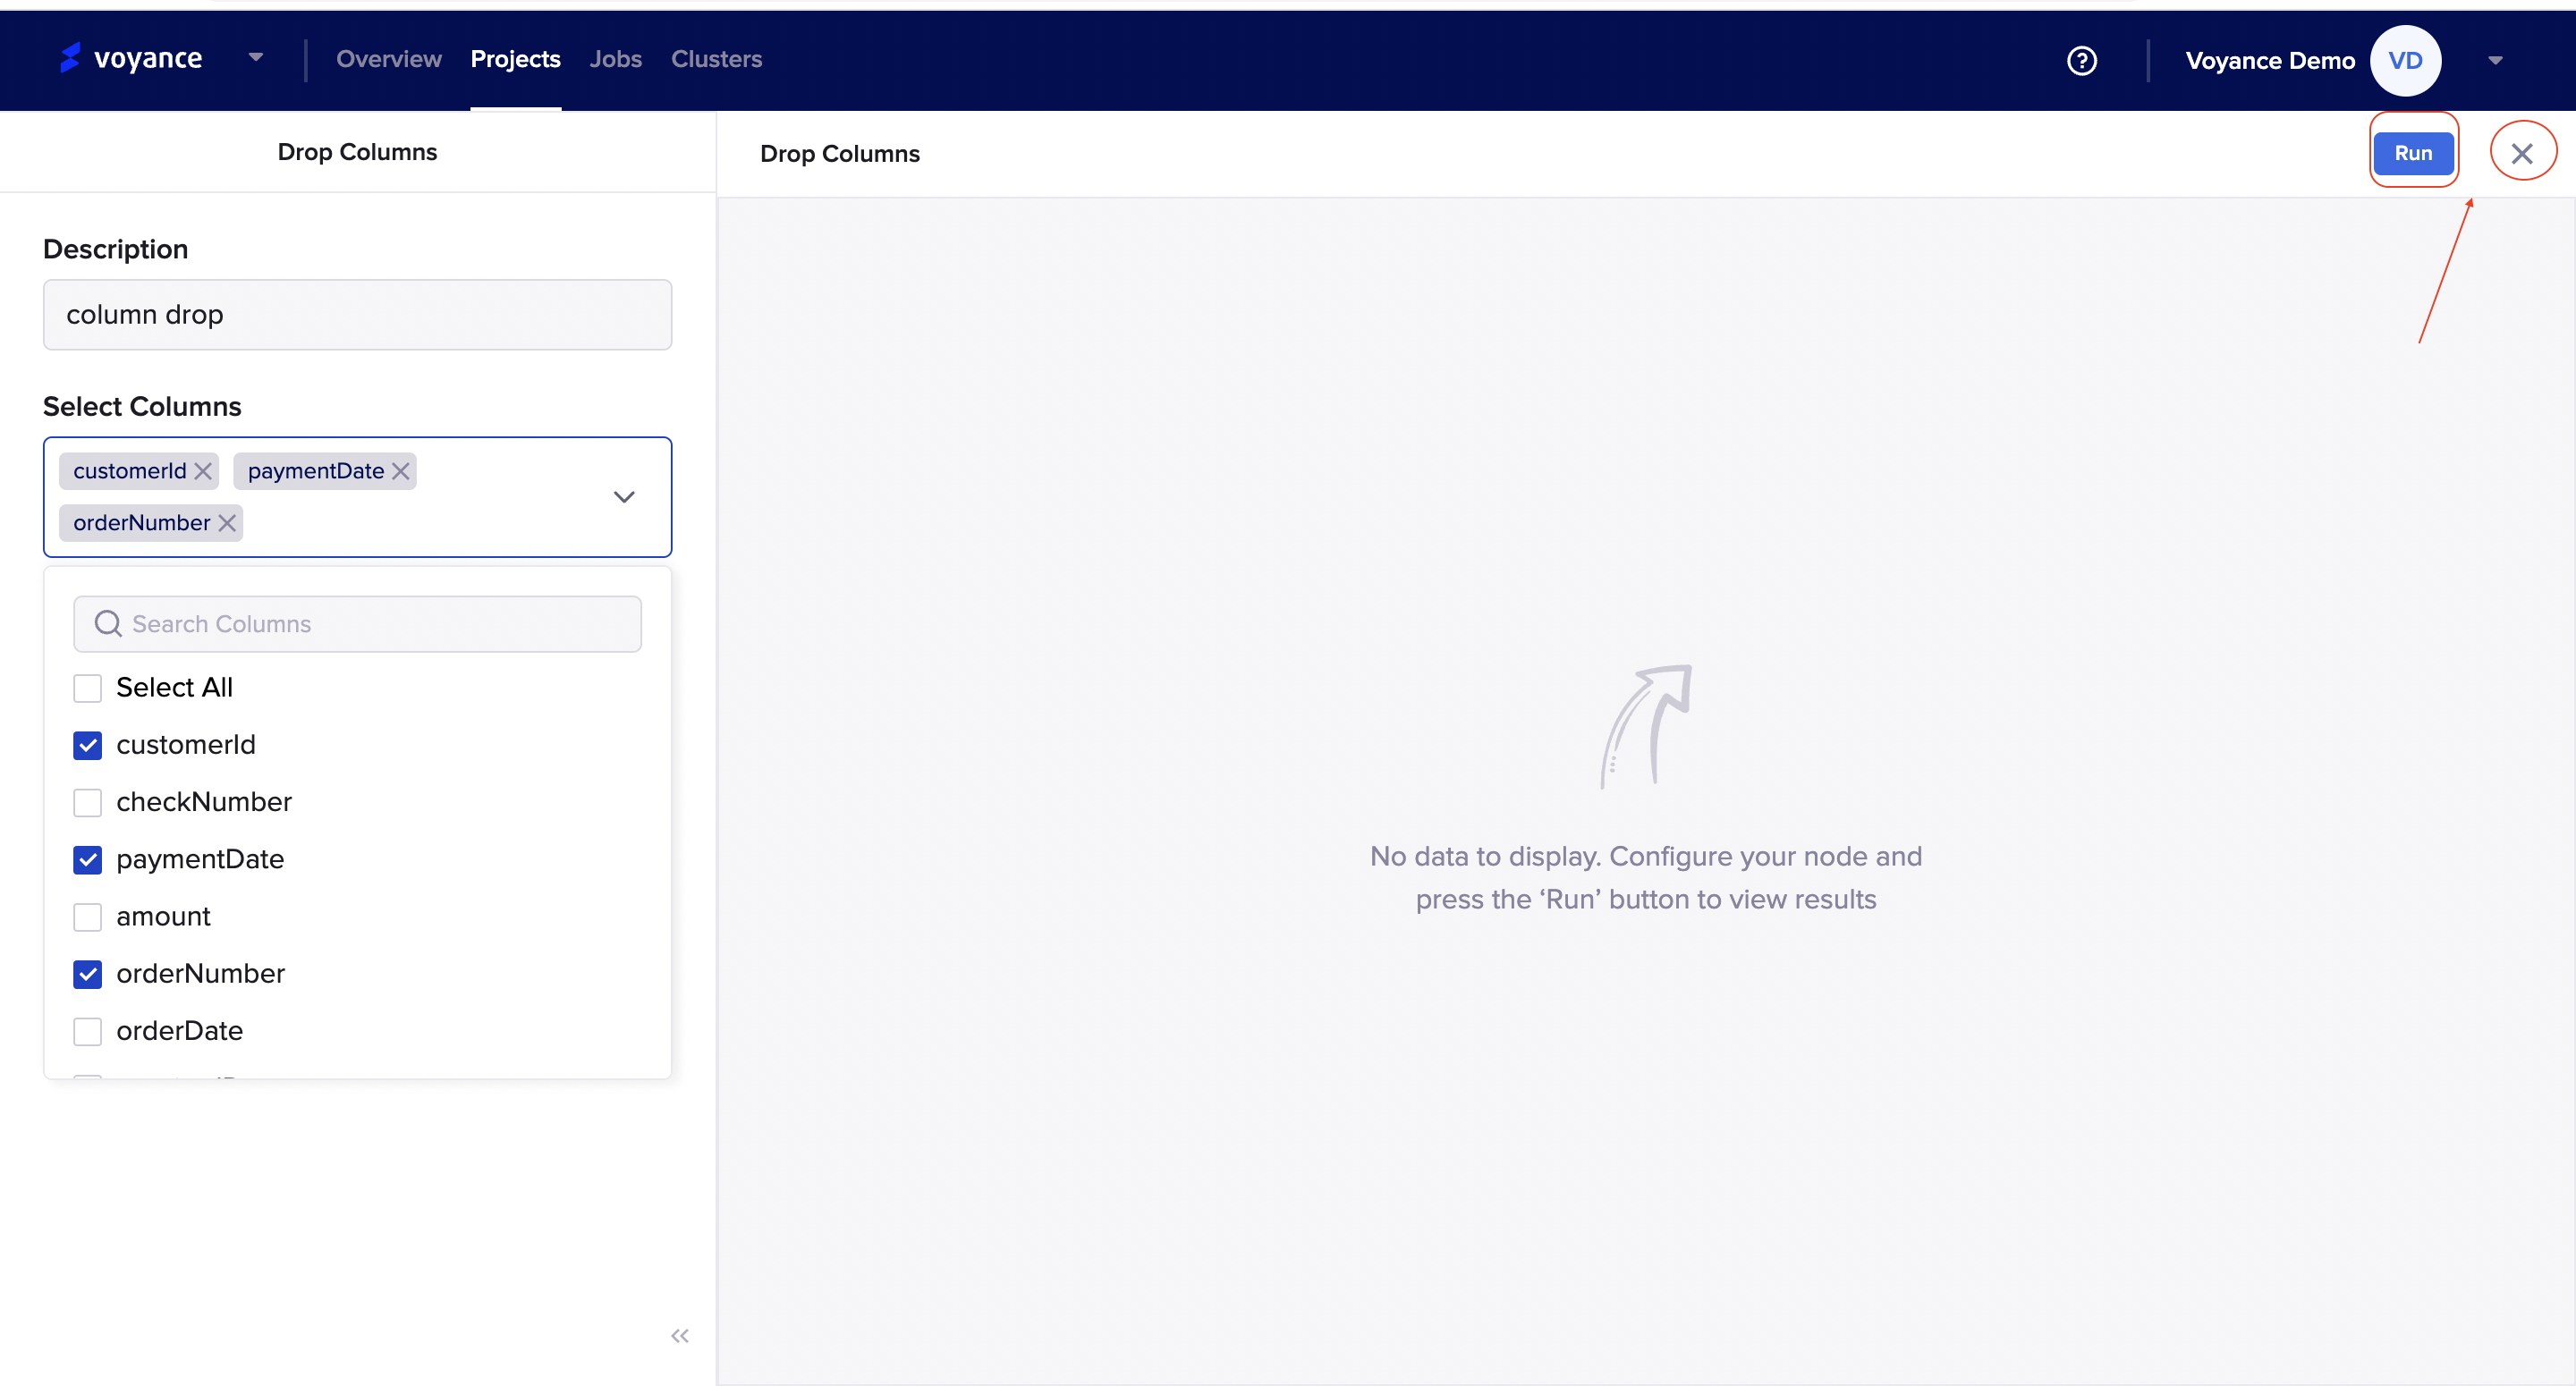
Once the parameters have been filled, click on the *Run at the top-right of the drop column page to analyze the graph and view the result of the transformation. To cancel the run process, click on the (X) beside the run tab at the top-right of the page.
Delete Drop Columns
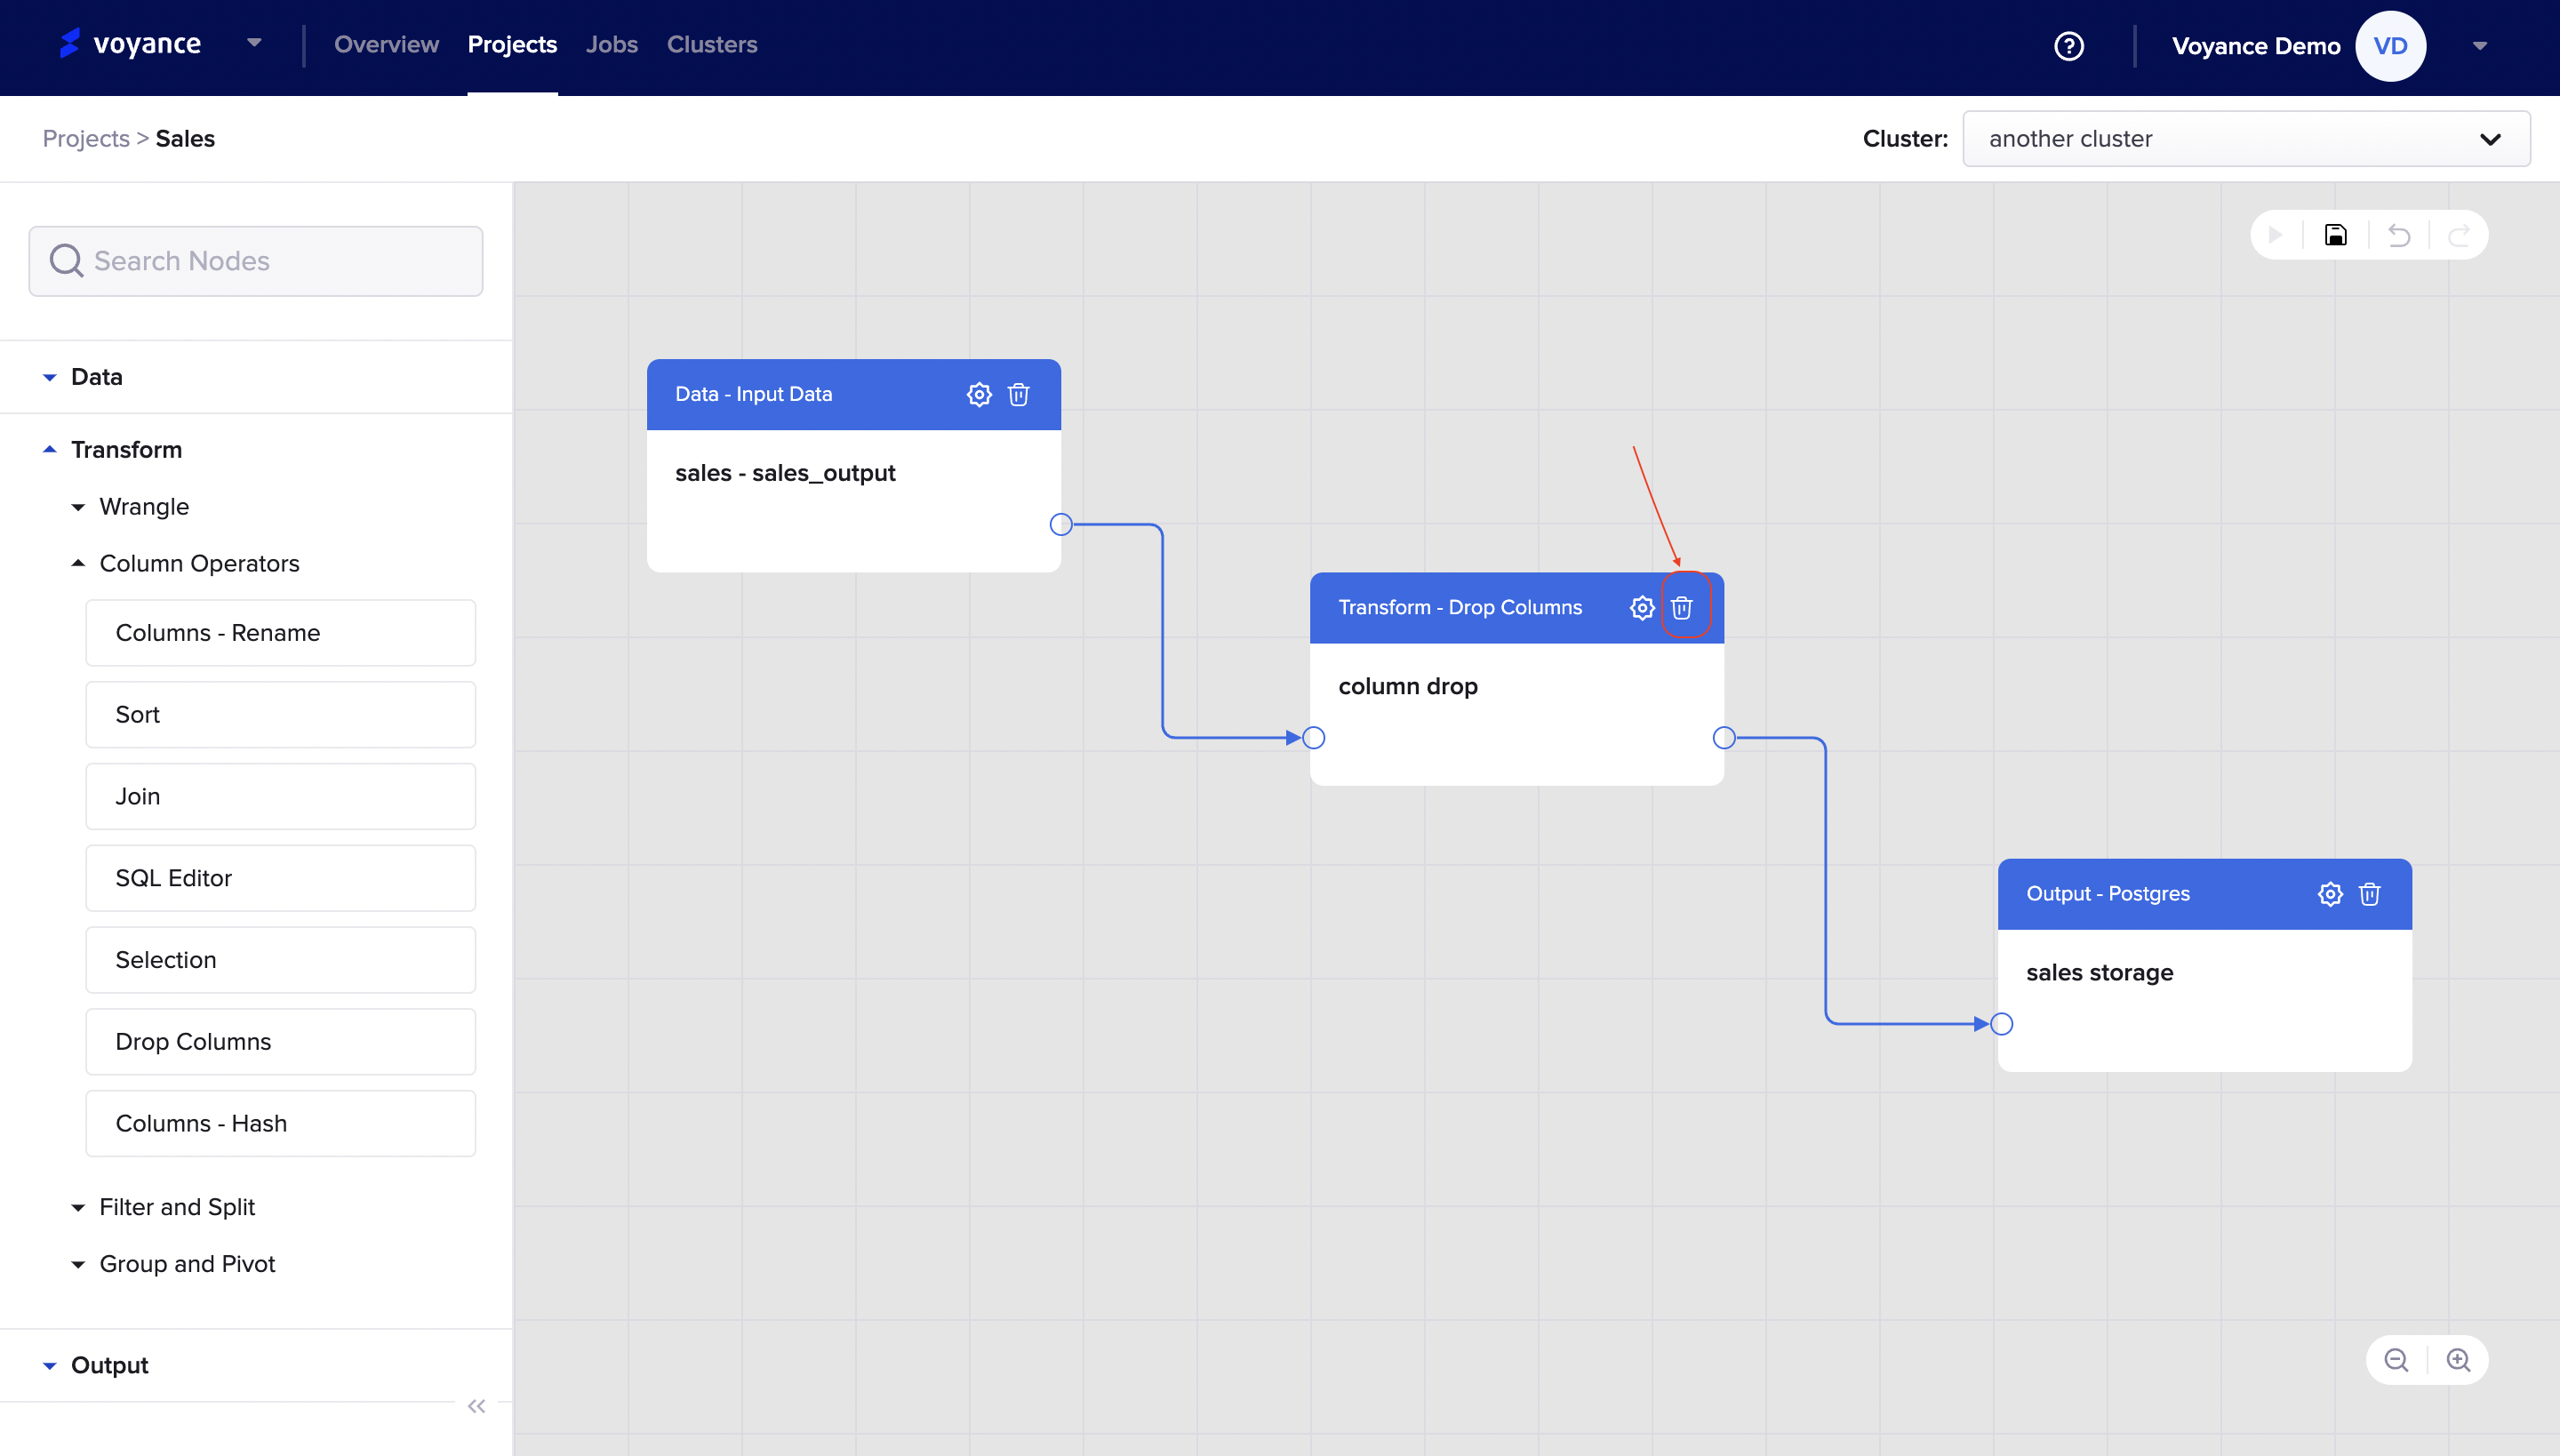
To delete or cancel the drop column, click on the *Delete icon at the top-right of the dialog box of the workflow.
Columns-Hash
Transform With Filter and Split
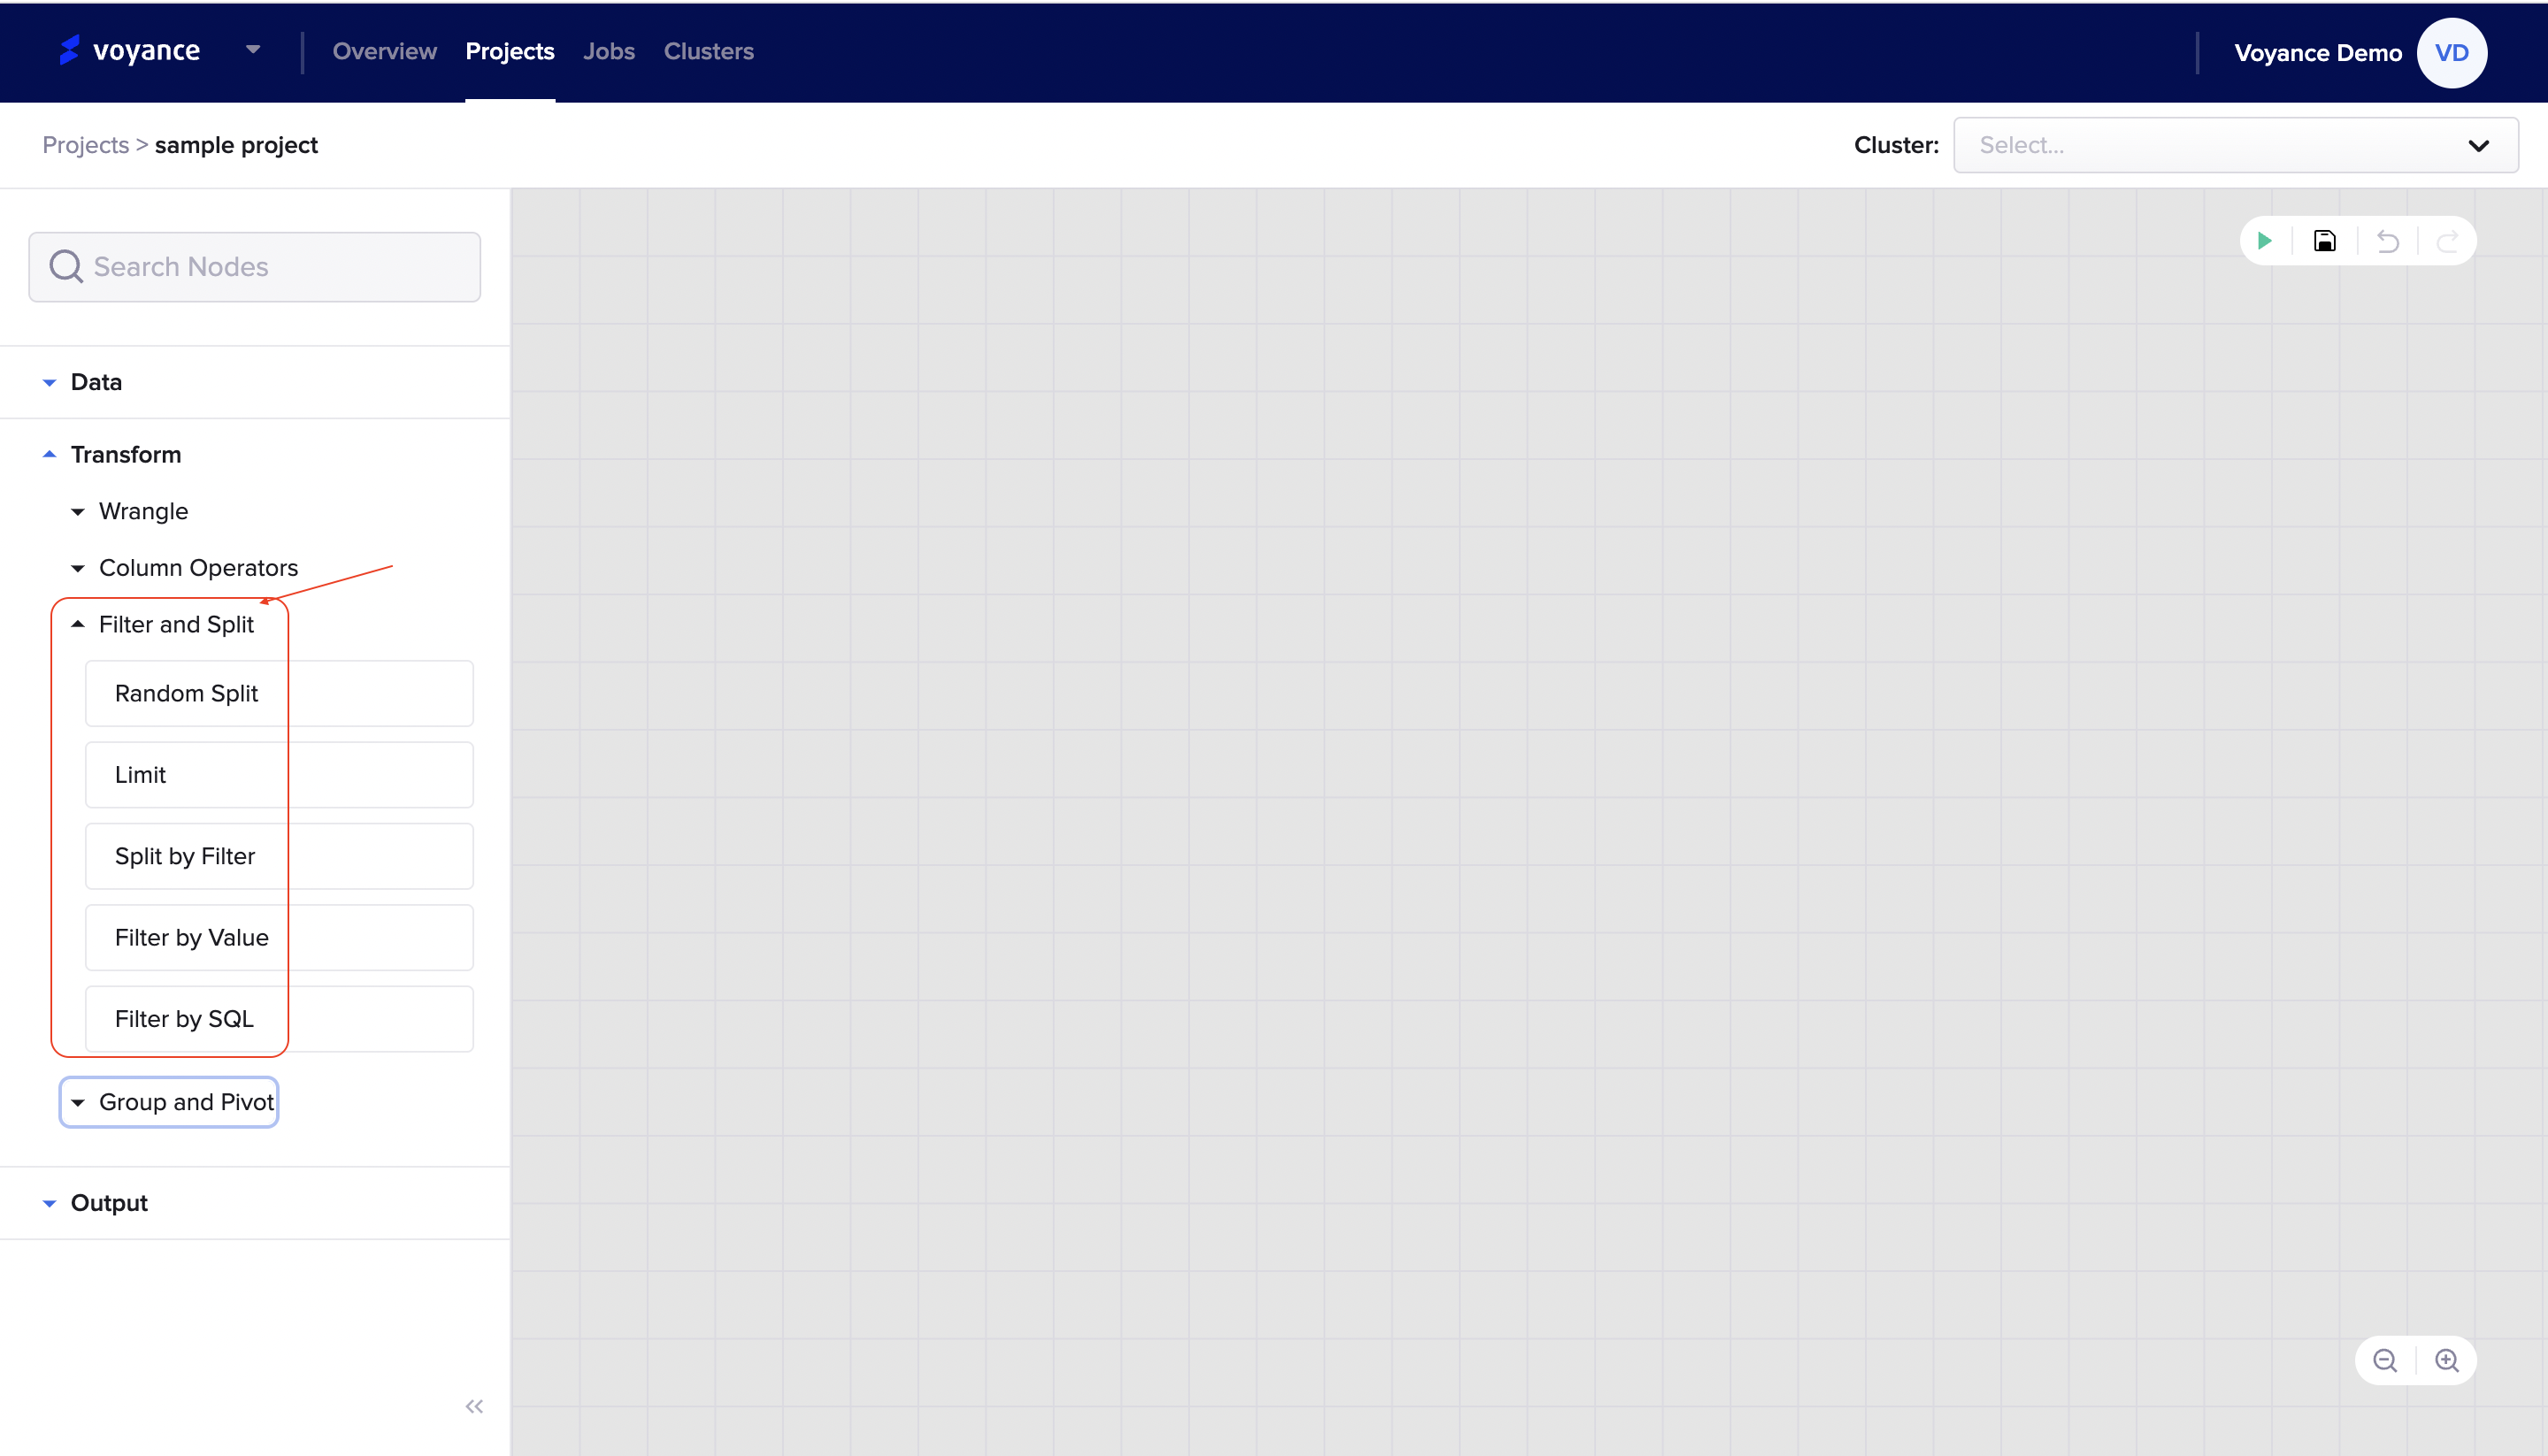
By transforming your data with the filter and split feature tools, you can analyze your data better. With our filter and split operator tools, you will be able to perform different transformation processes like "Random split", "Limit", "Split by filter", "Filter by value", "Filter by SQL" for better data analysis.
To view the different transformation processes under the filter and split tools, click on "Transform>Fiter and Split, it displays the drop-down list of filter and split tools. The filter and the split drop-down list contain tools you can use to analyse and manipulate your data for better analysis.
Random split
Limit
Split by filter
Filter by Value
Filter by SQL
Random Split
Random split is a tool under the filter and split operator feature which you can use to transform your data. To split your data randomly, click and drag the "Random split tool" to the project workflow, it displays a dialog box on the workflow that allows you to be able to edit for you to apply the tool to your data.
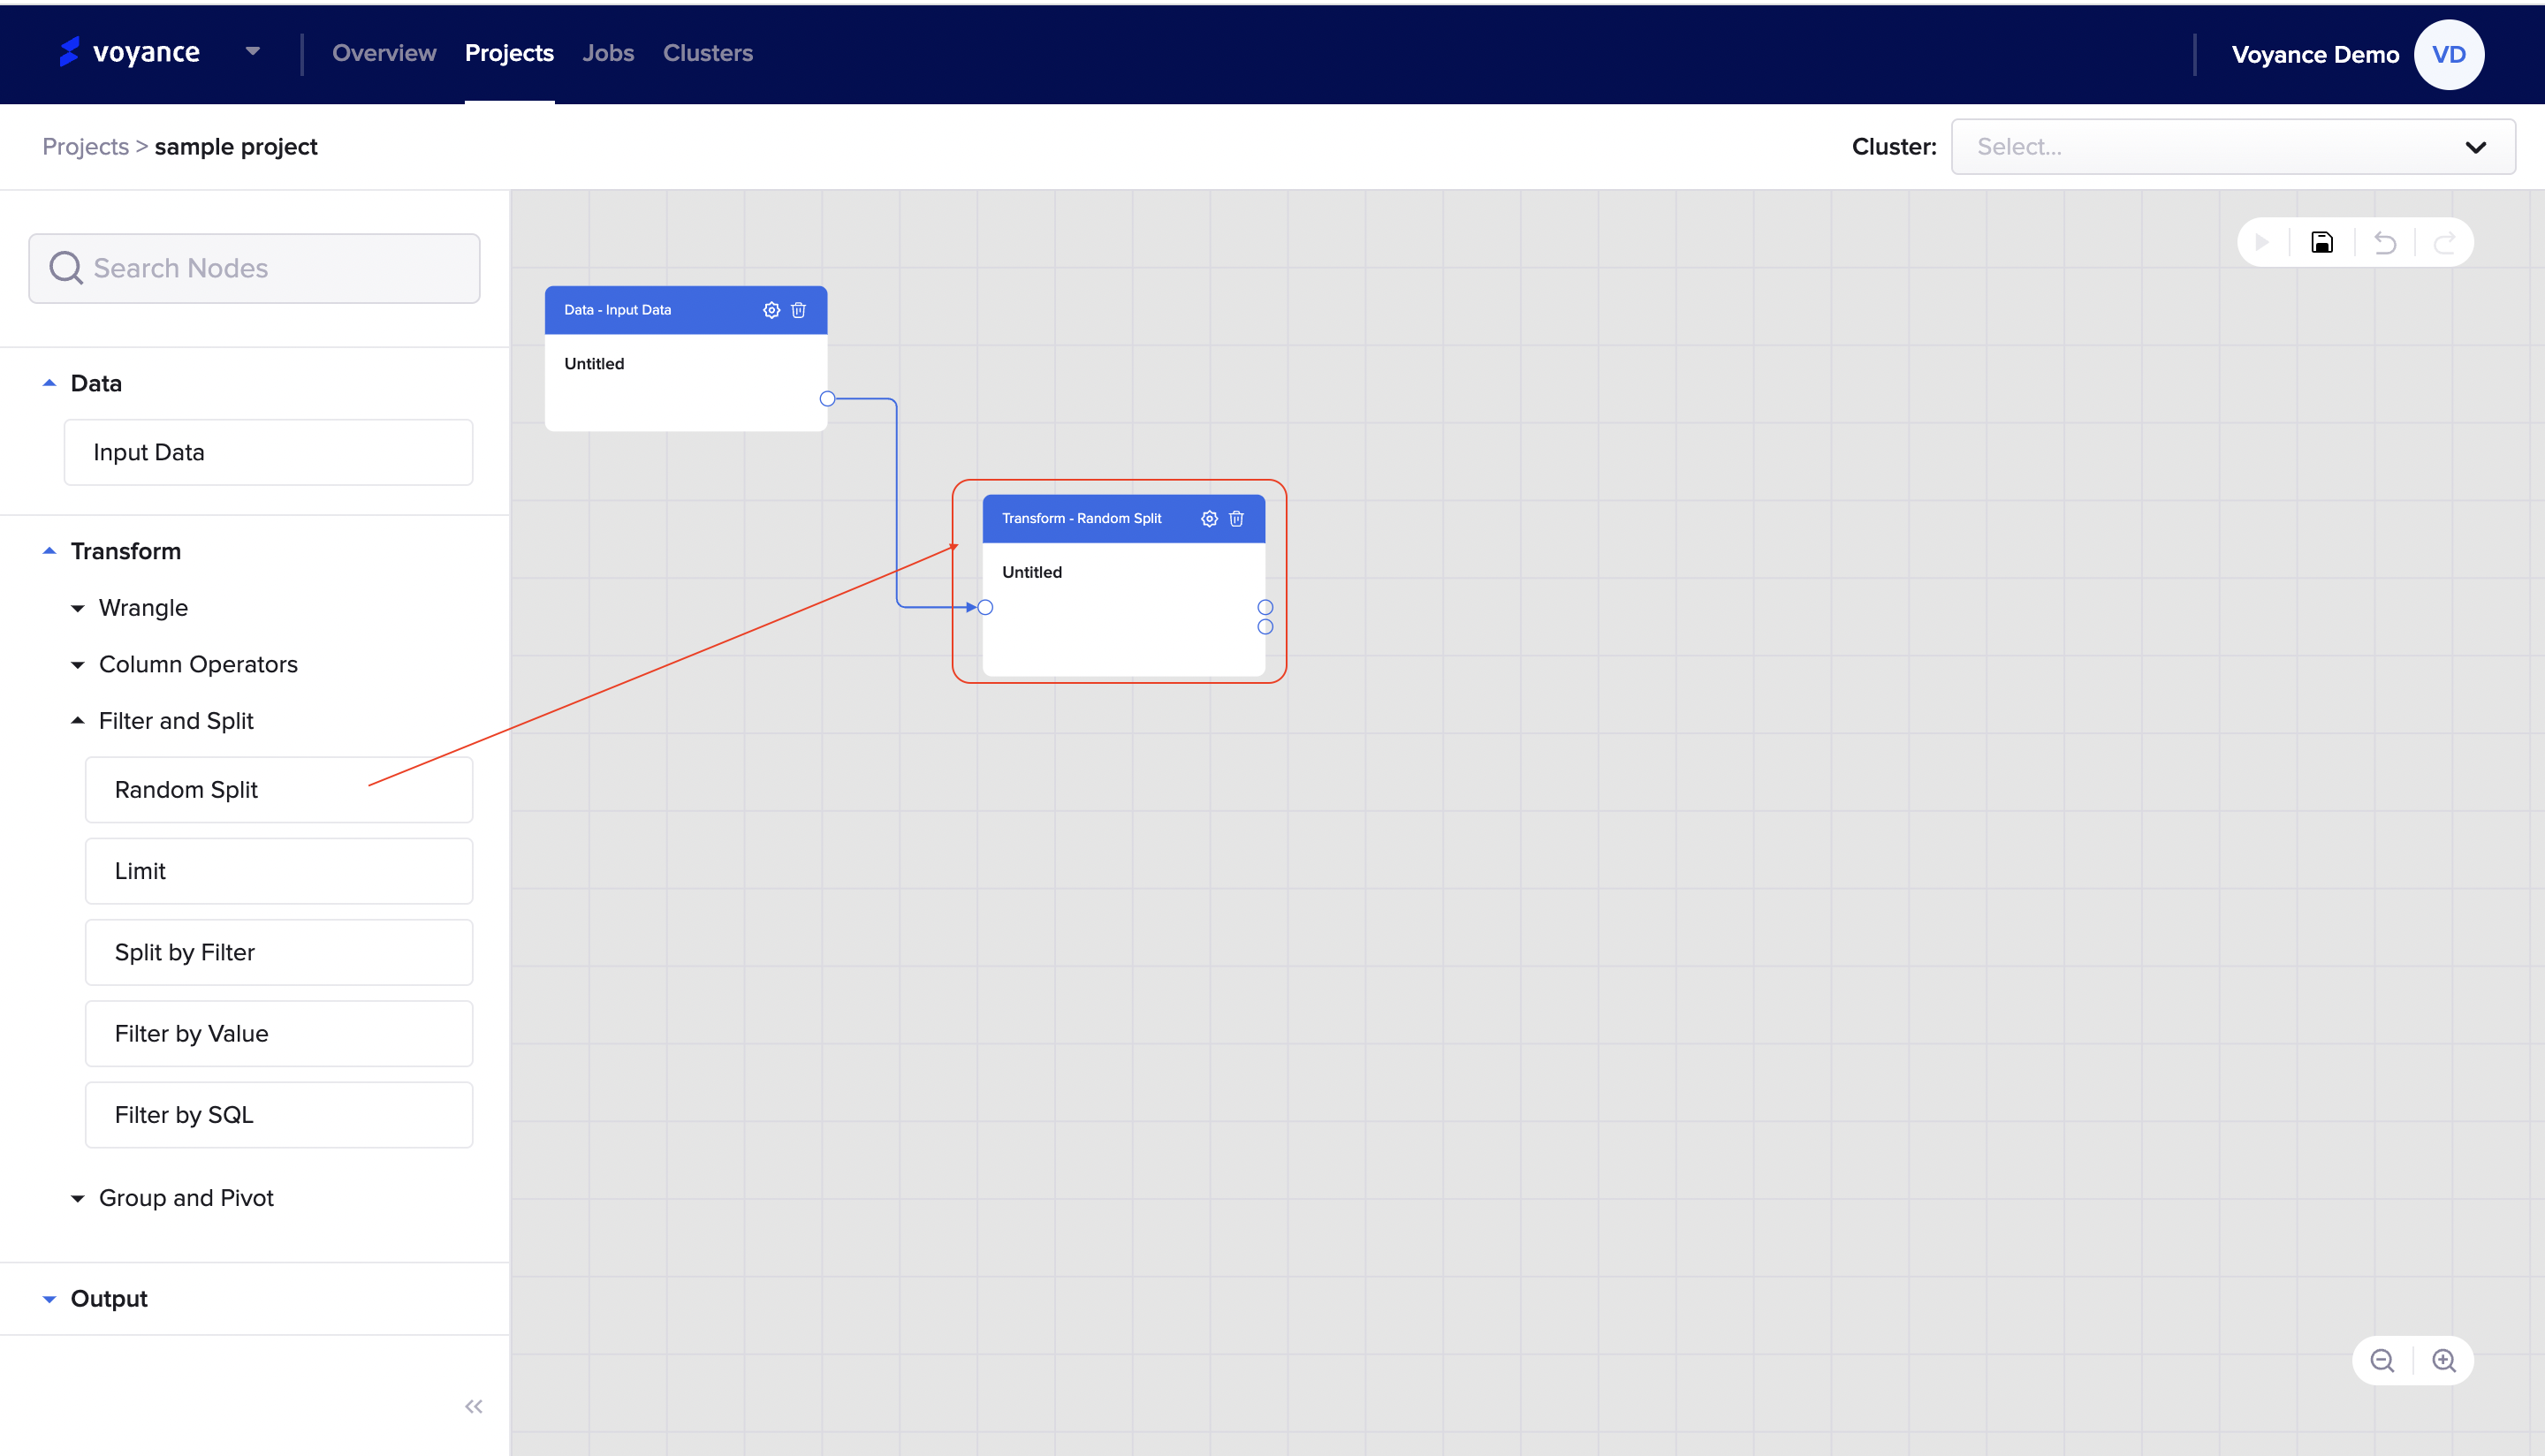
Edit your Random split
To edit your random split for your data transformation, click on the "settings icon" at the top-right of the dialog box,
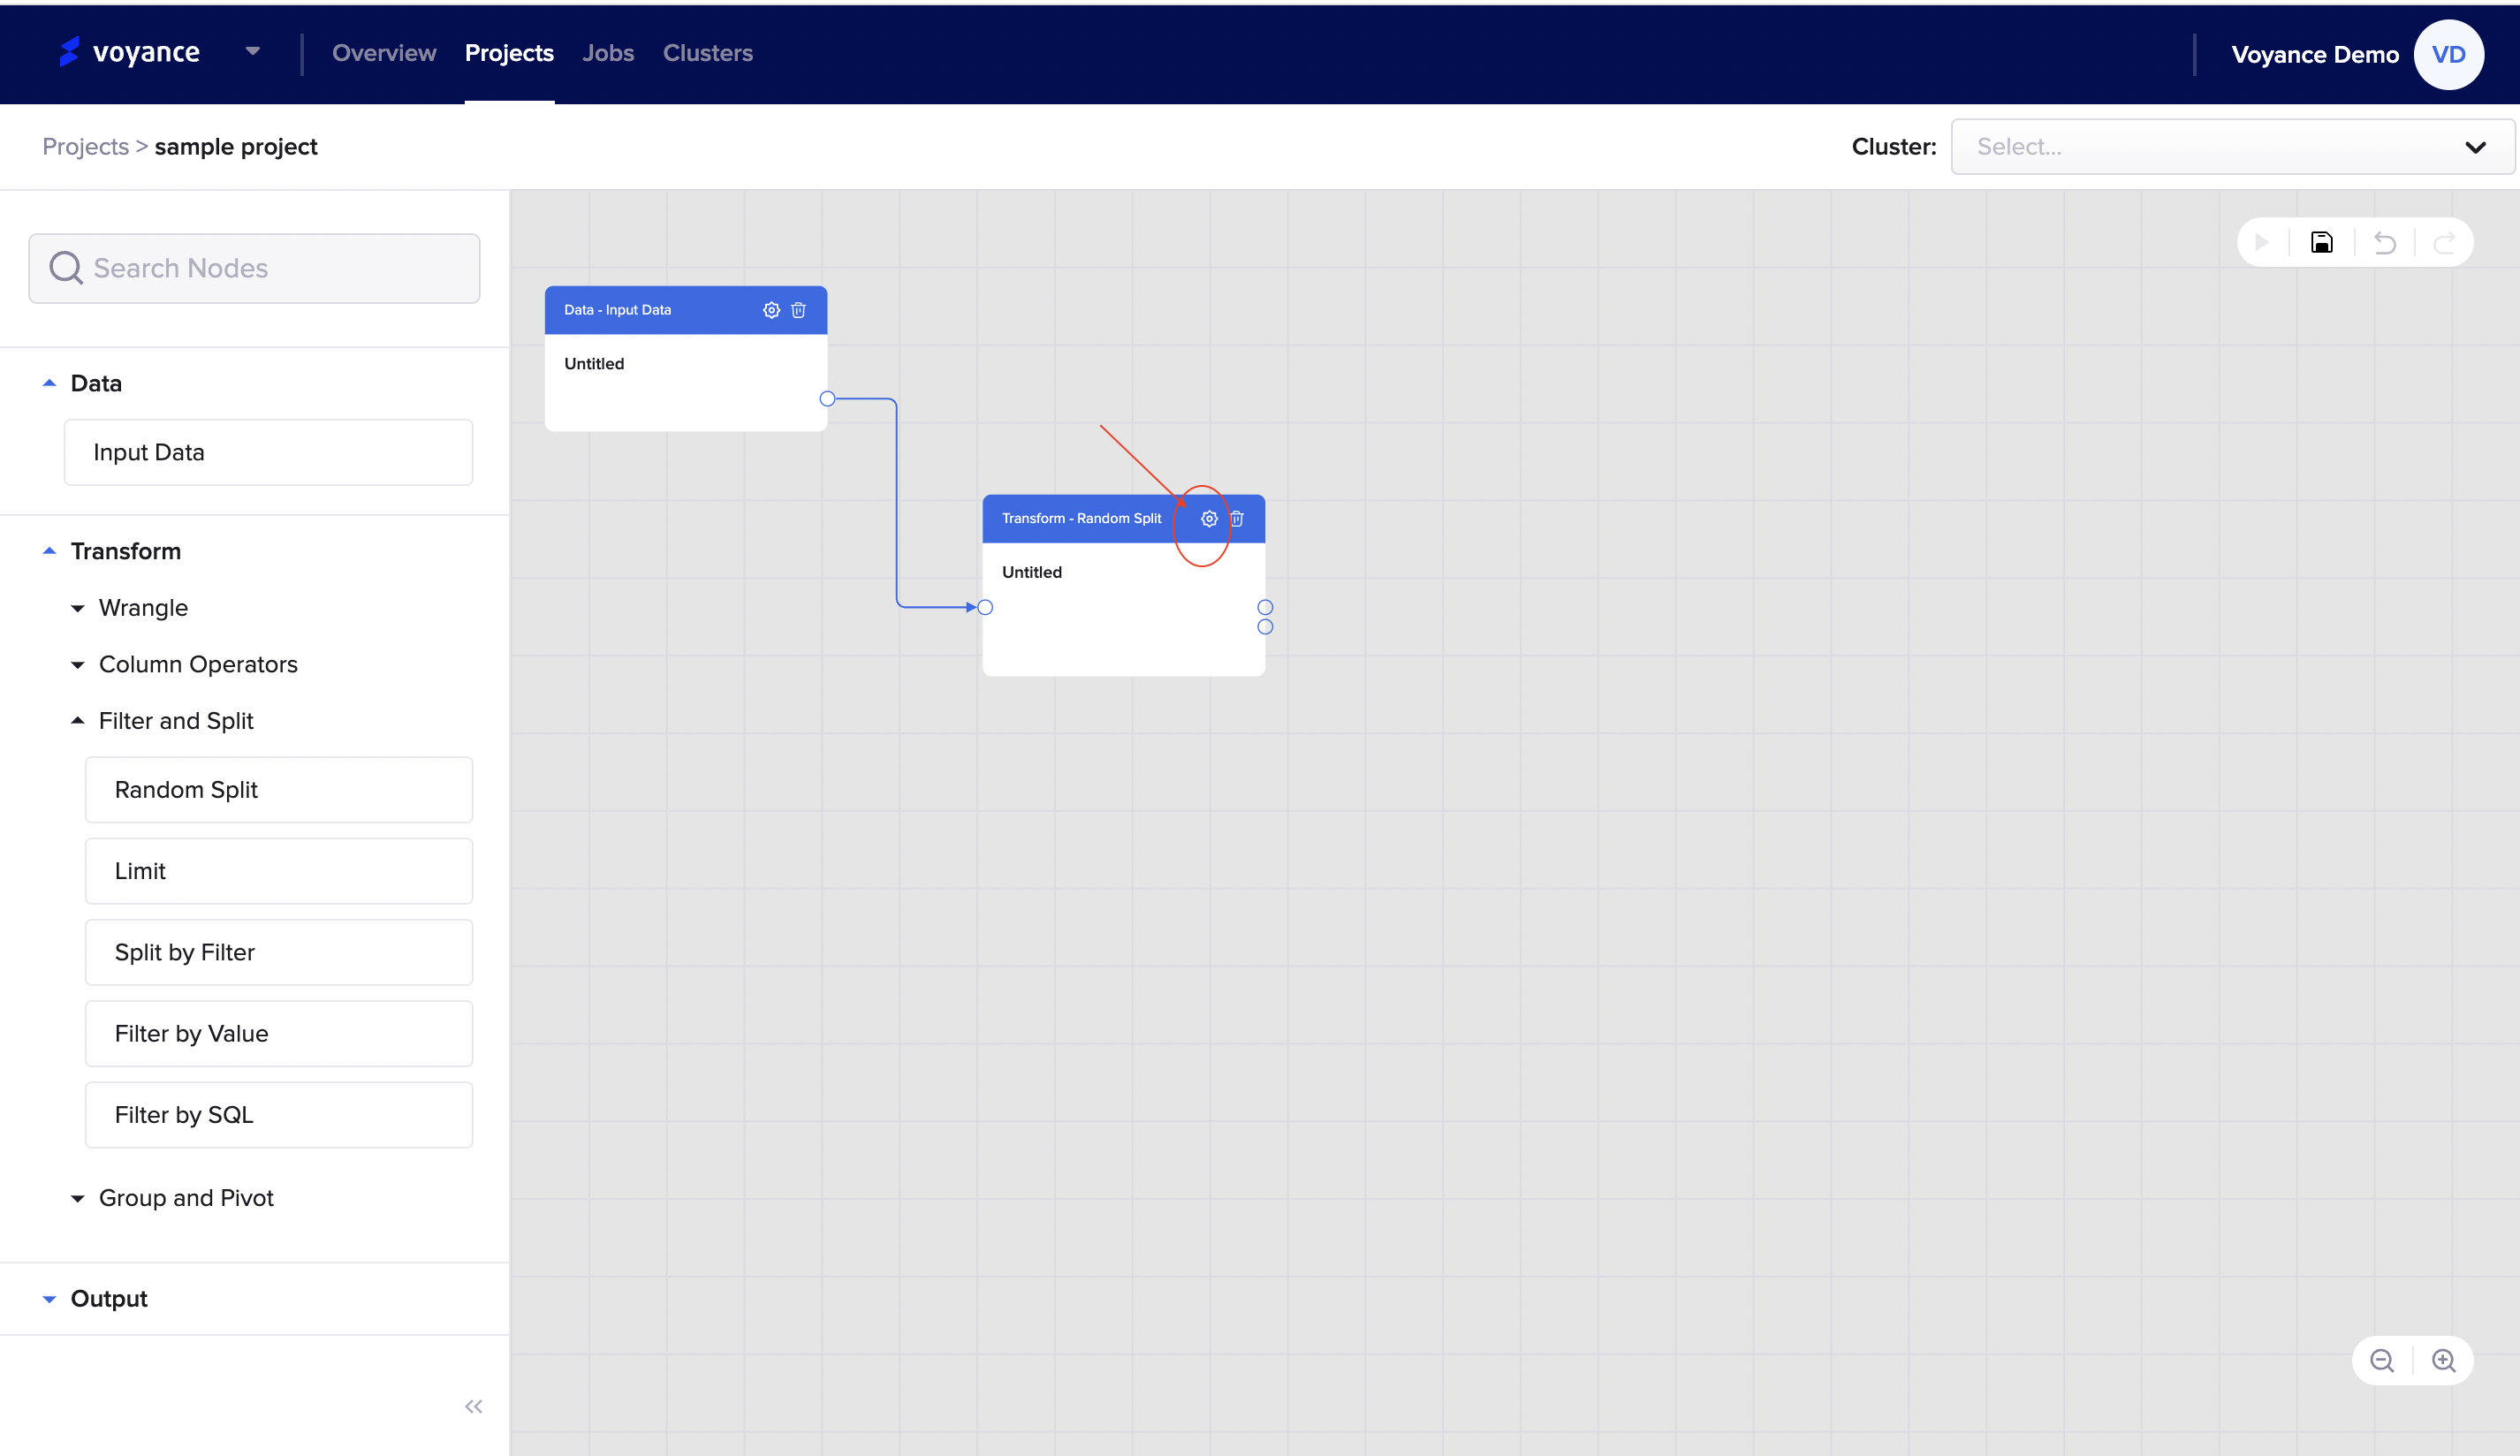
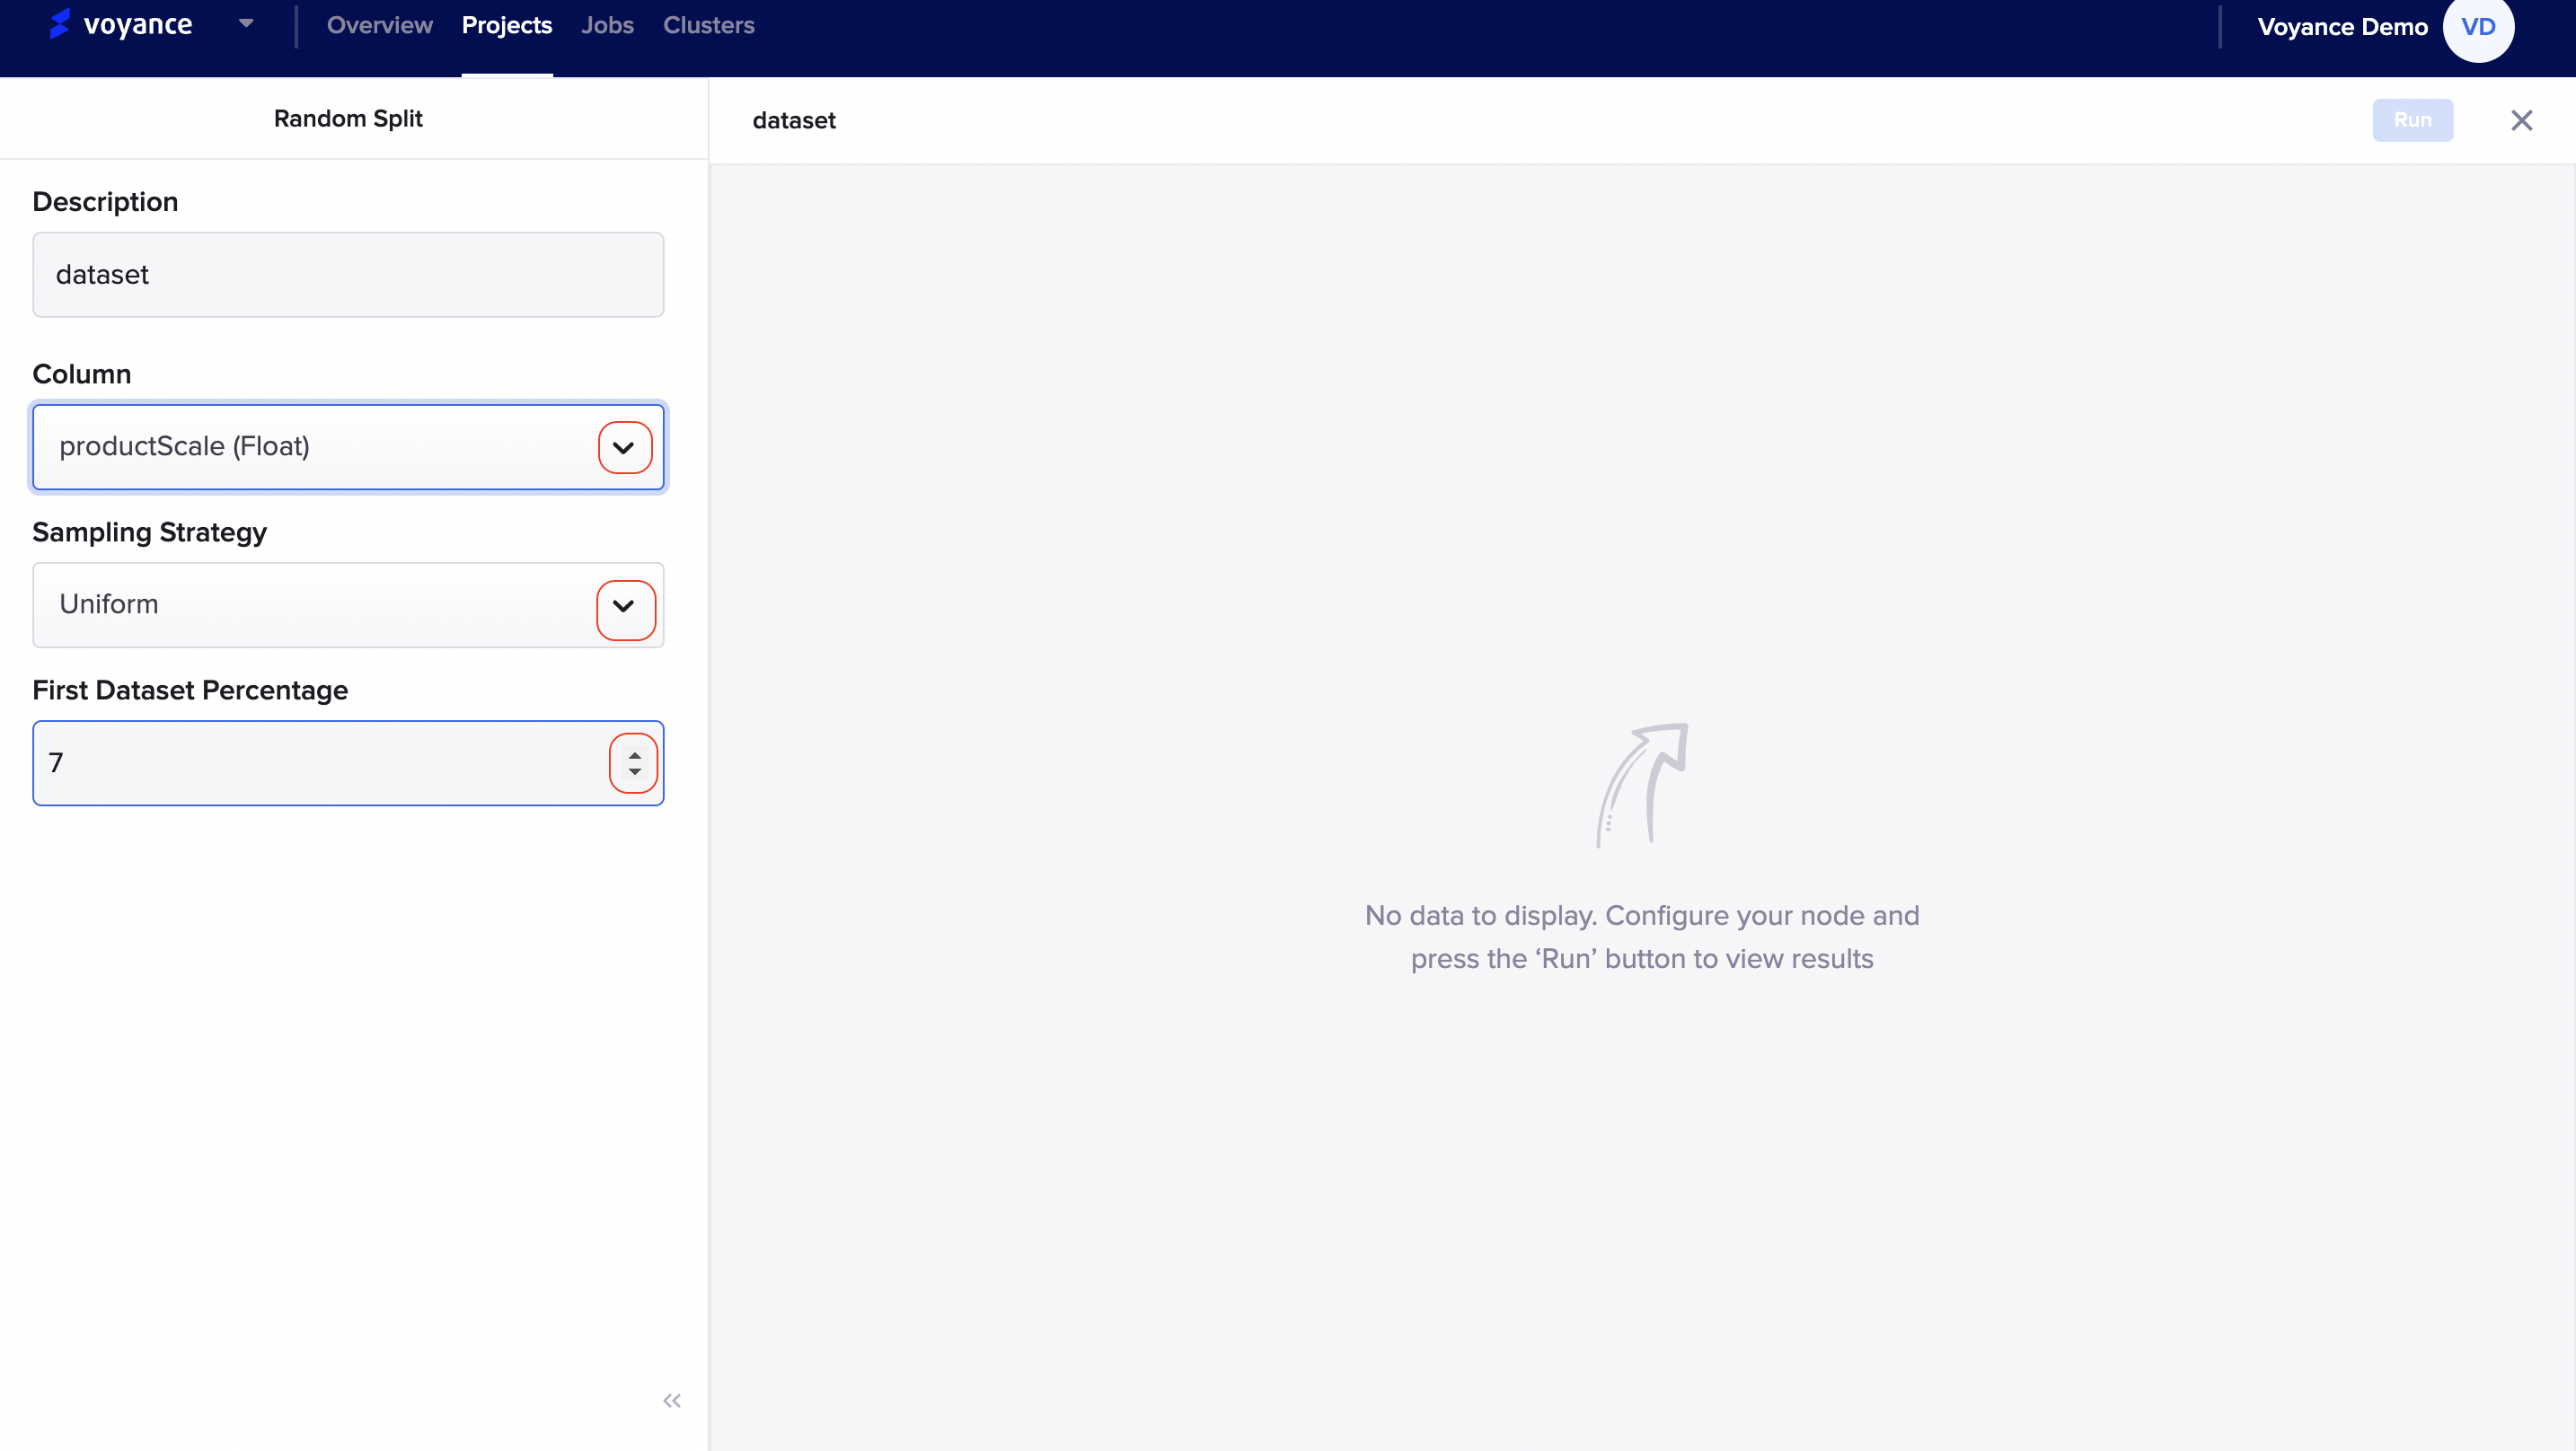
you will be redirected to the dashboard, where you can split your data, so fill in the parameters on the dashboard to perform a random split. The following steps describe the random split tool for your transformation process.
Description: This is by giving a brief statement about the dataset you want to split or either giving it the dialog box name. Once you describe the random split, it appears on the random split dialog box in the project workflow.
Select column: To select a column, click on the drop-down arrow to select a column for your splitting.
Sampling strategy: With our random split transform tool, you can select a sampling strategy for the dataset to ensure that the data sample you use. we have some set of sampling strategies when using our random split, "Uniform", "Stratified", and "Rebalanced" sampling strategy. To select a sampling strategy, click on the drop-down arrow to select a sampling strategy.
First dataset percentage: You can select your first dataset percentage by clicking on the up and down drop-down arrow percentage to select a percentage. The drop-down arrow pointing up is indicating a positive percentage and the drop-down arrow pointing down is indicating the negative set of percentages.
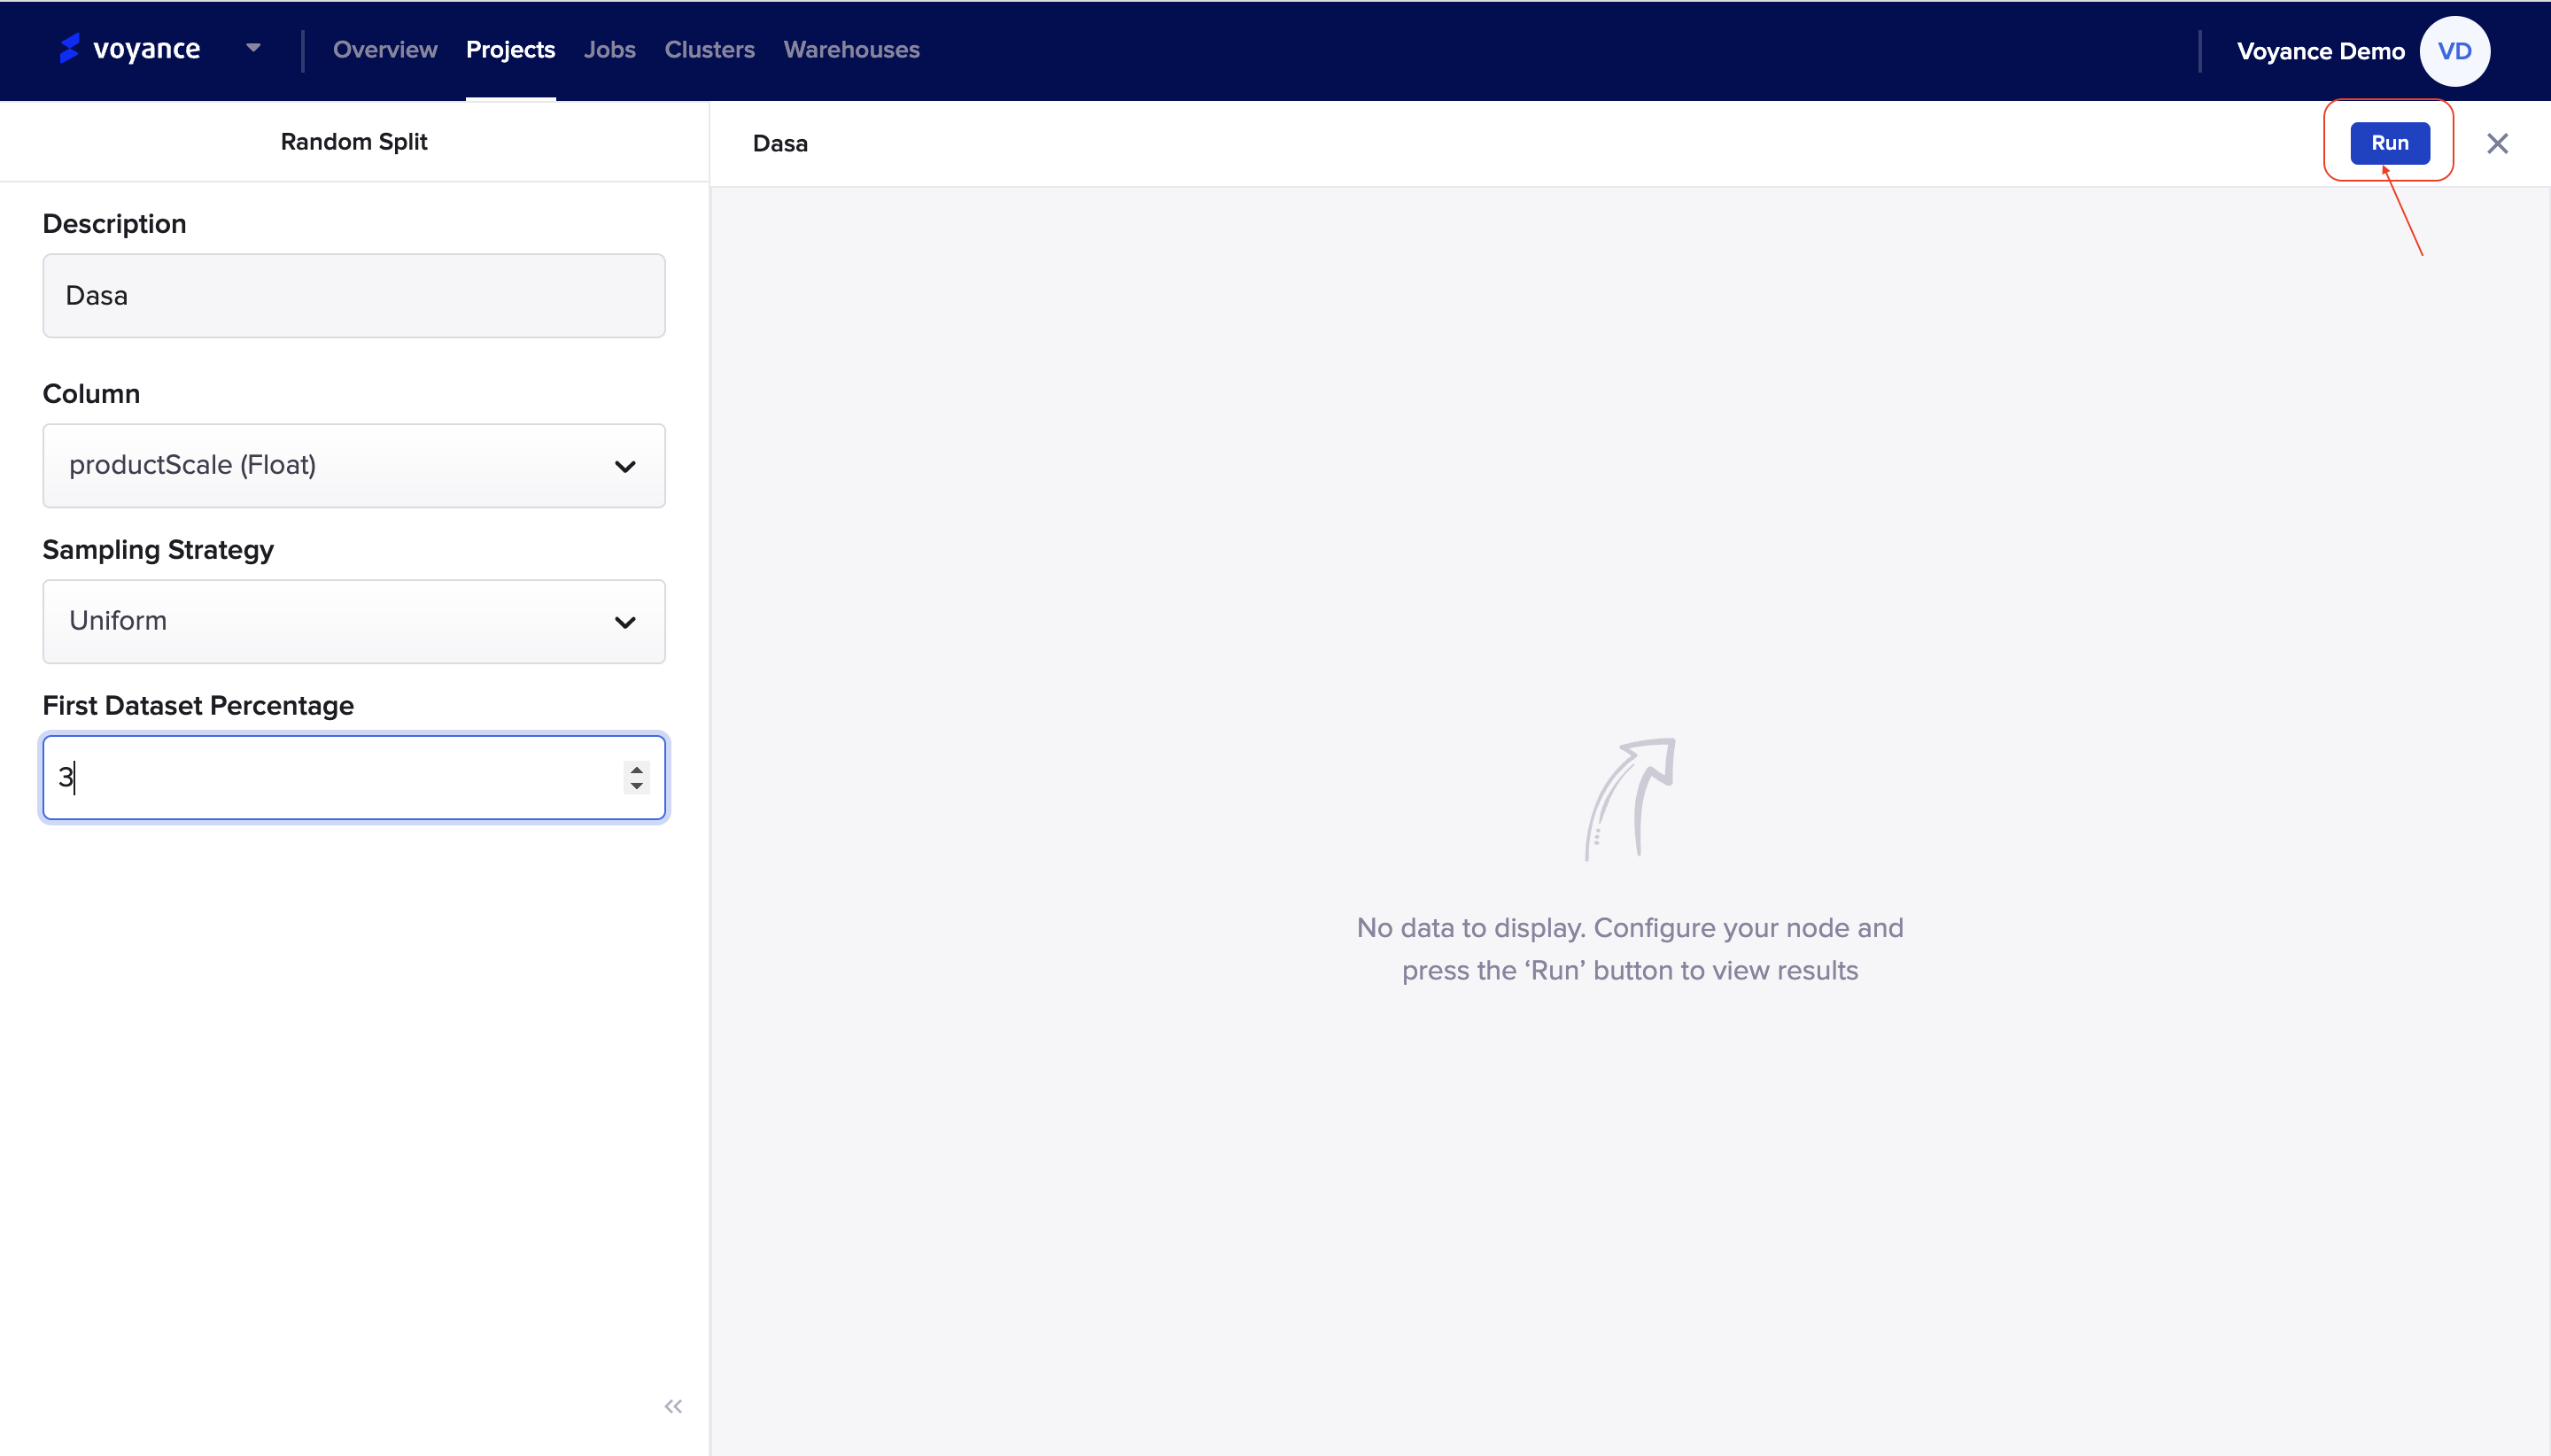
Run program
To preview your data, click on the "Run" tab at the top-right of the page to analyze and view the result of the data configuration.
Limit
Limit is a tool under the filter and split feature which you can use to transform your data. To limit is to restrain the number of records in the output for the entire dataset or per partition or group within the data set.
To use the limit tool, click and drag the "limit tool" to the project workflow, it displays a dialog box on the workflow that allows you to be able to edit for you to apply the tool to your data.
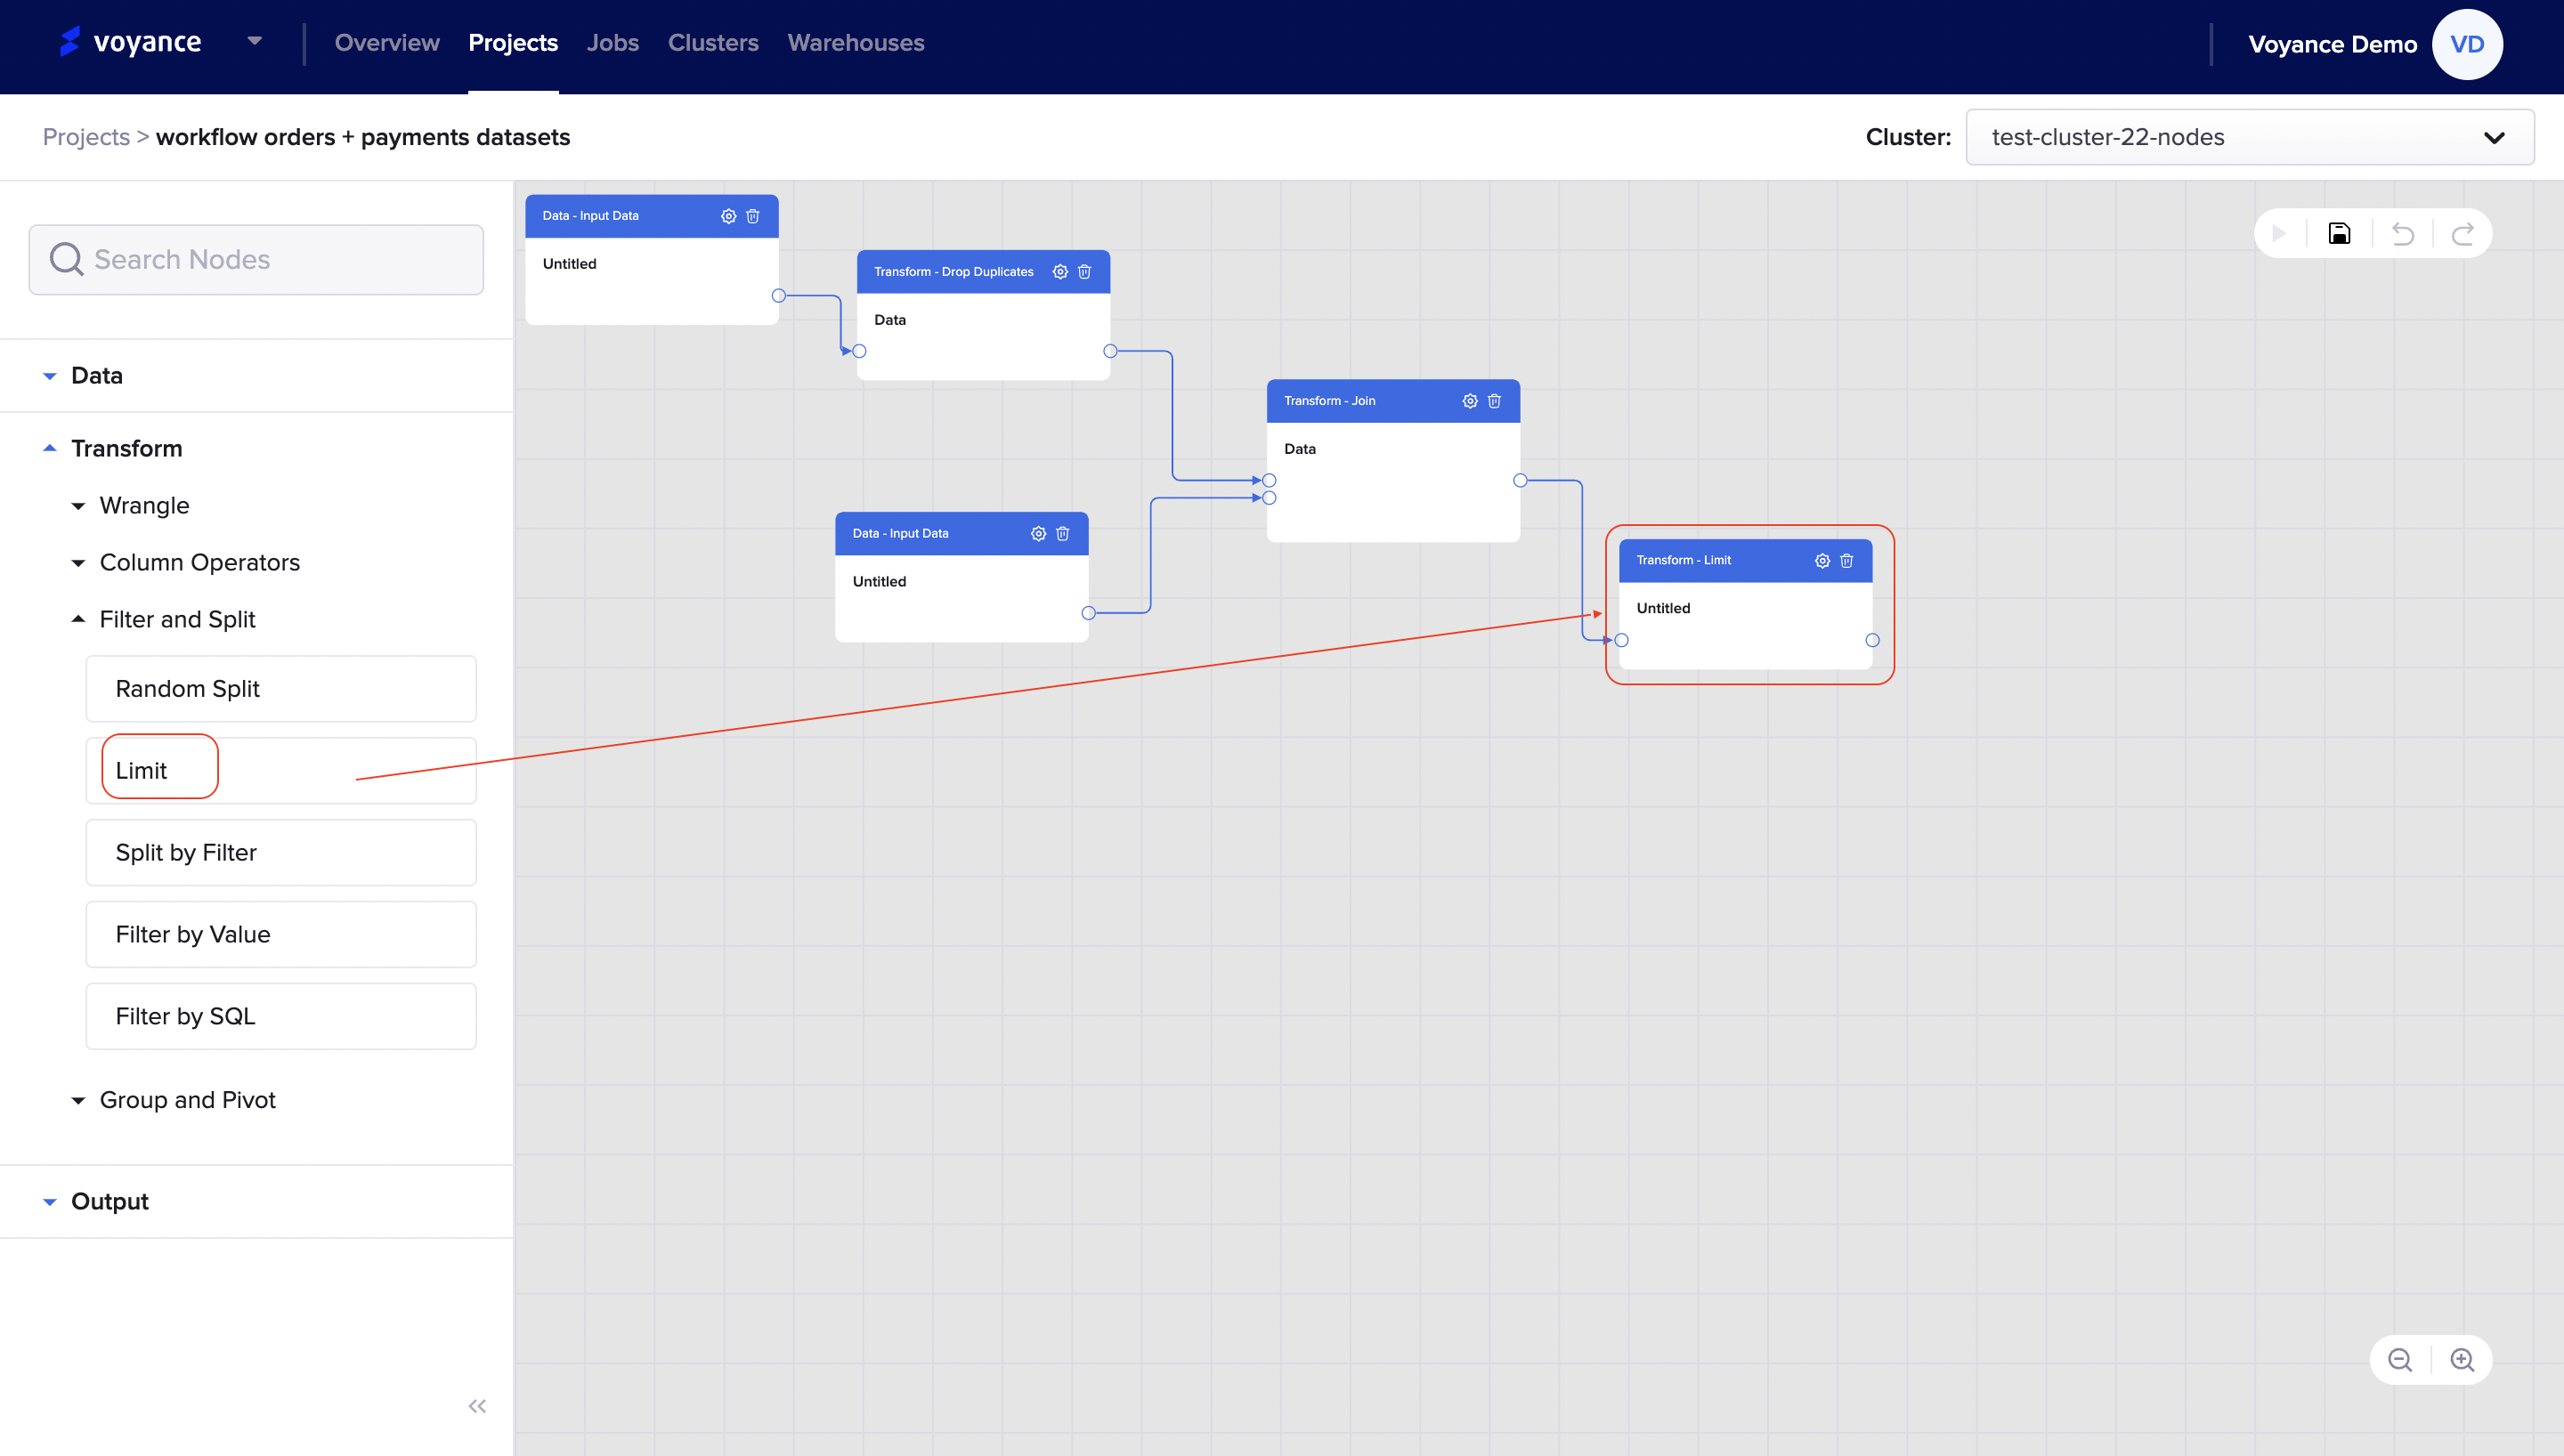
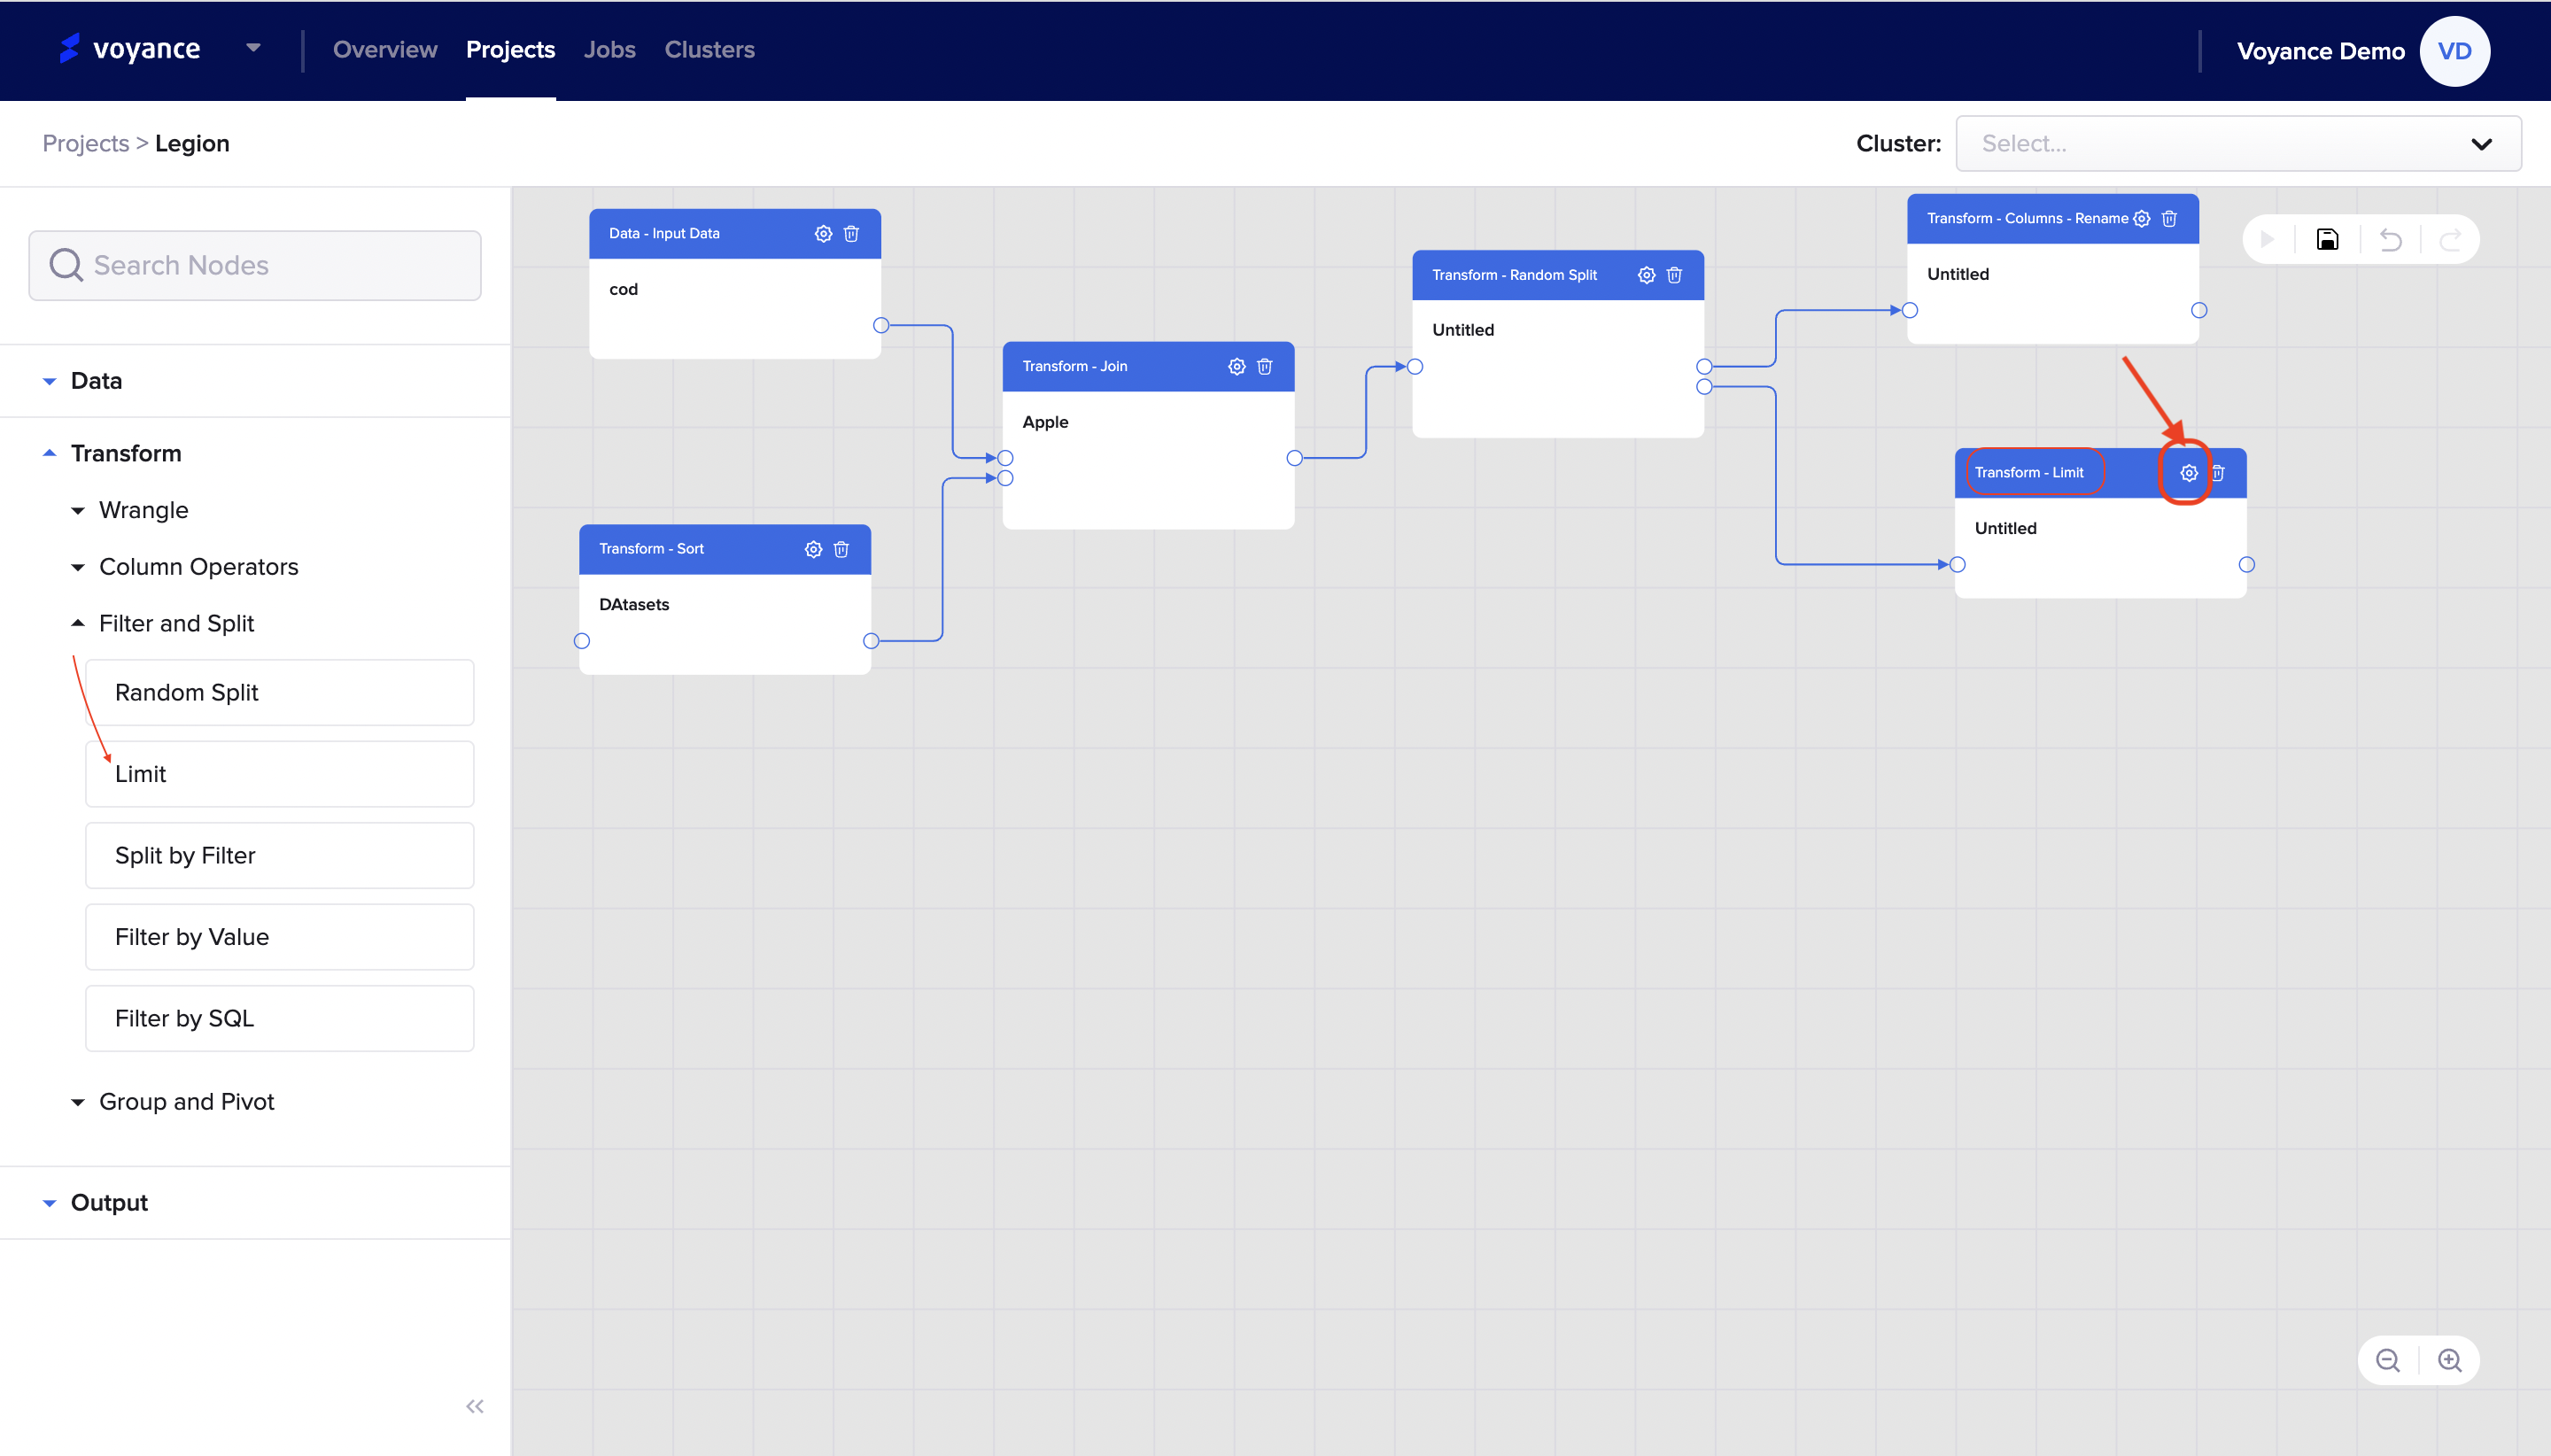
Limit Editor
To edit your Limit tool in your workflow, click on the "settings icon" at the top-right of the limit dialog box on the workflow.
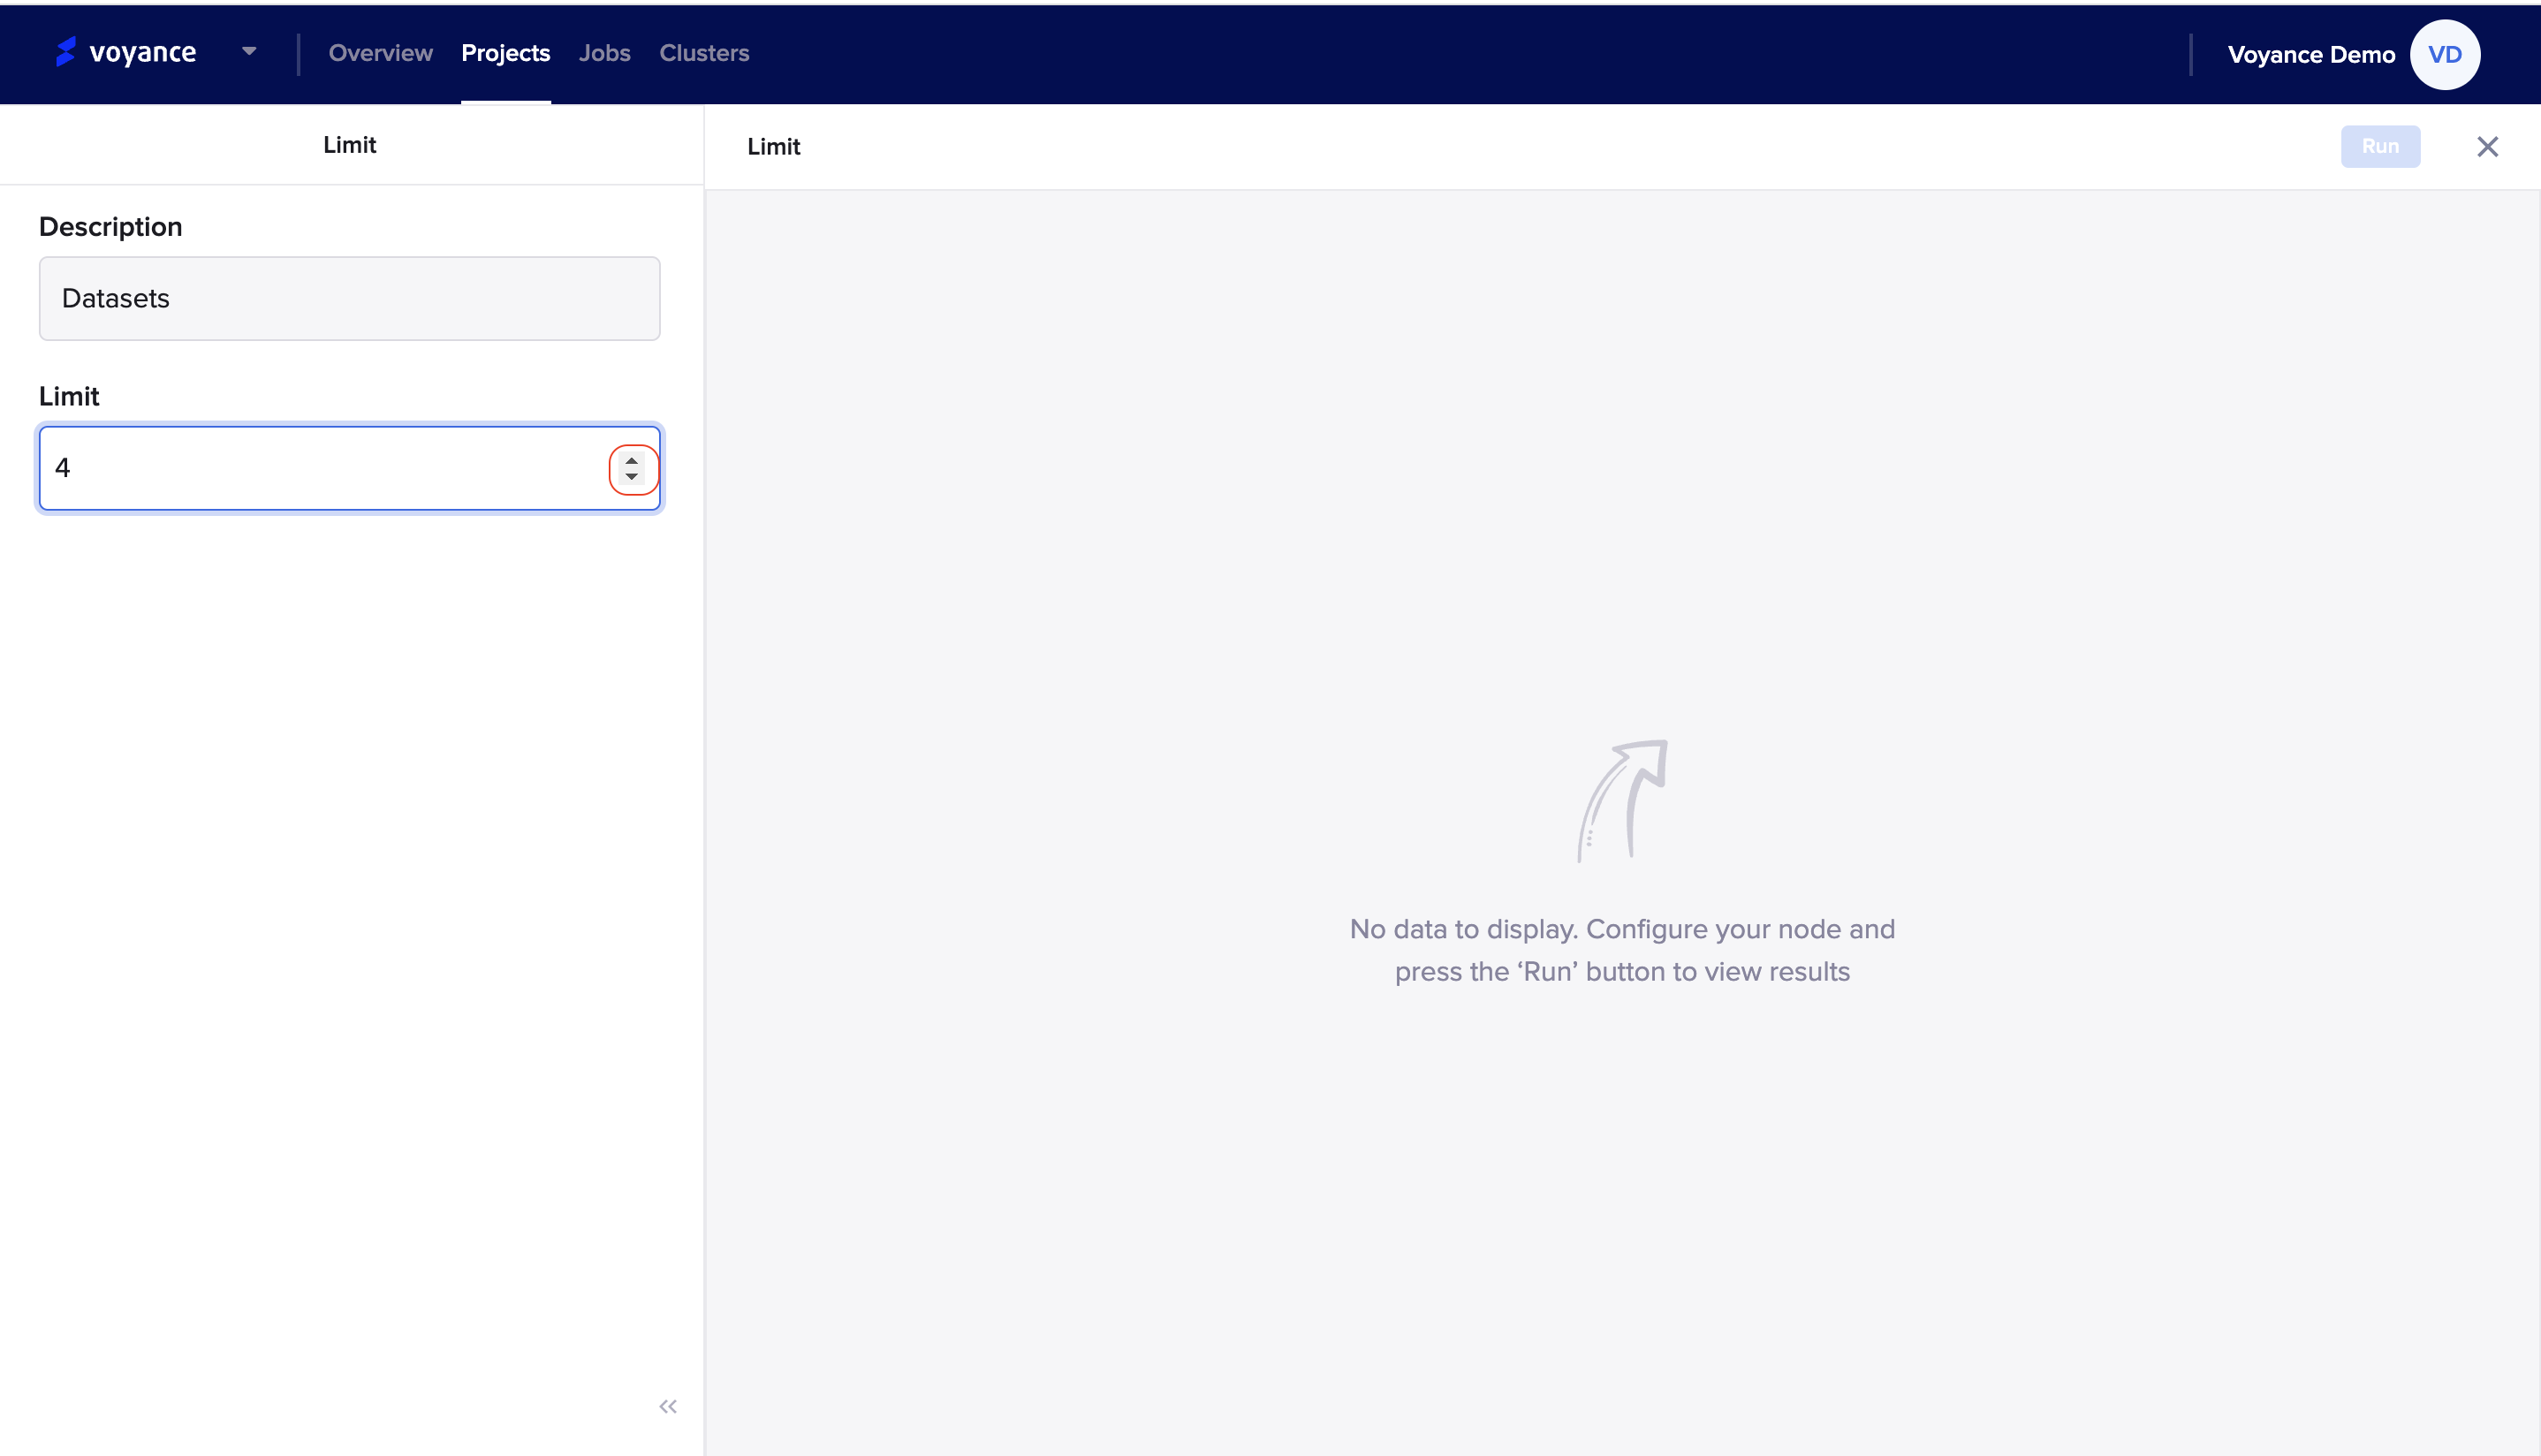
you will be redirected to the Limit dashboard where you will fill in the parameters displayed on the dashboard that enables you to limit the number of records in the output for the entire dataset.
The following steps describe how to limit your records:
Description: Give a brief statement about the dashboard to be able to identify the dialog box. the statement or name will appear on the limit dialog box on the workflow.
Limit: To limit your data, click on the up and down drop-down arrow to identify your limit. The drop-down arrow pointing up gives you a positive limit number and the drop-down arrow pointing down displays you a negative limit number
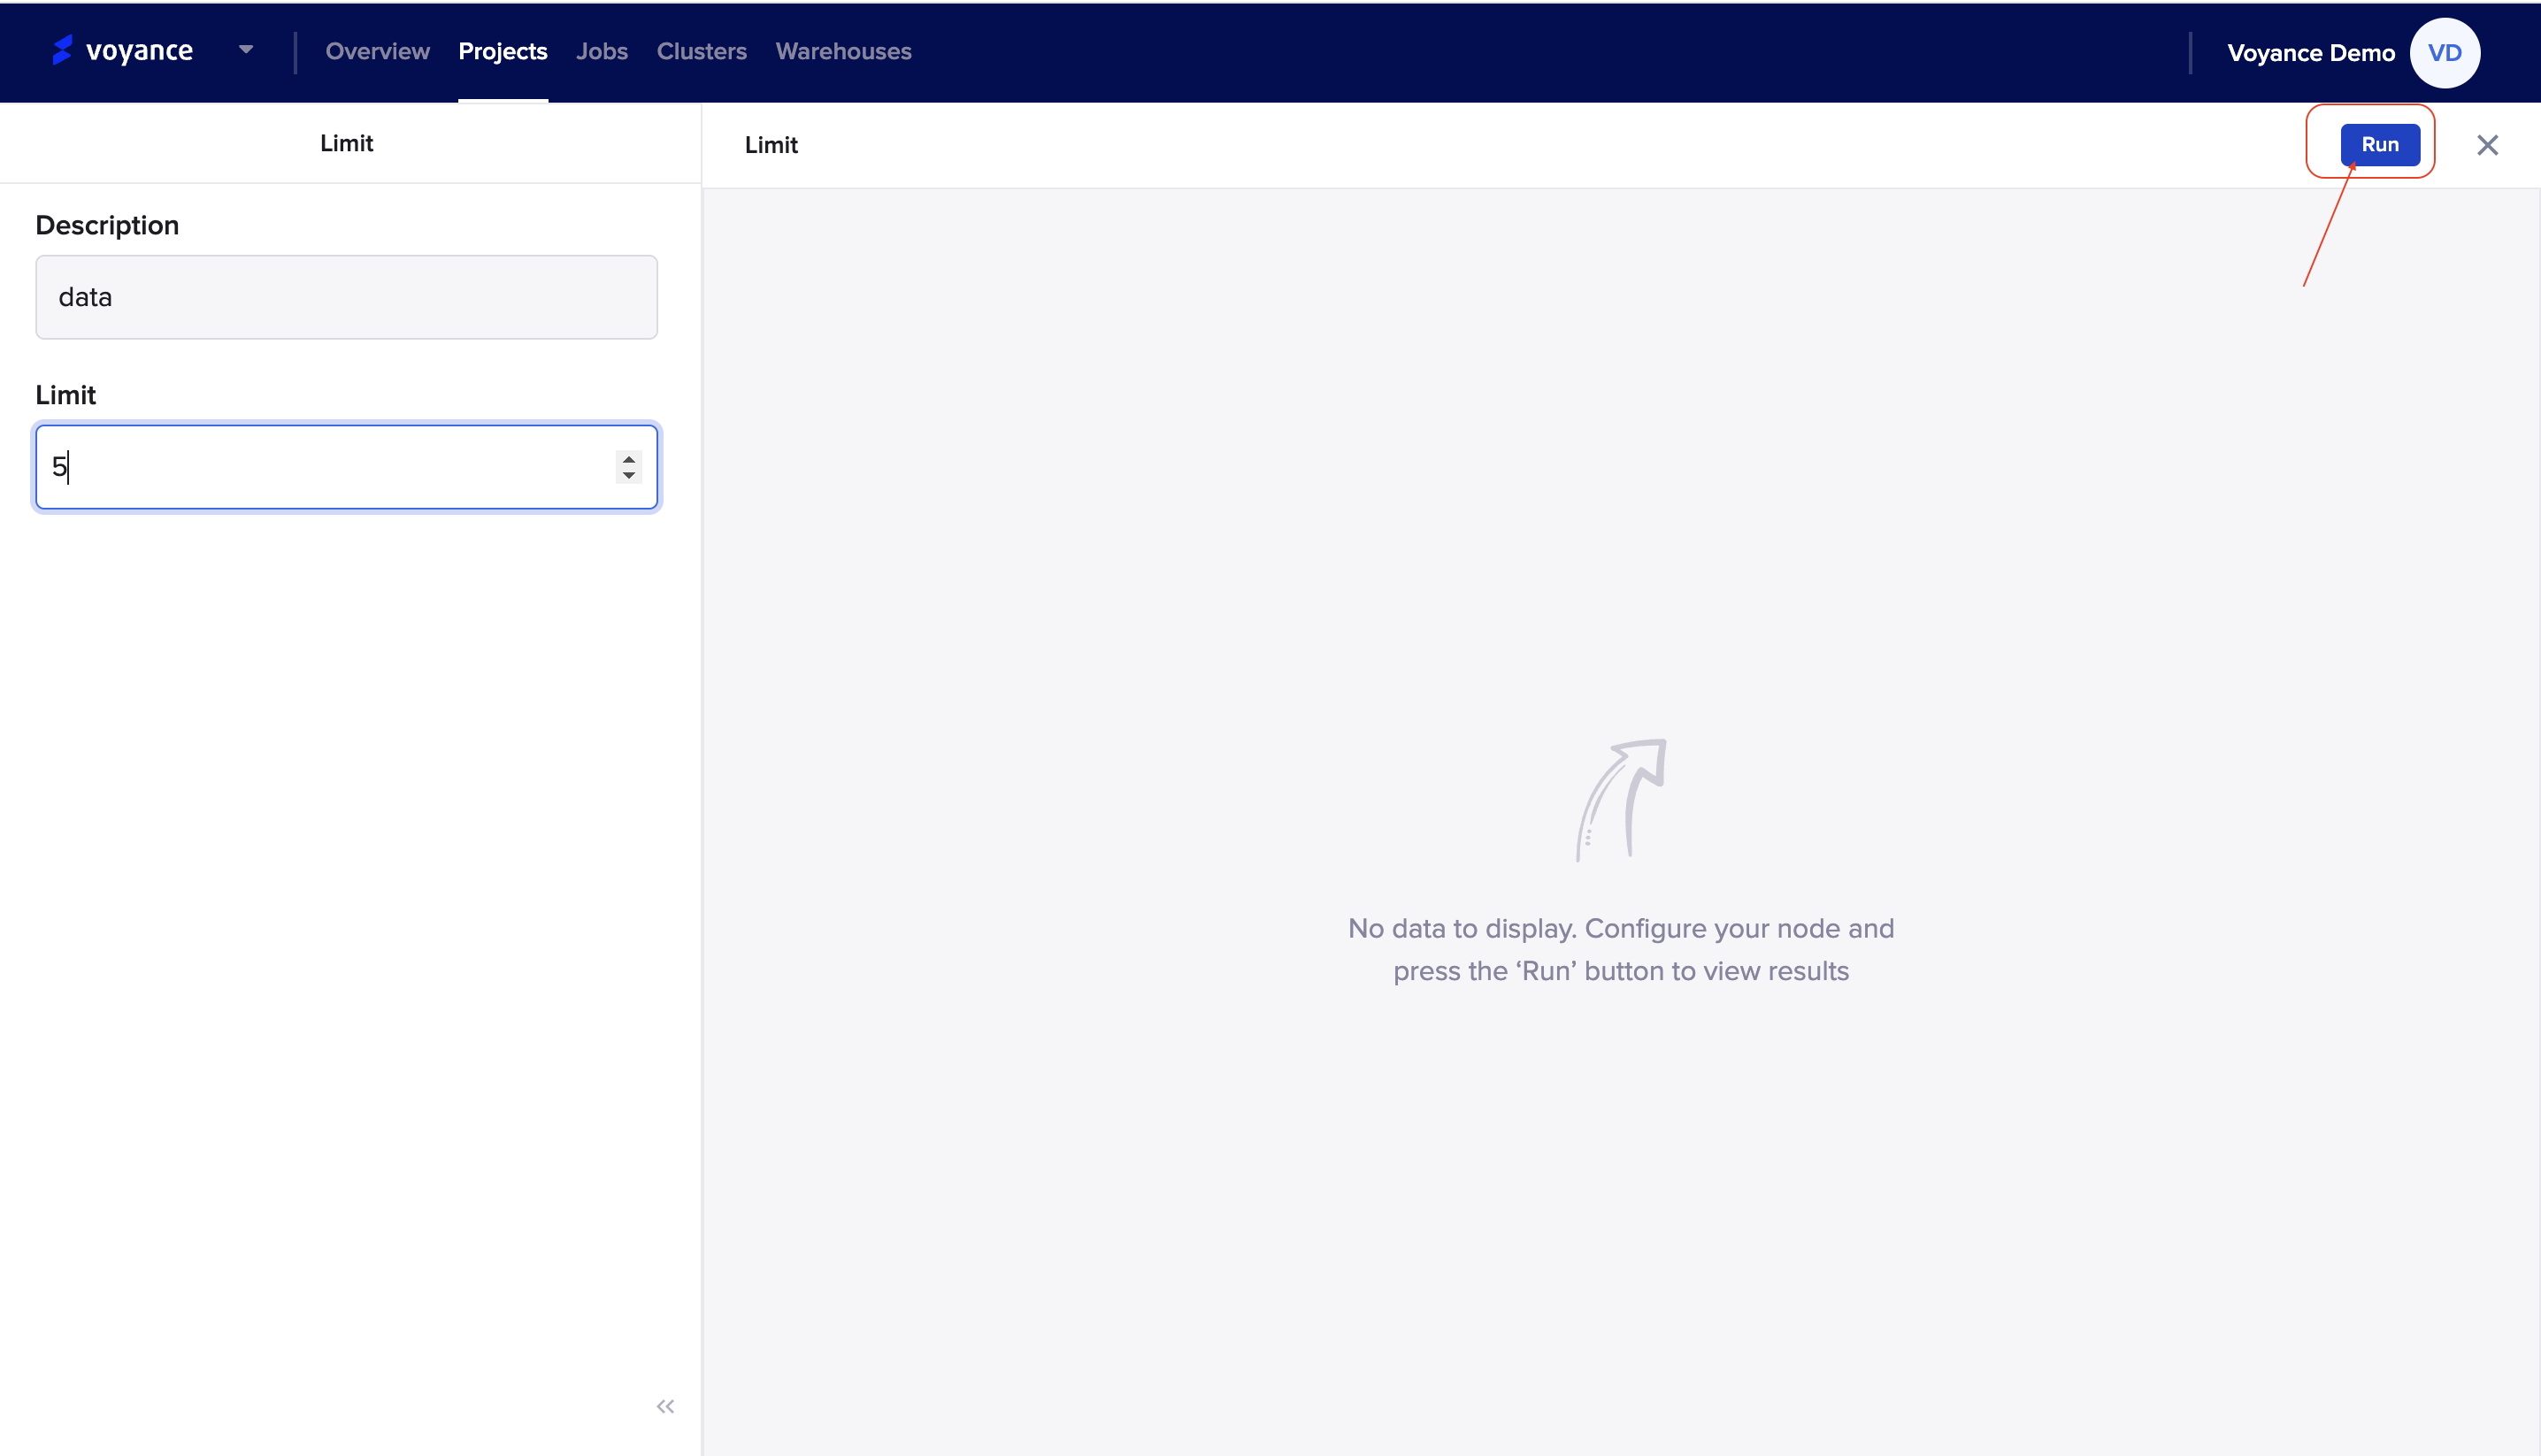
Run program
To preview your data to view the result of your nodes, click on the "Run" at the top-right of the page to view the result of the configuration.
Split by Filter
To split your data by filtering, you need to click and drag the "split by filter" tool under the split and filter transformation feature to the workflow.
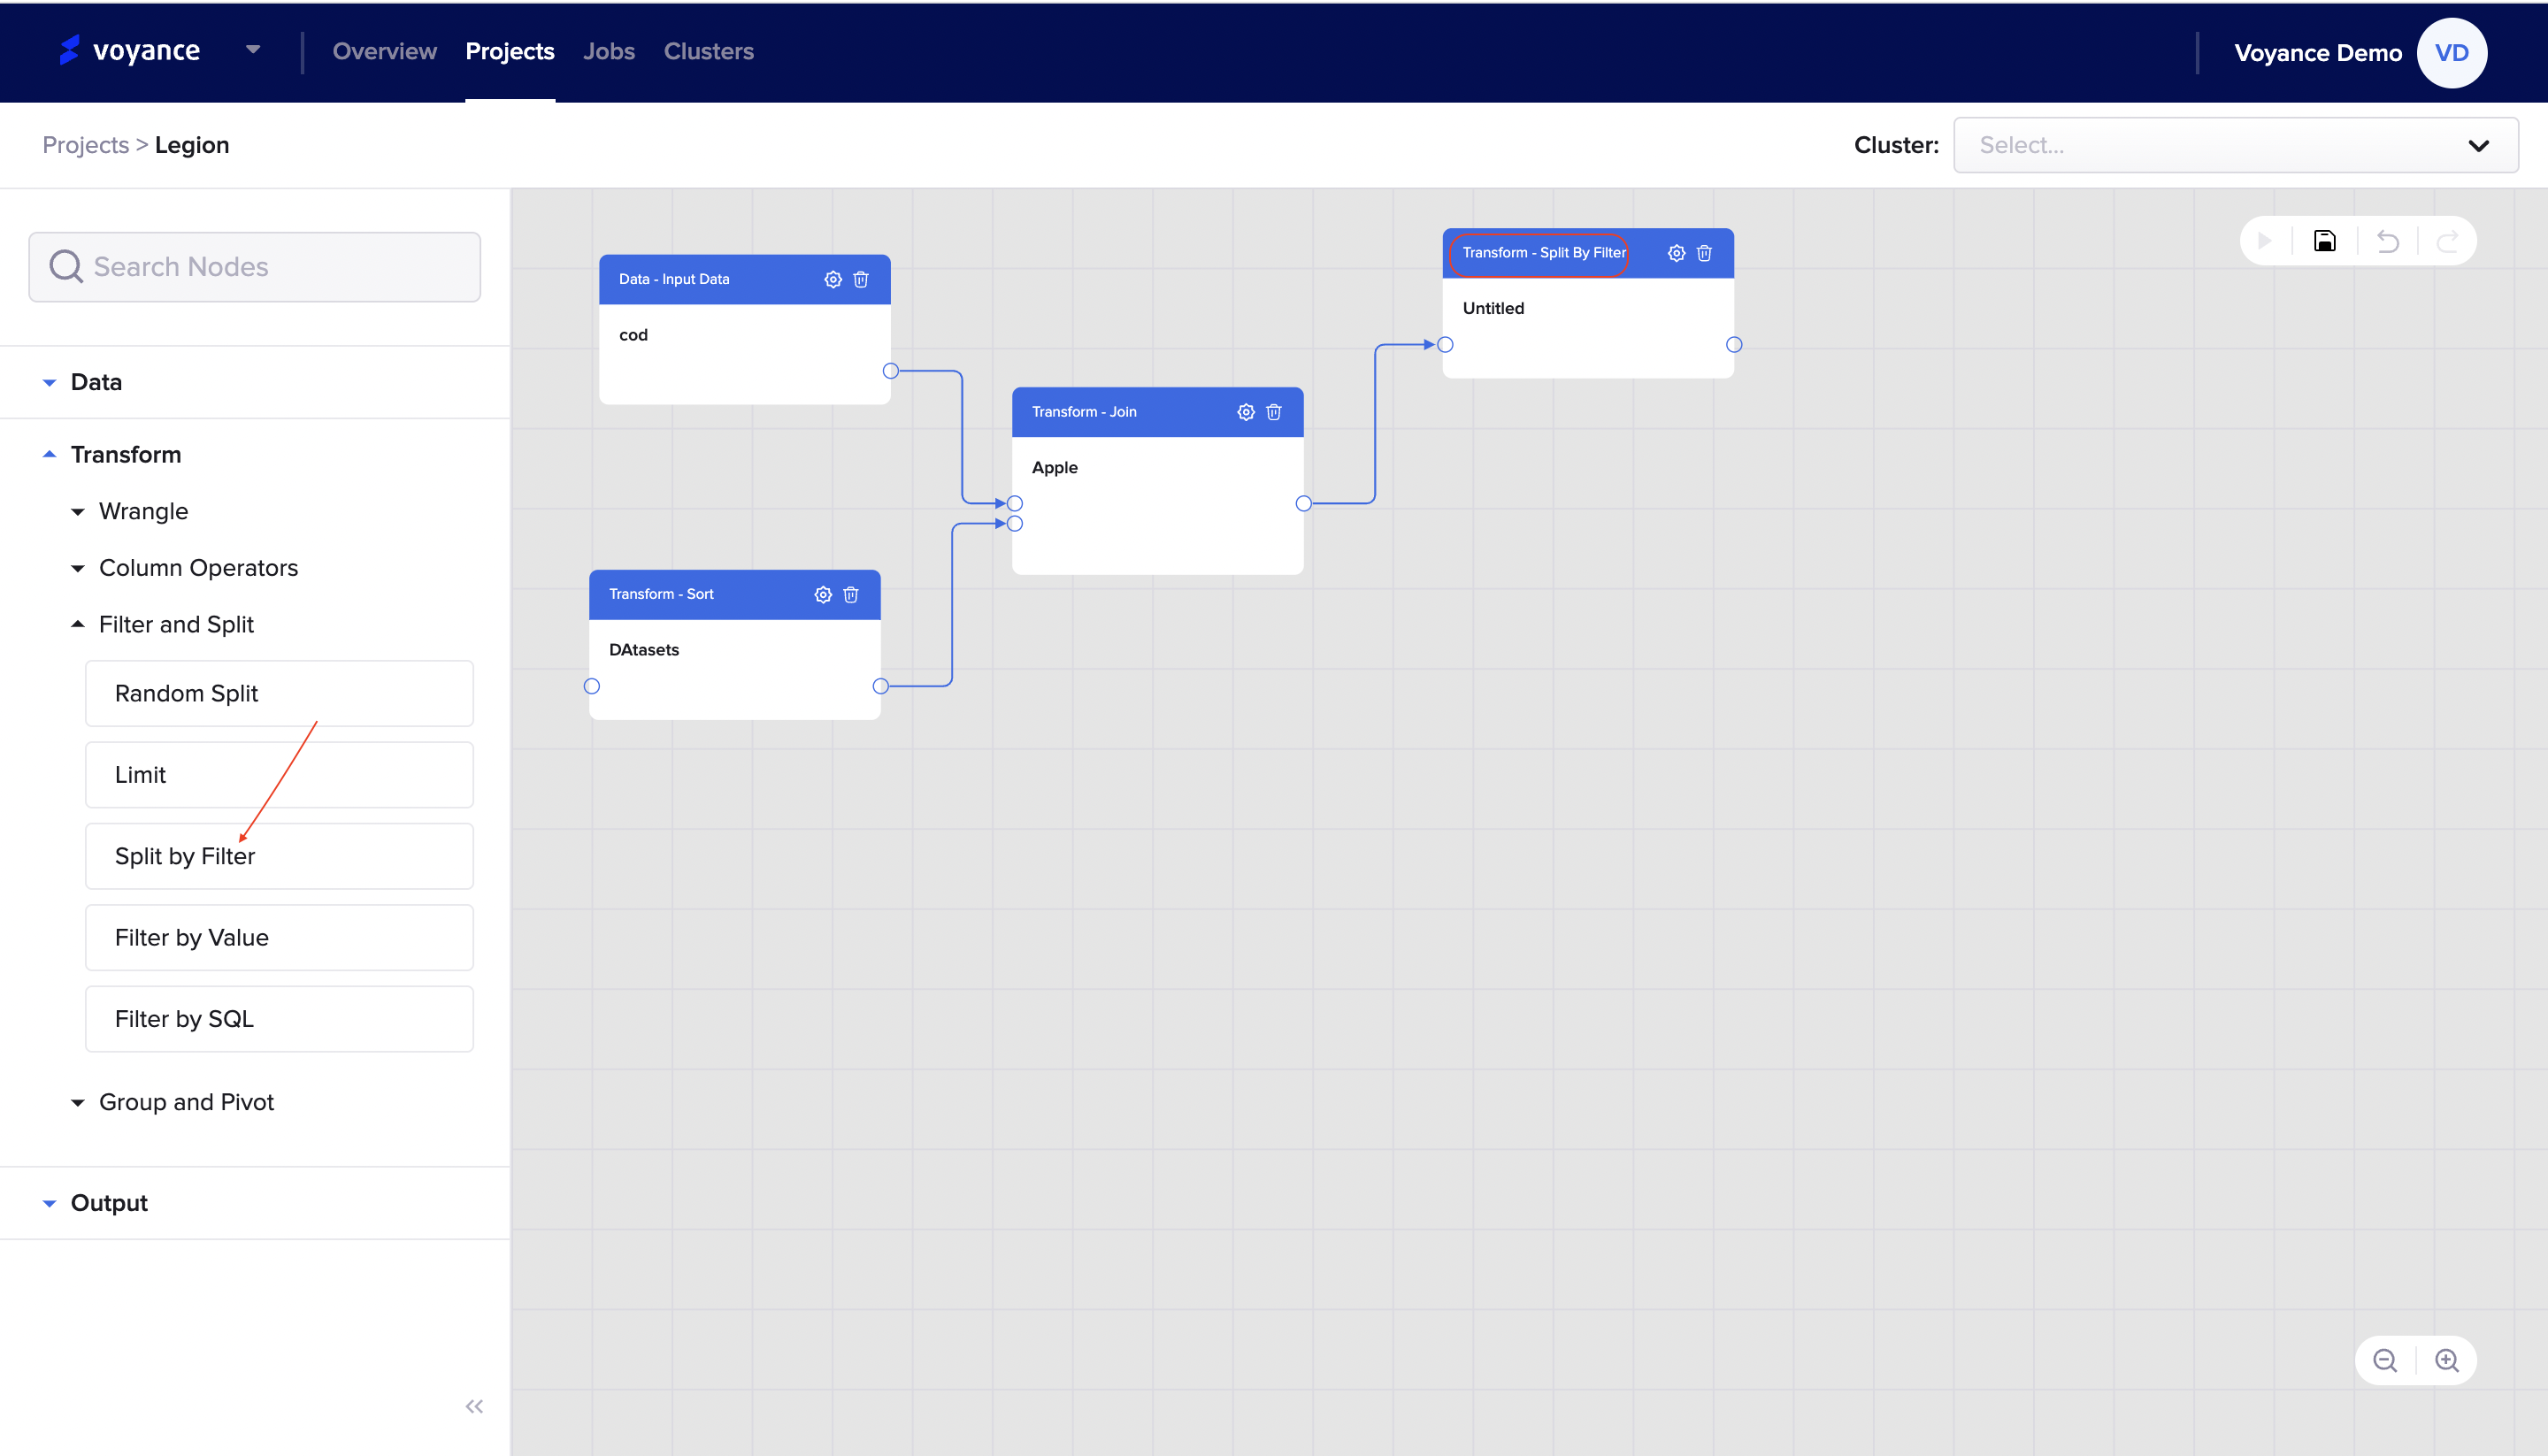
Split by Filter Editor
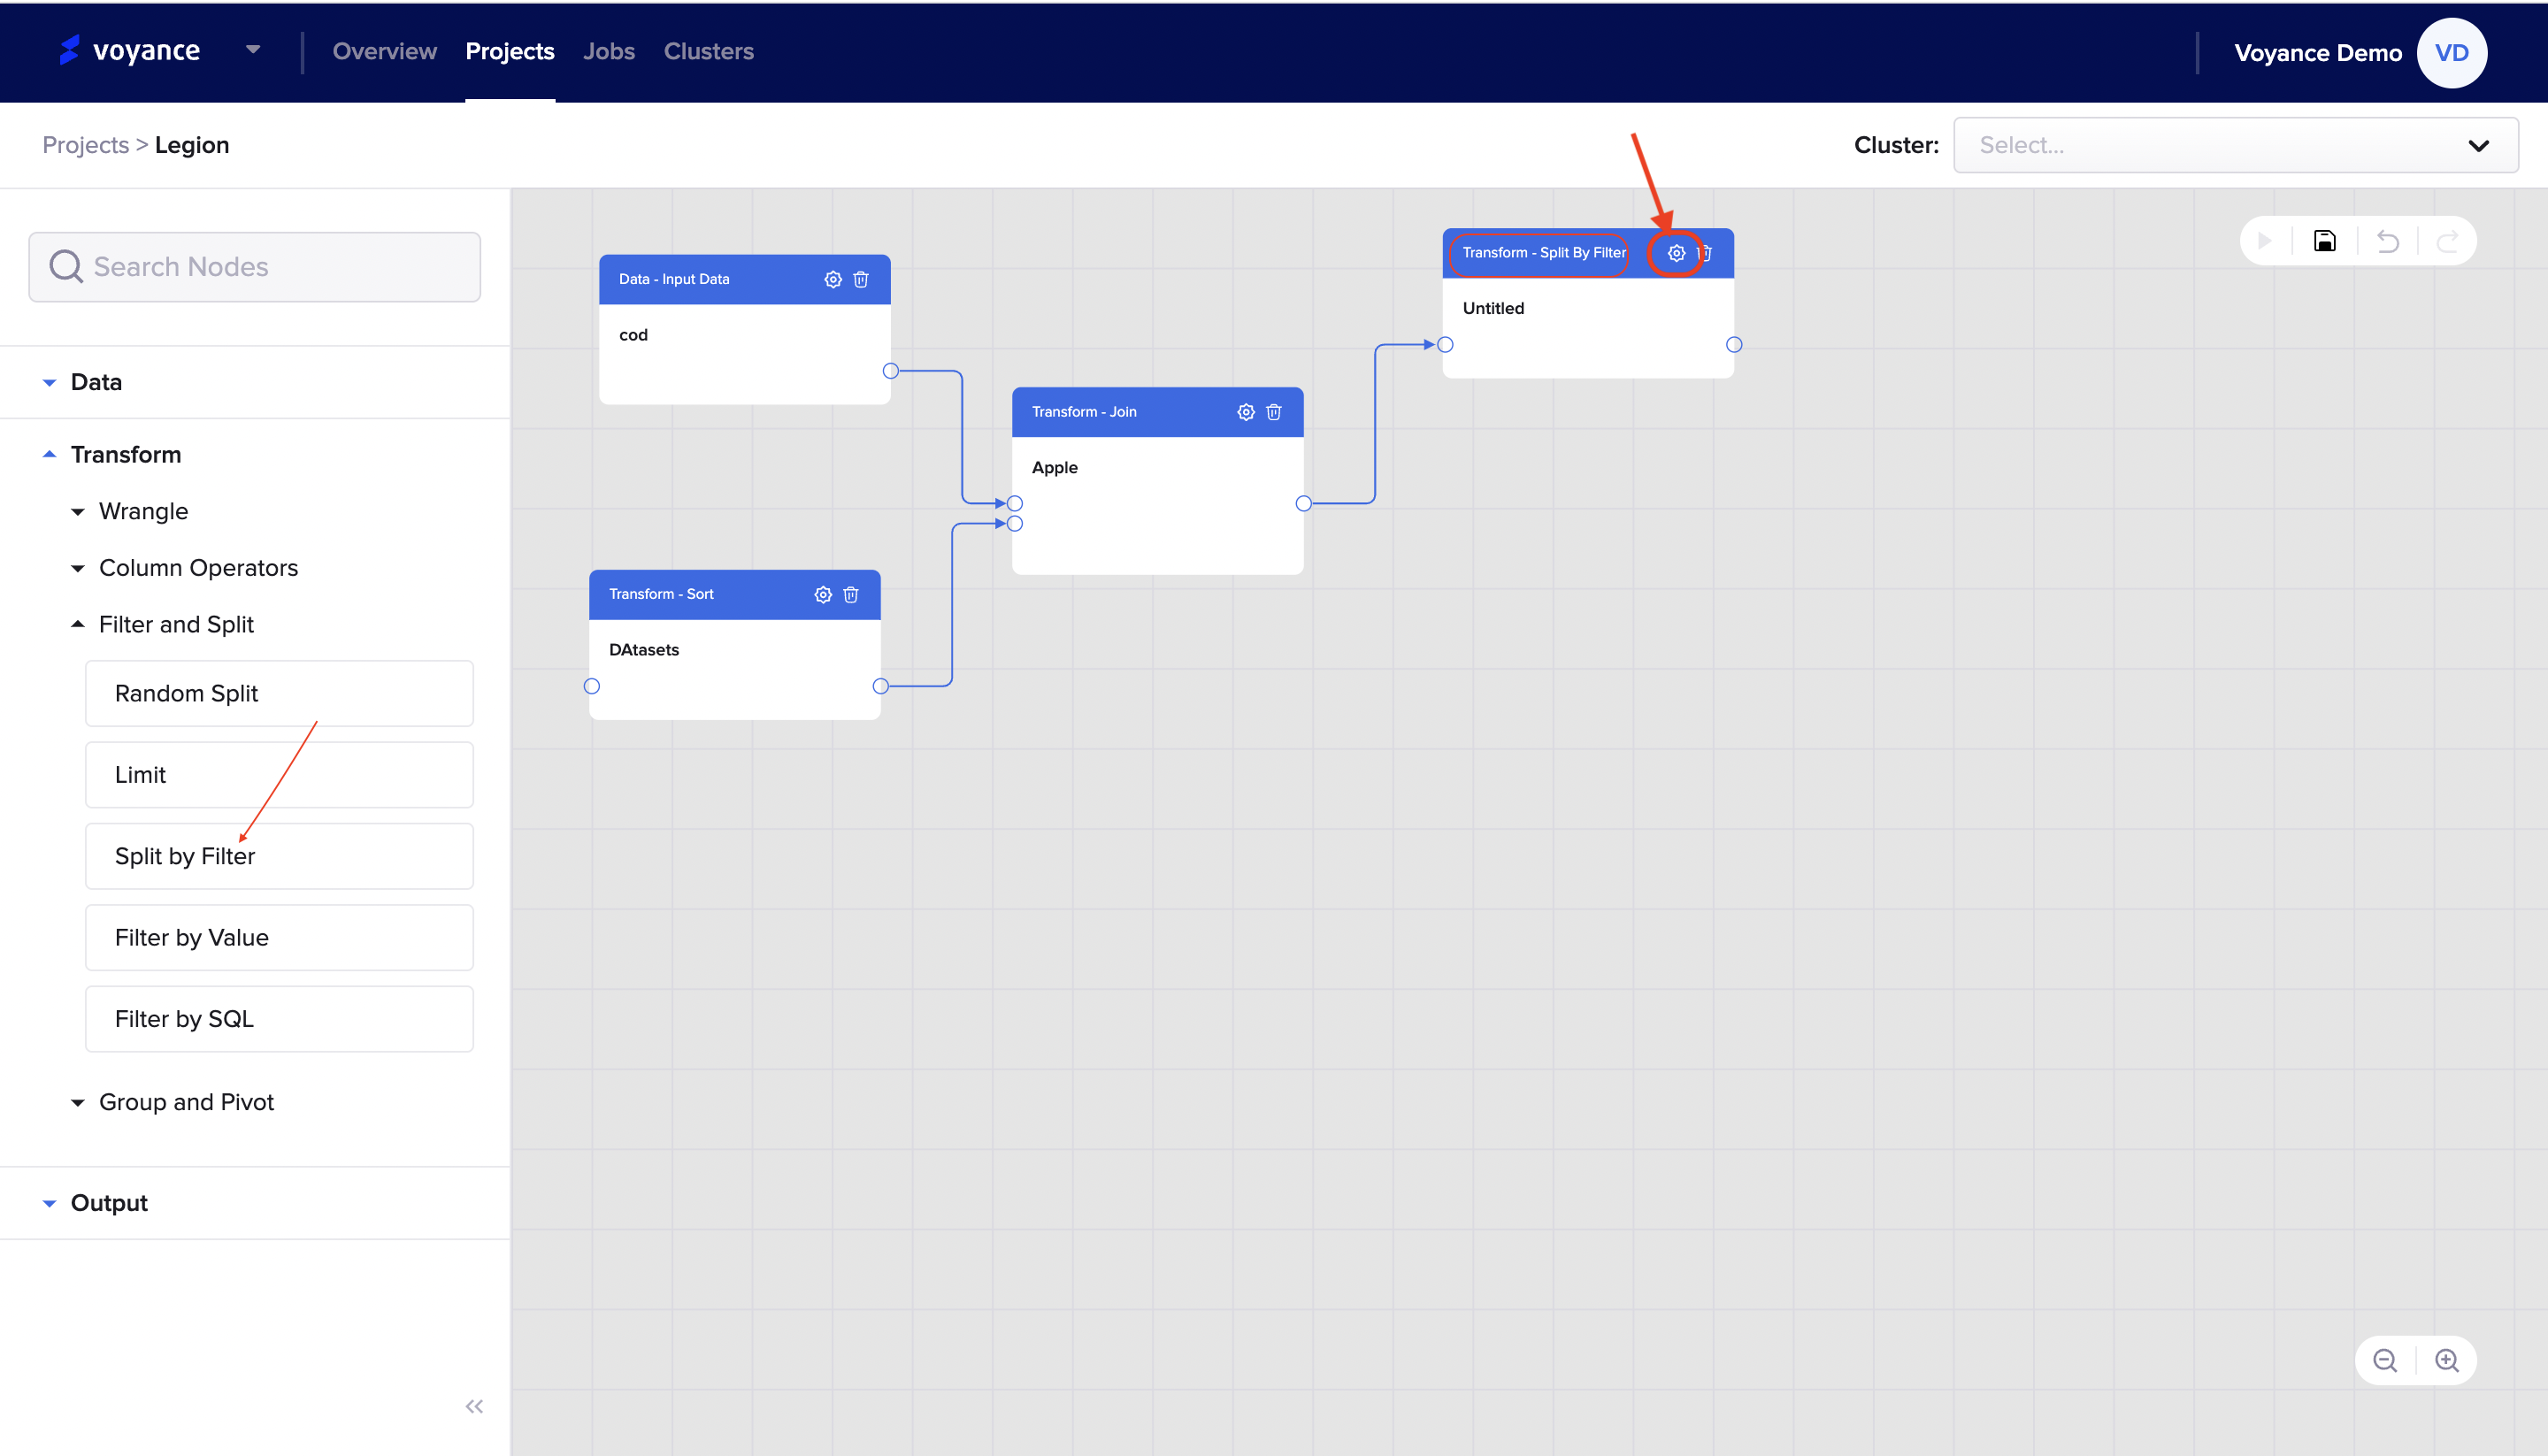
To edit your split by filter tool, you need to click on the "Setting icon" at the top of the split by filter dialog box on the workflow.
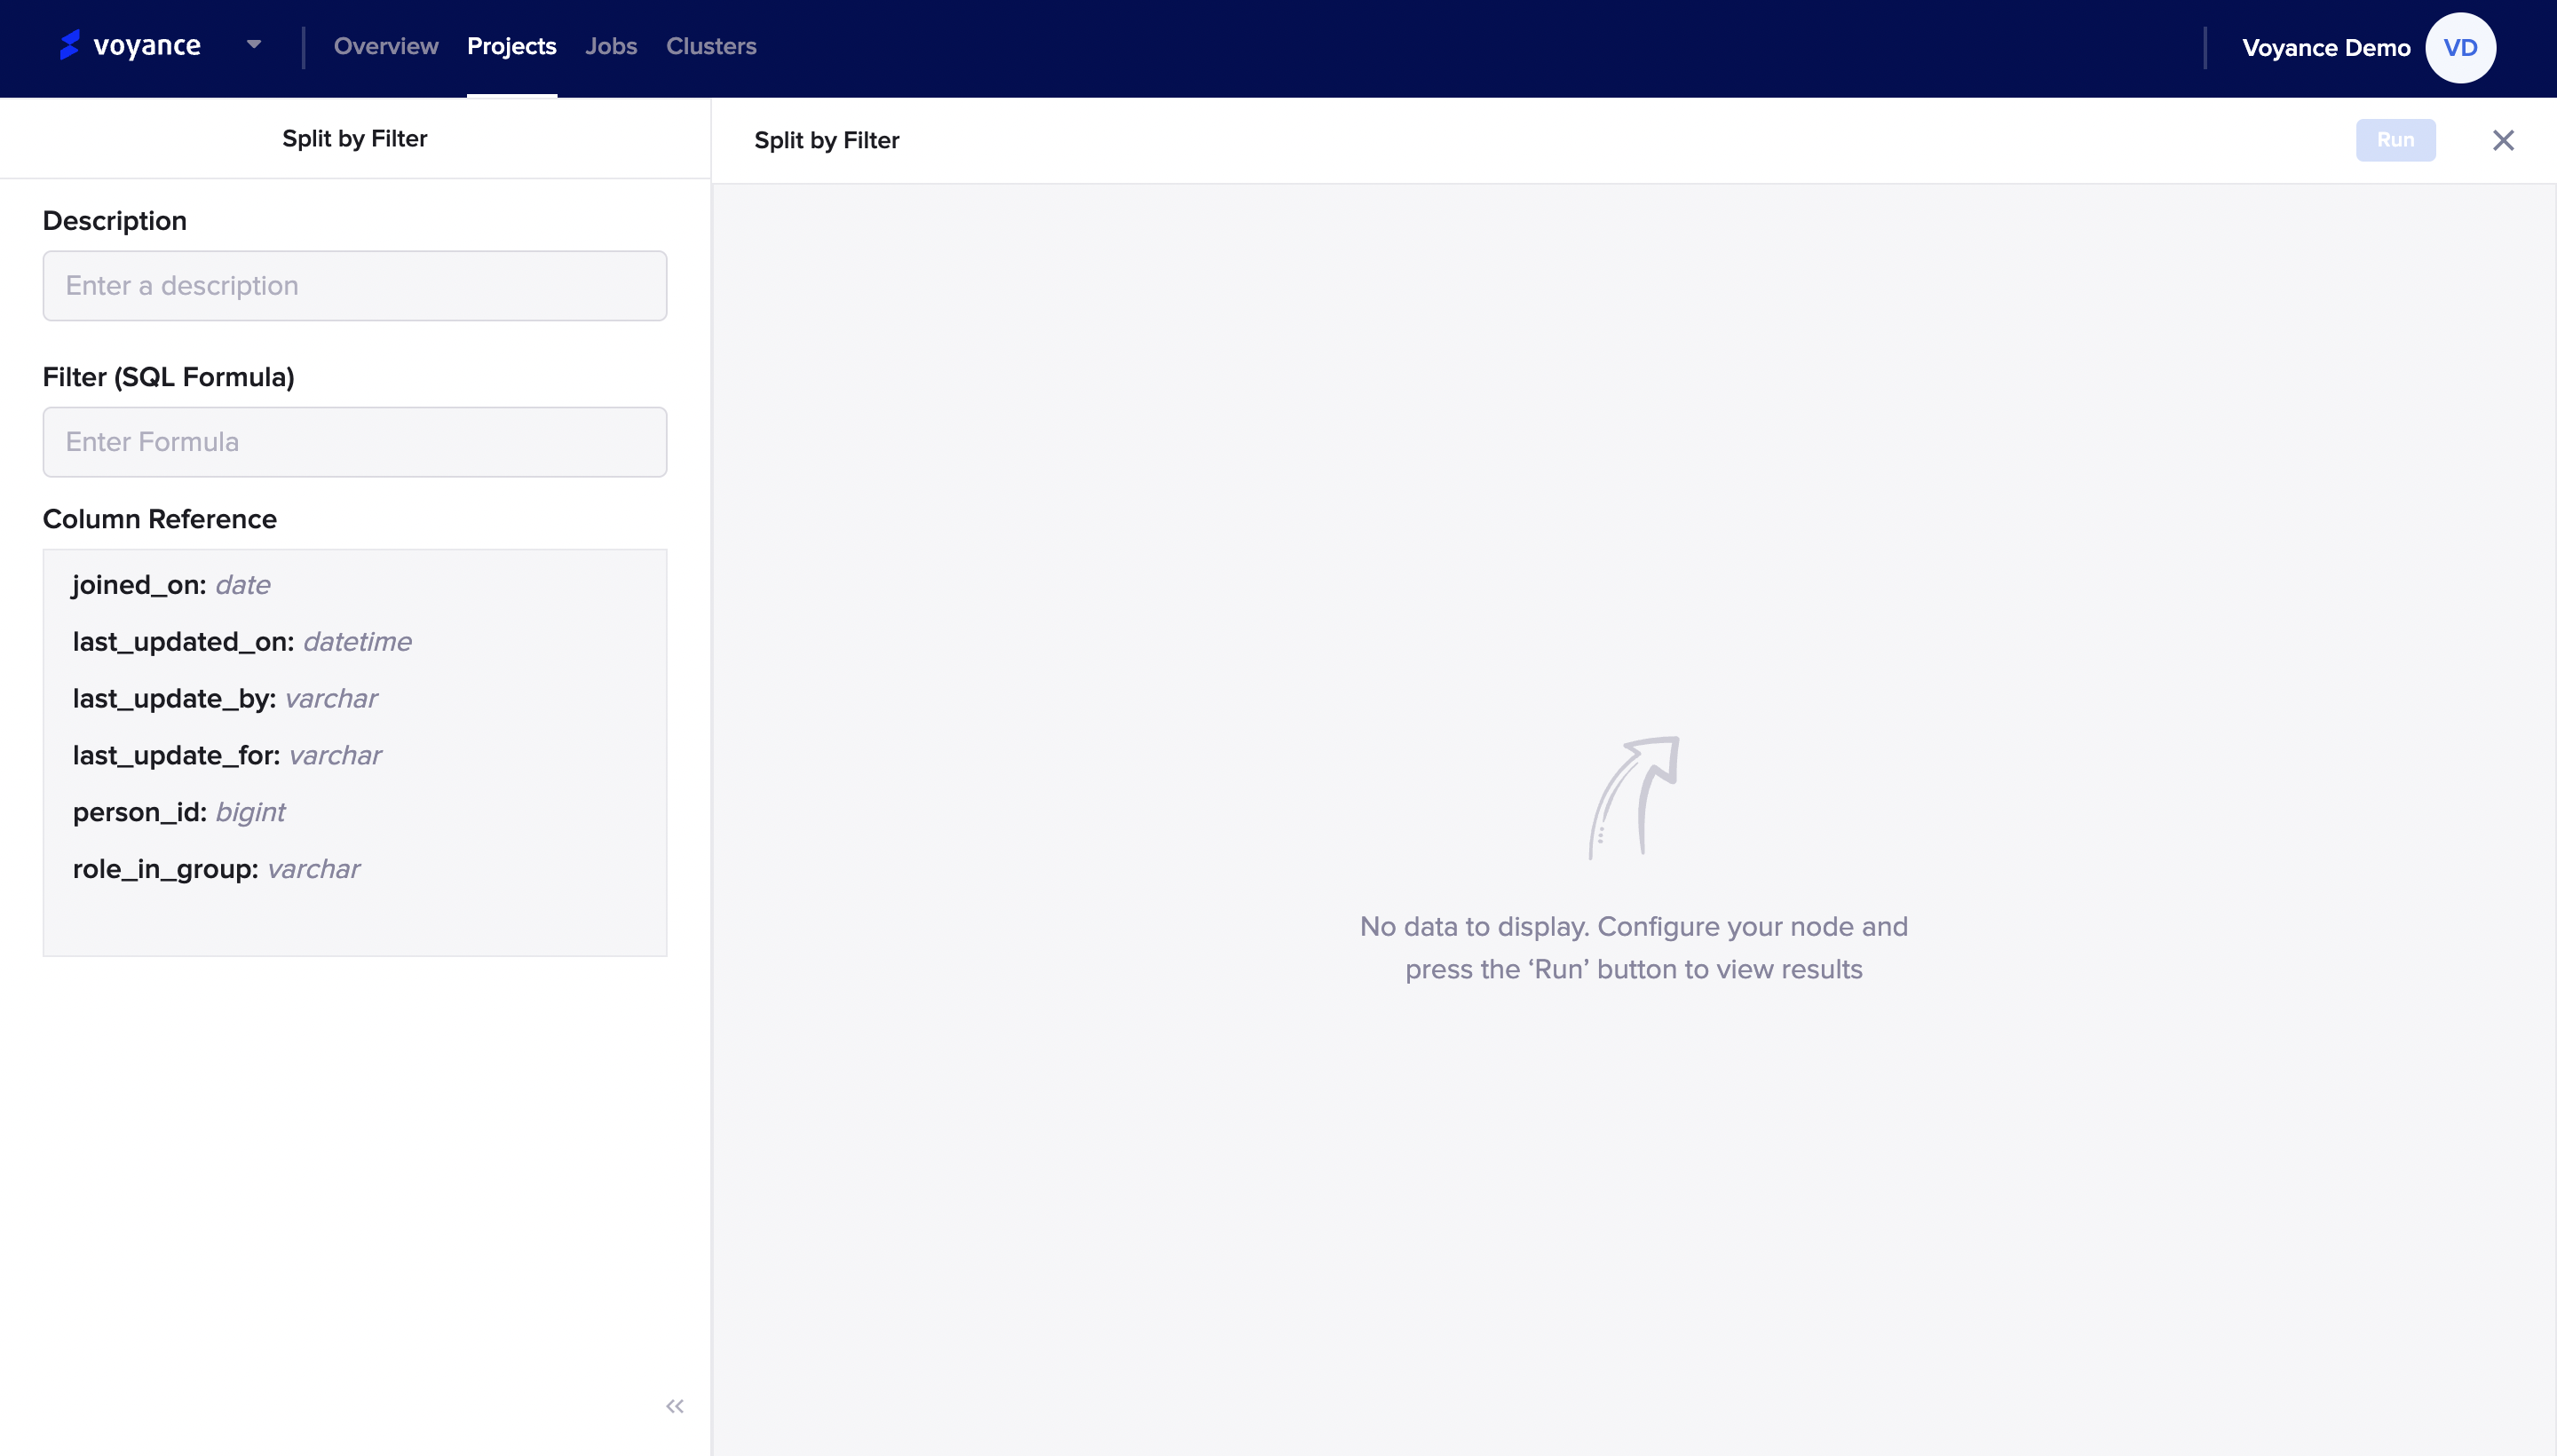
you will be redirected to the split by filter page where you fill in the parameters displayed on the page at the top-left of the page to configure your nodes.
Run program:
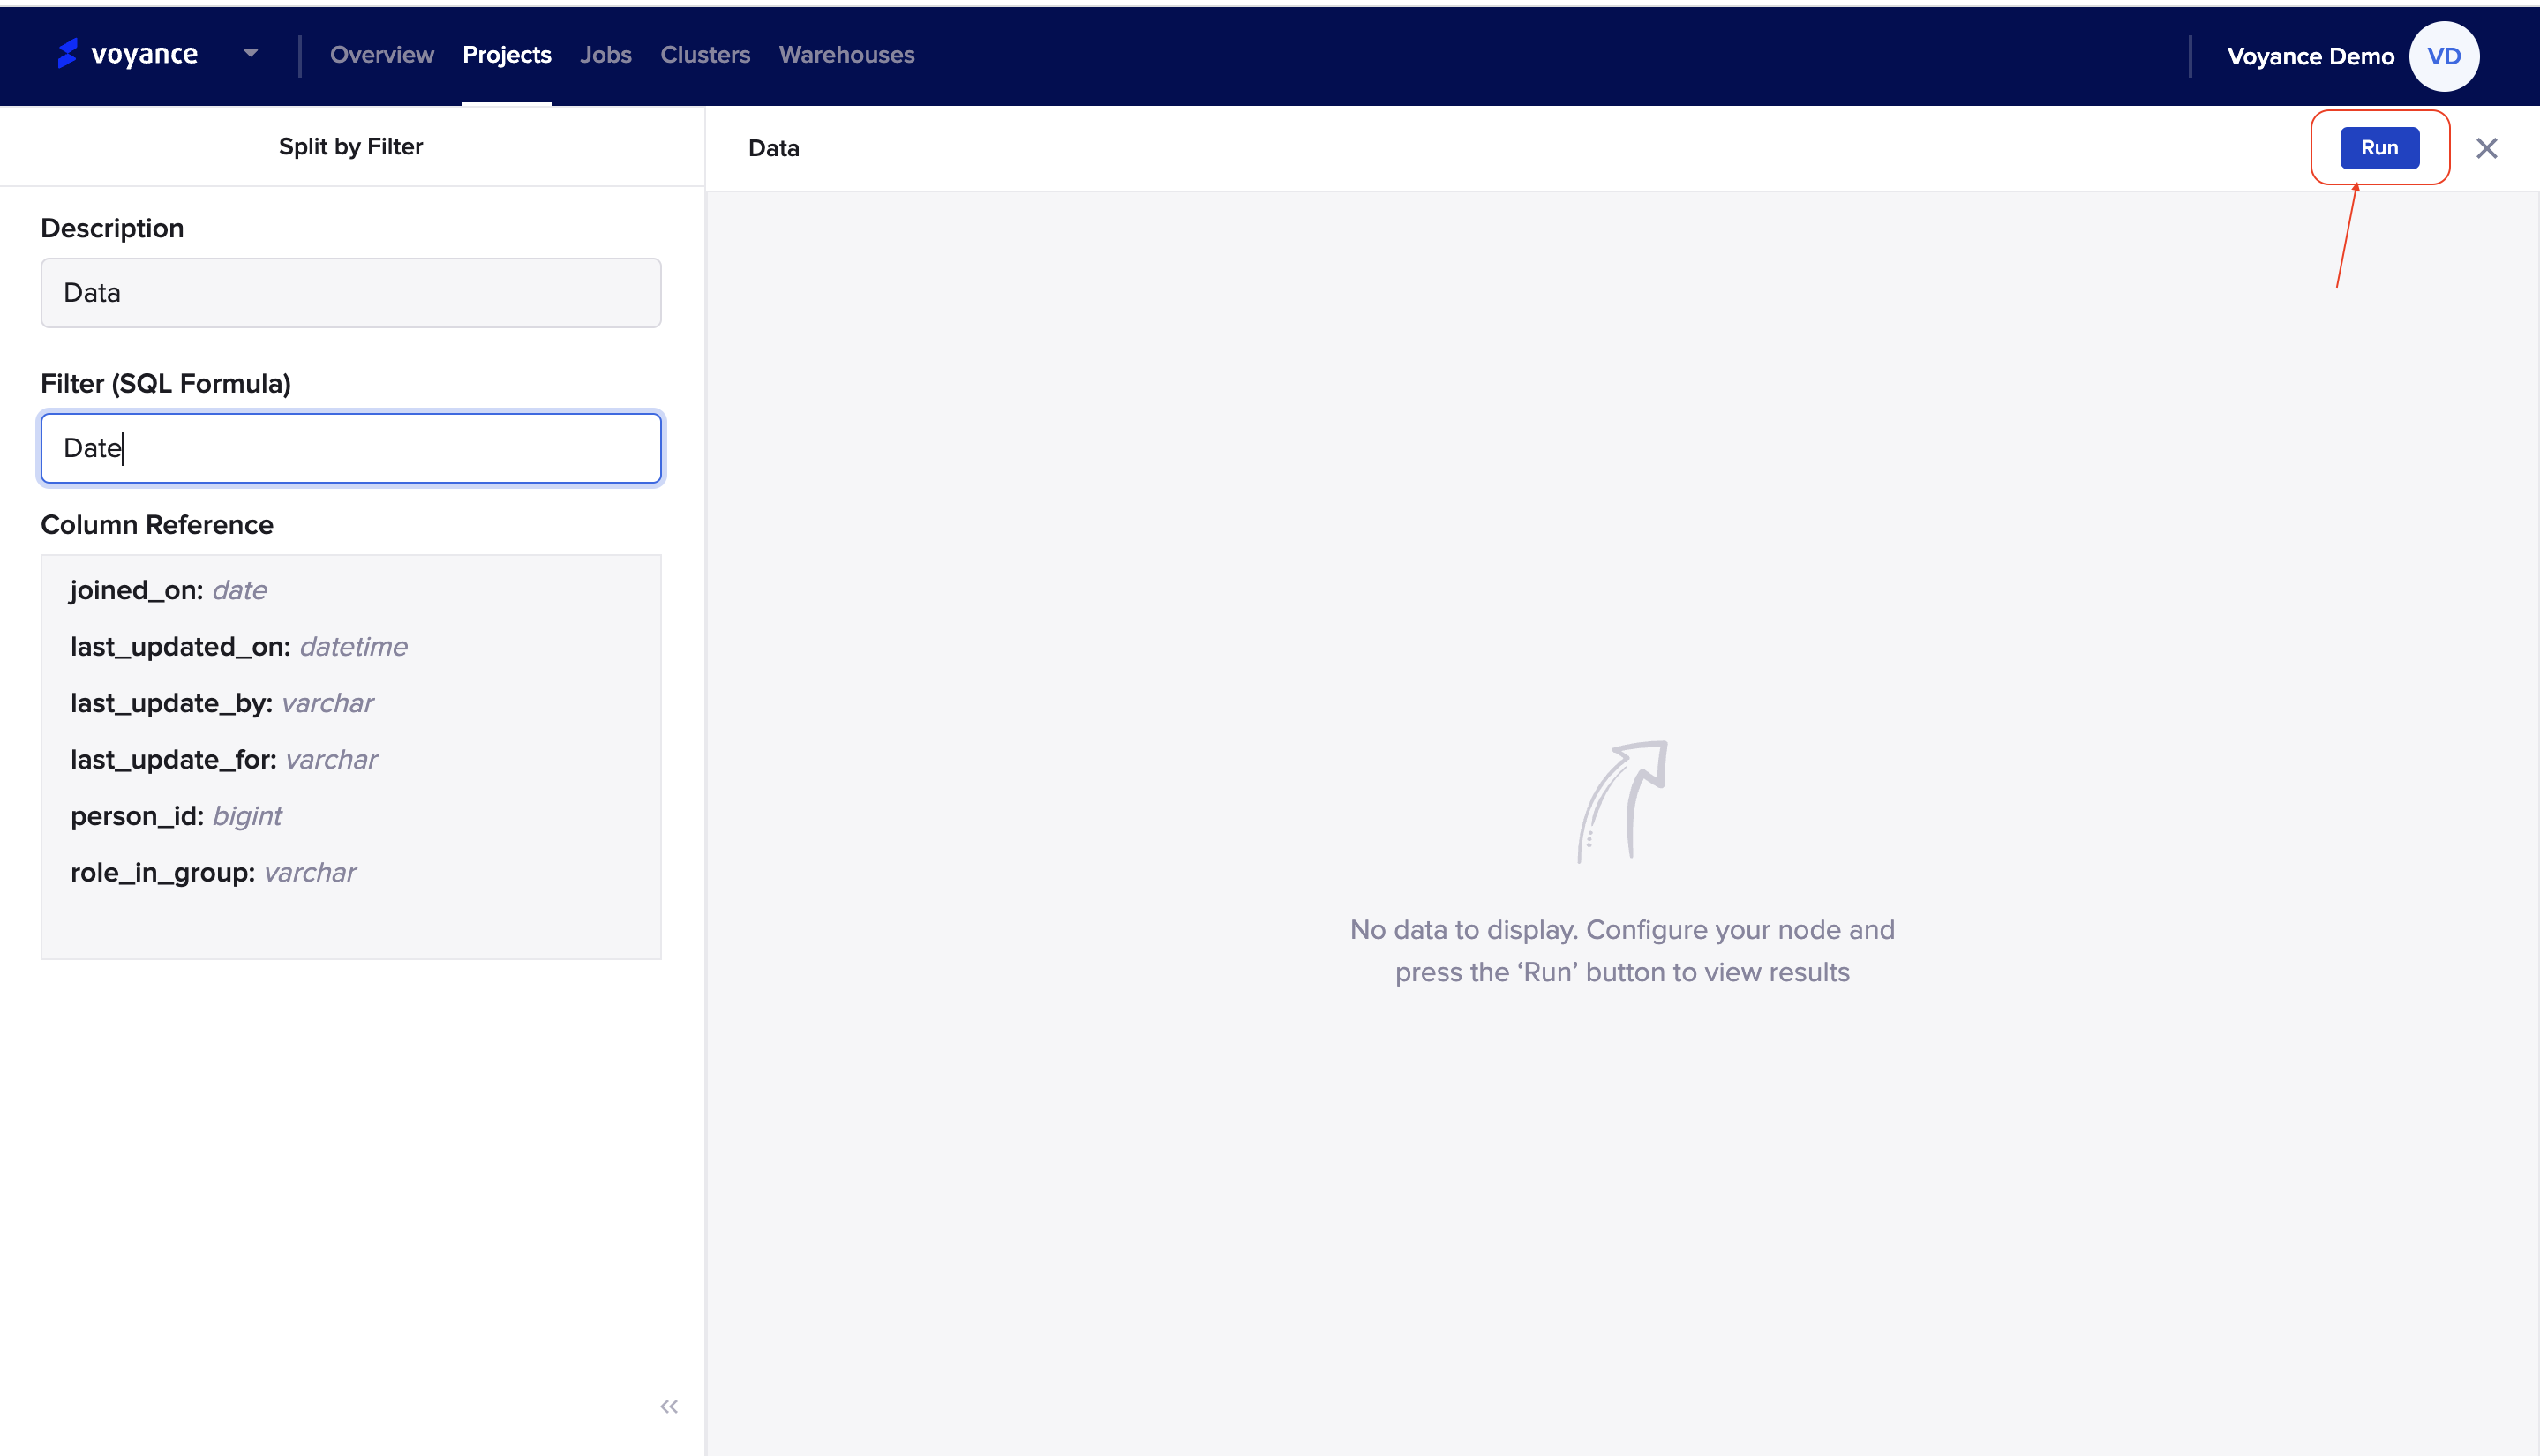
To preview the dataset you split by filter on the page, click on the *"Run" tab at the top-right of the page to
analyze and view the results of the configuration of the node.
Delete To delete the split by filter dialog box on the workflow, click on the "Delete icon" at the top of the dialog box
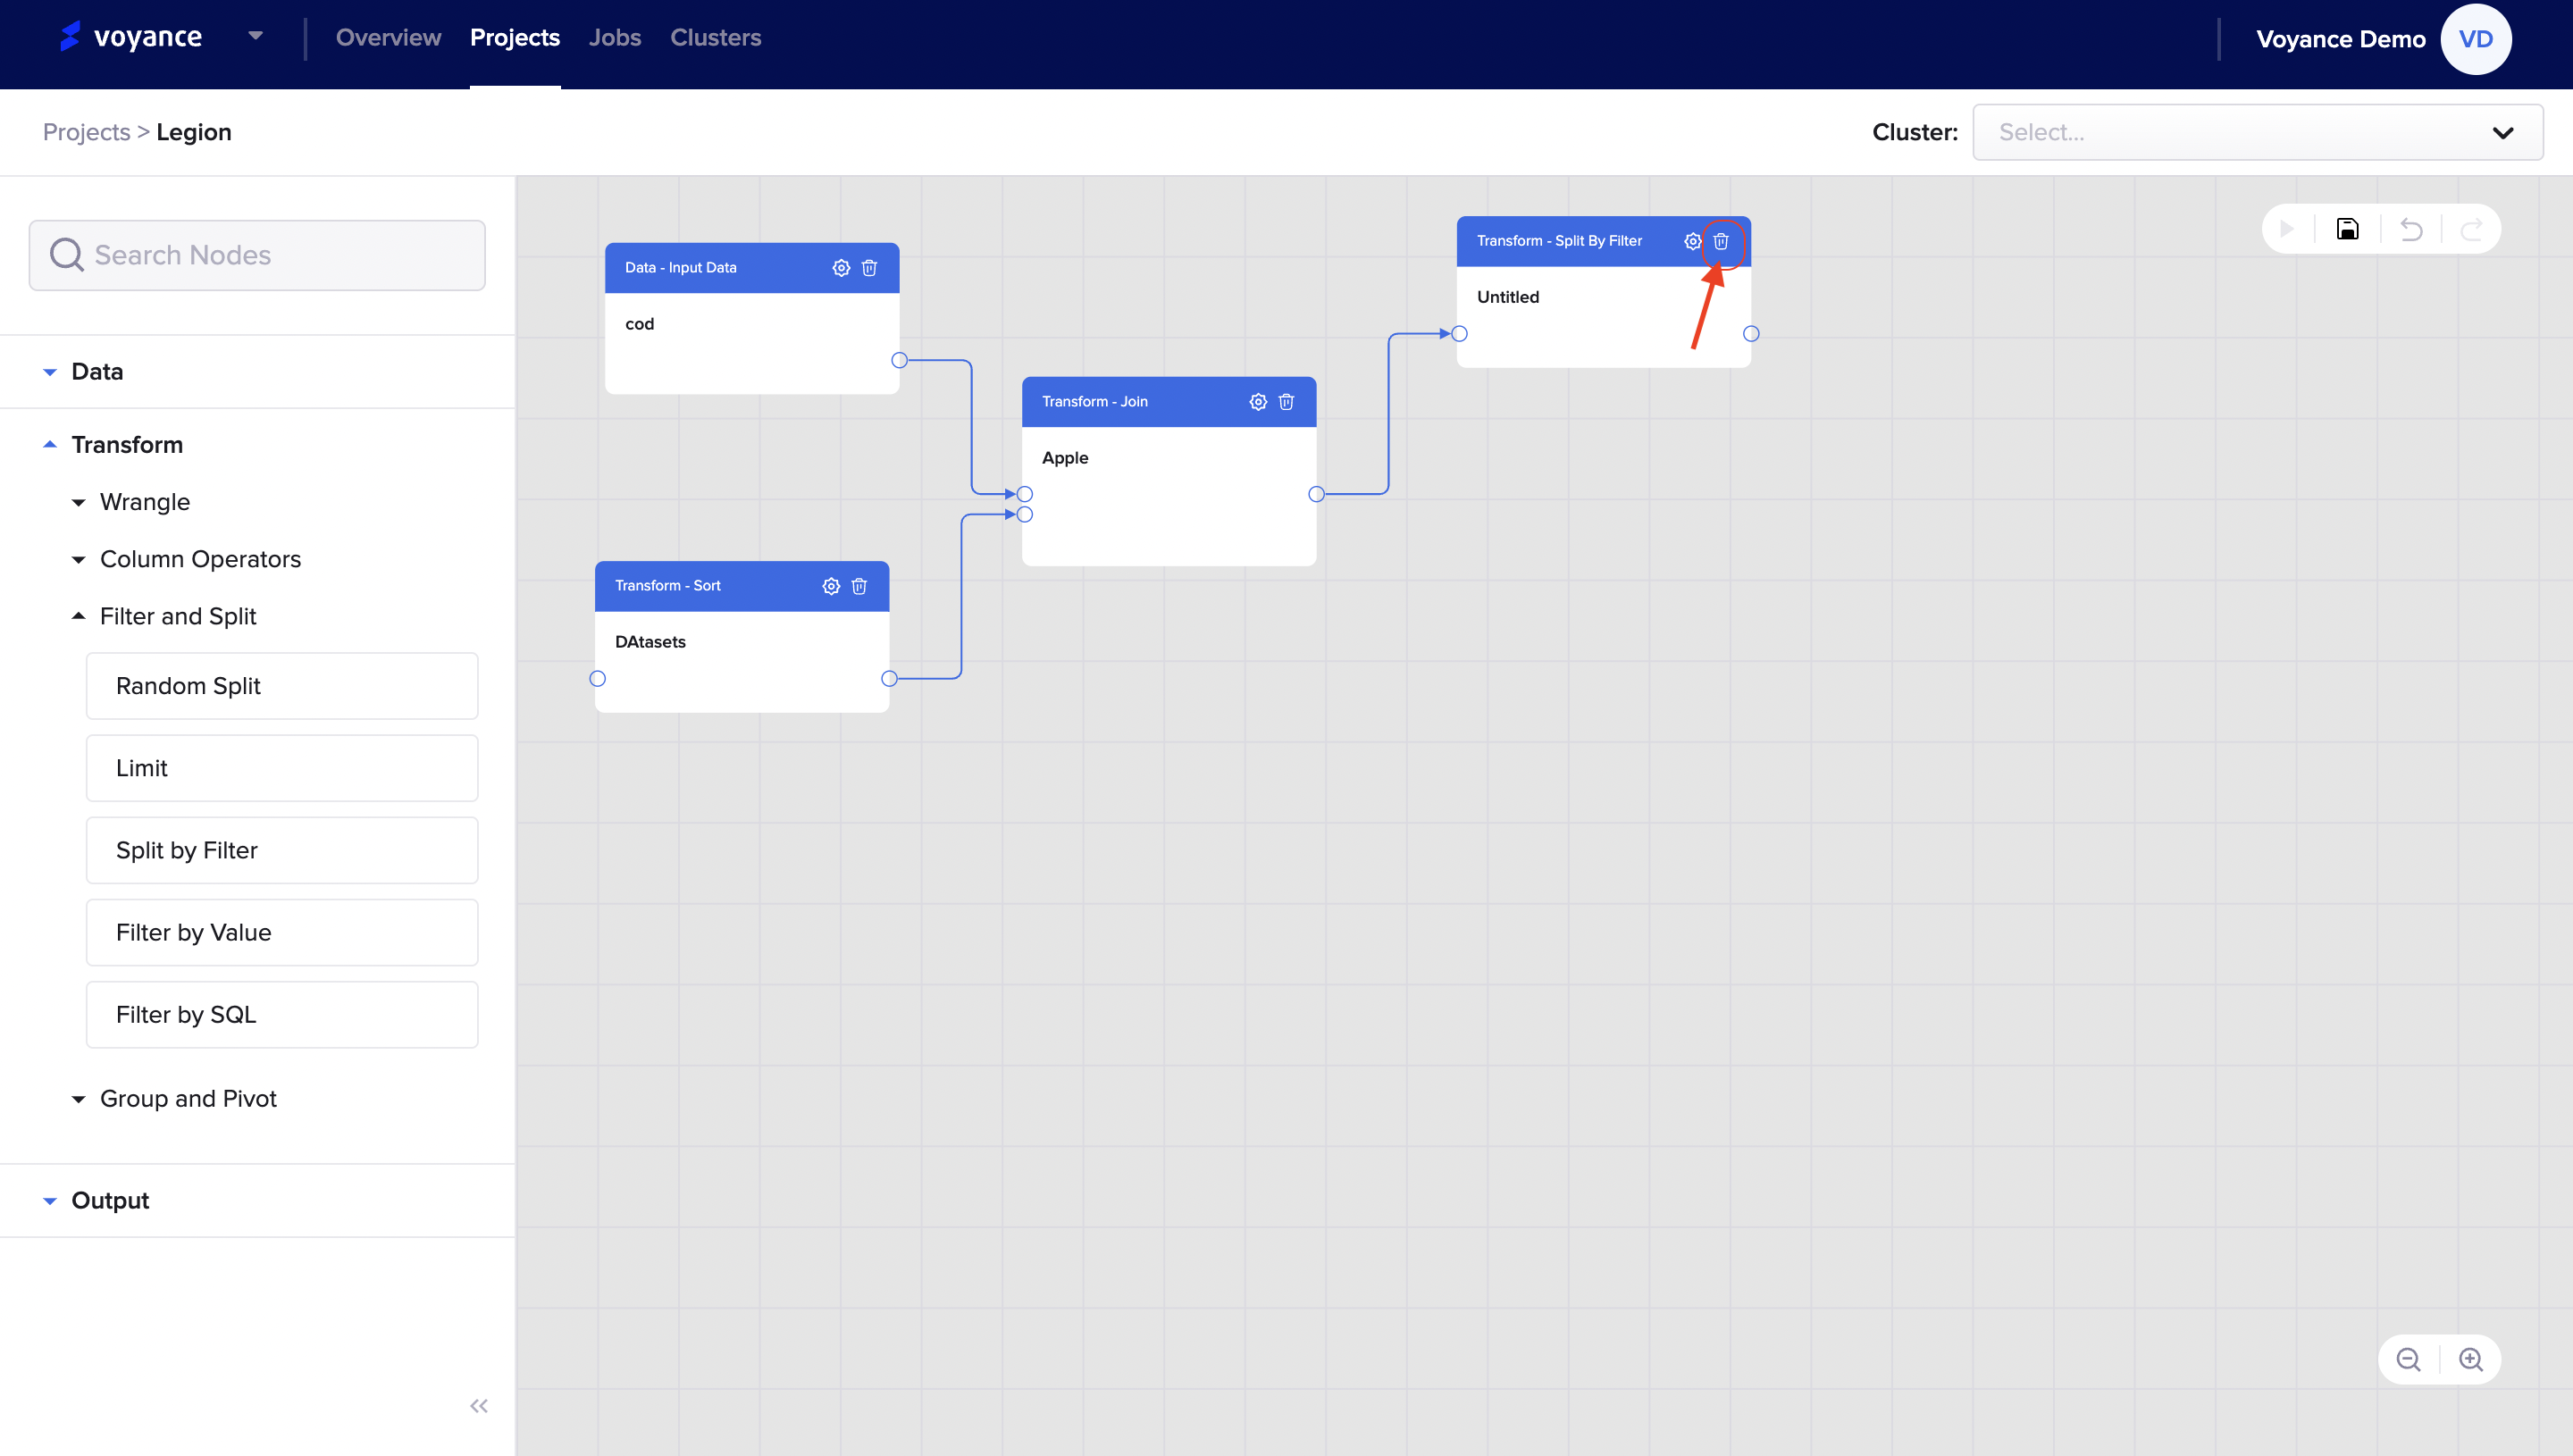
Filter by Value
With our filter by value transformation tool, you will be able to filter out data or items in queries using value. To transform your data using the filter by value tool, click and drag the Filter by value tab under the filter and split transformation feature to the project workflow.
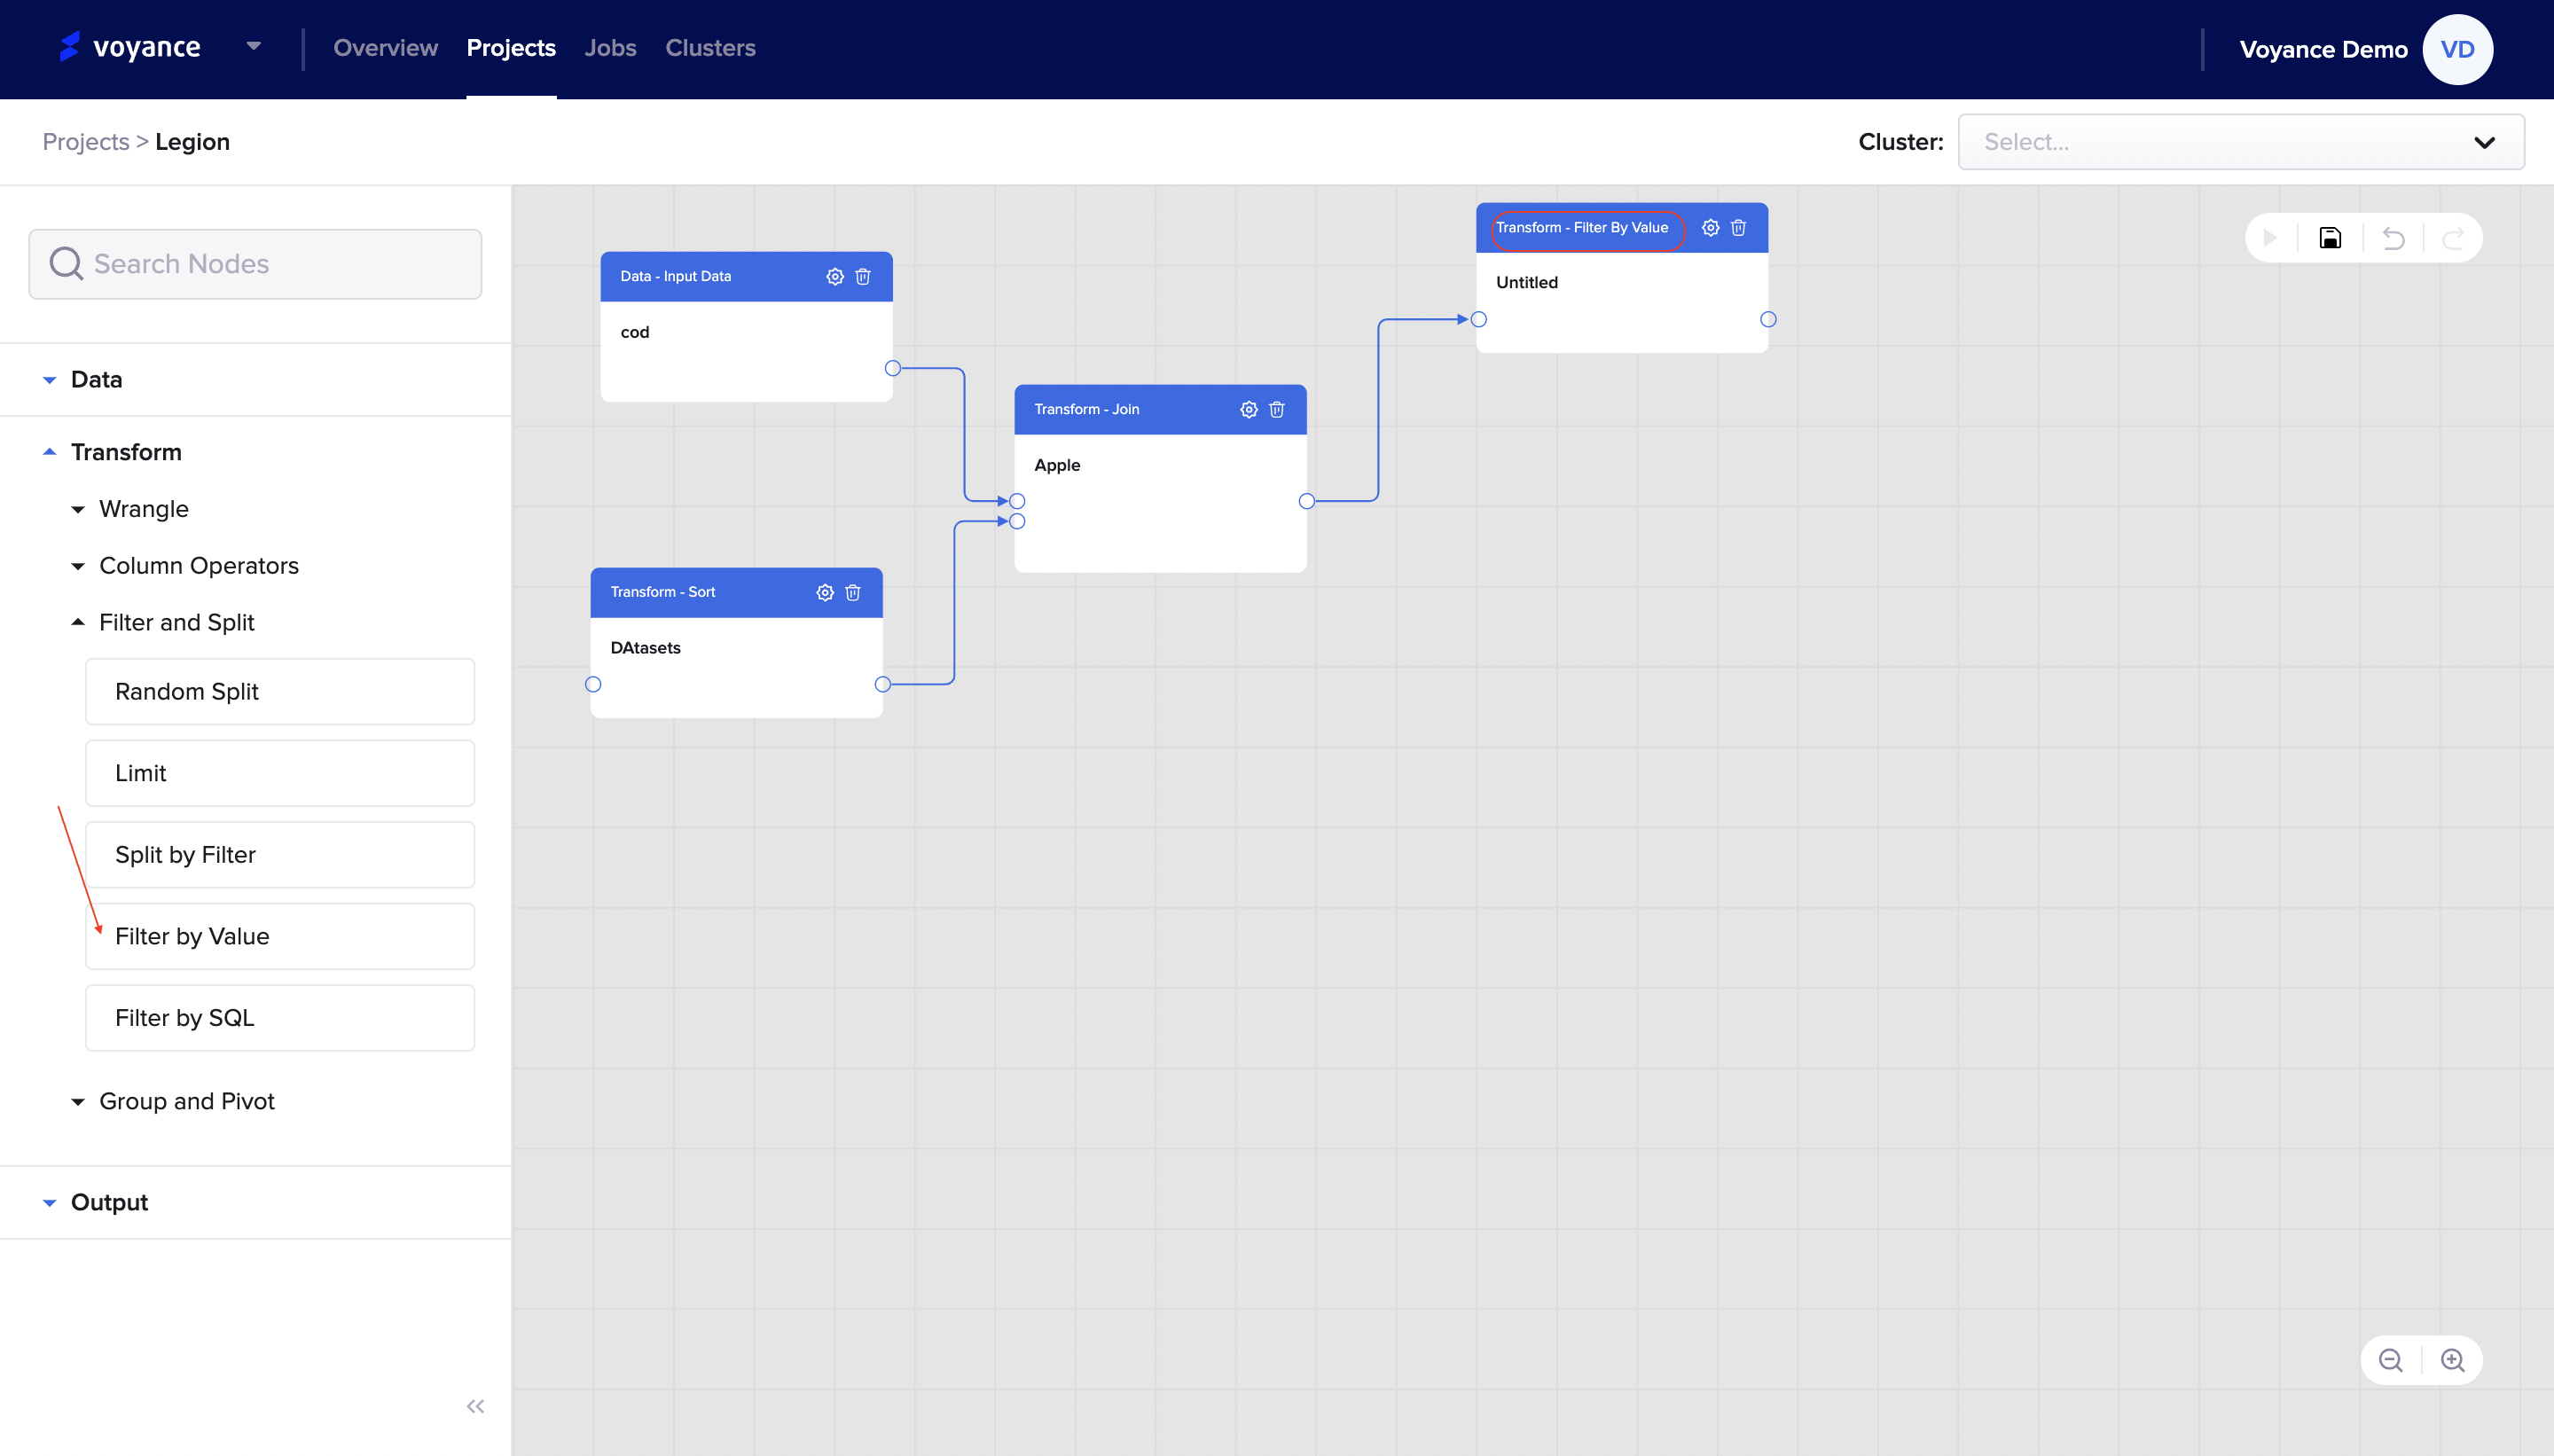
Filter by Value Editor
To edit your filter by value transform tool, click on the "settings icon" at the top of the dialog box on the workflow
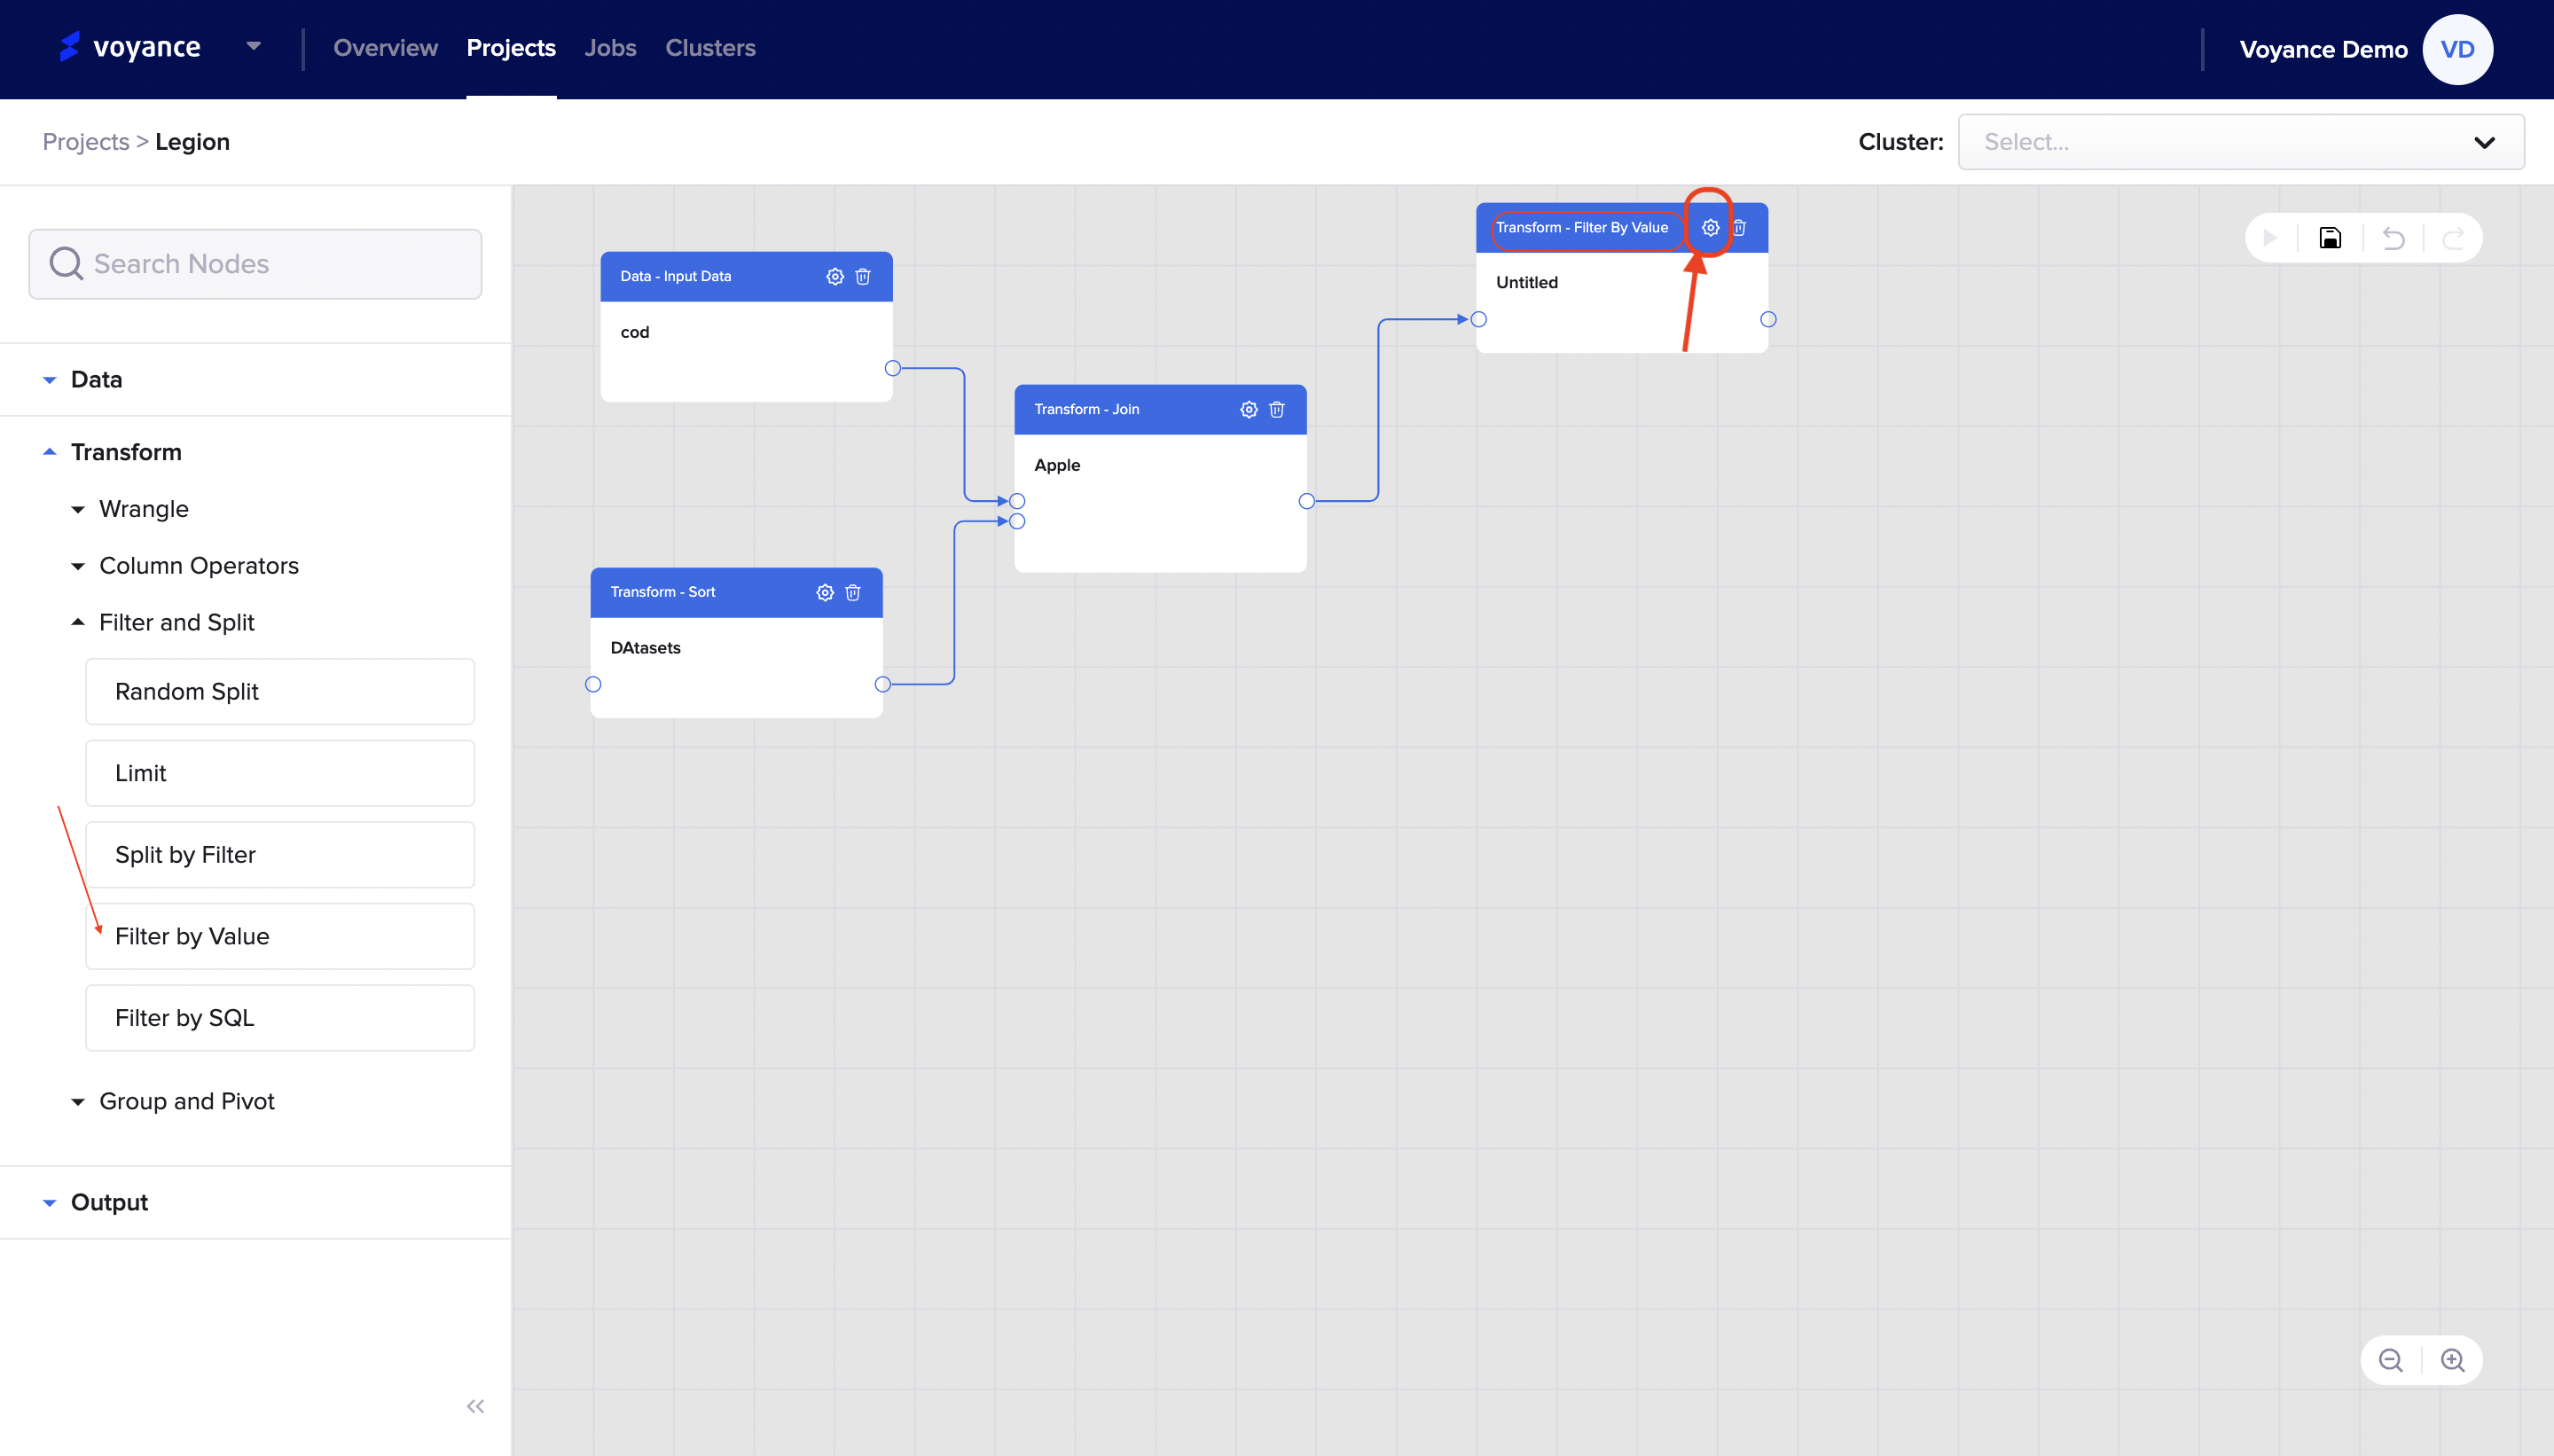
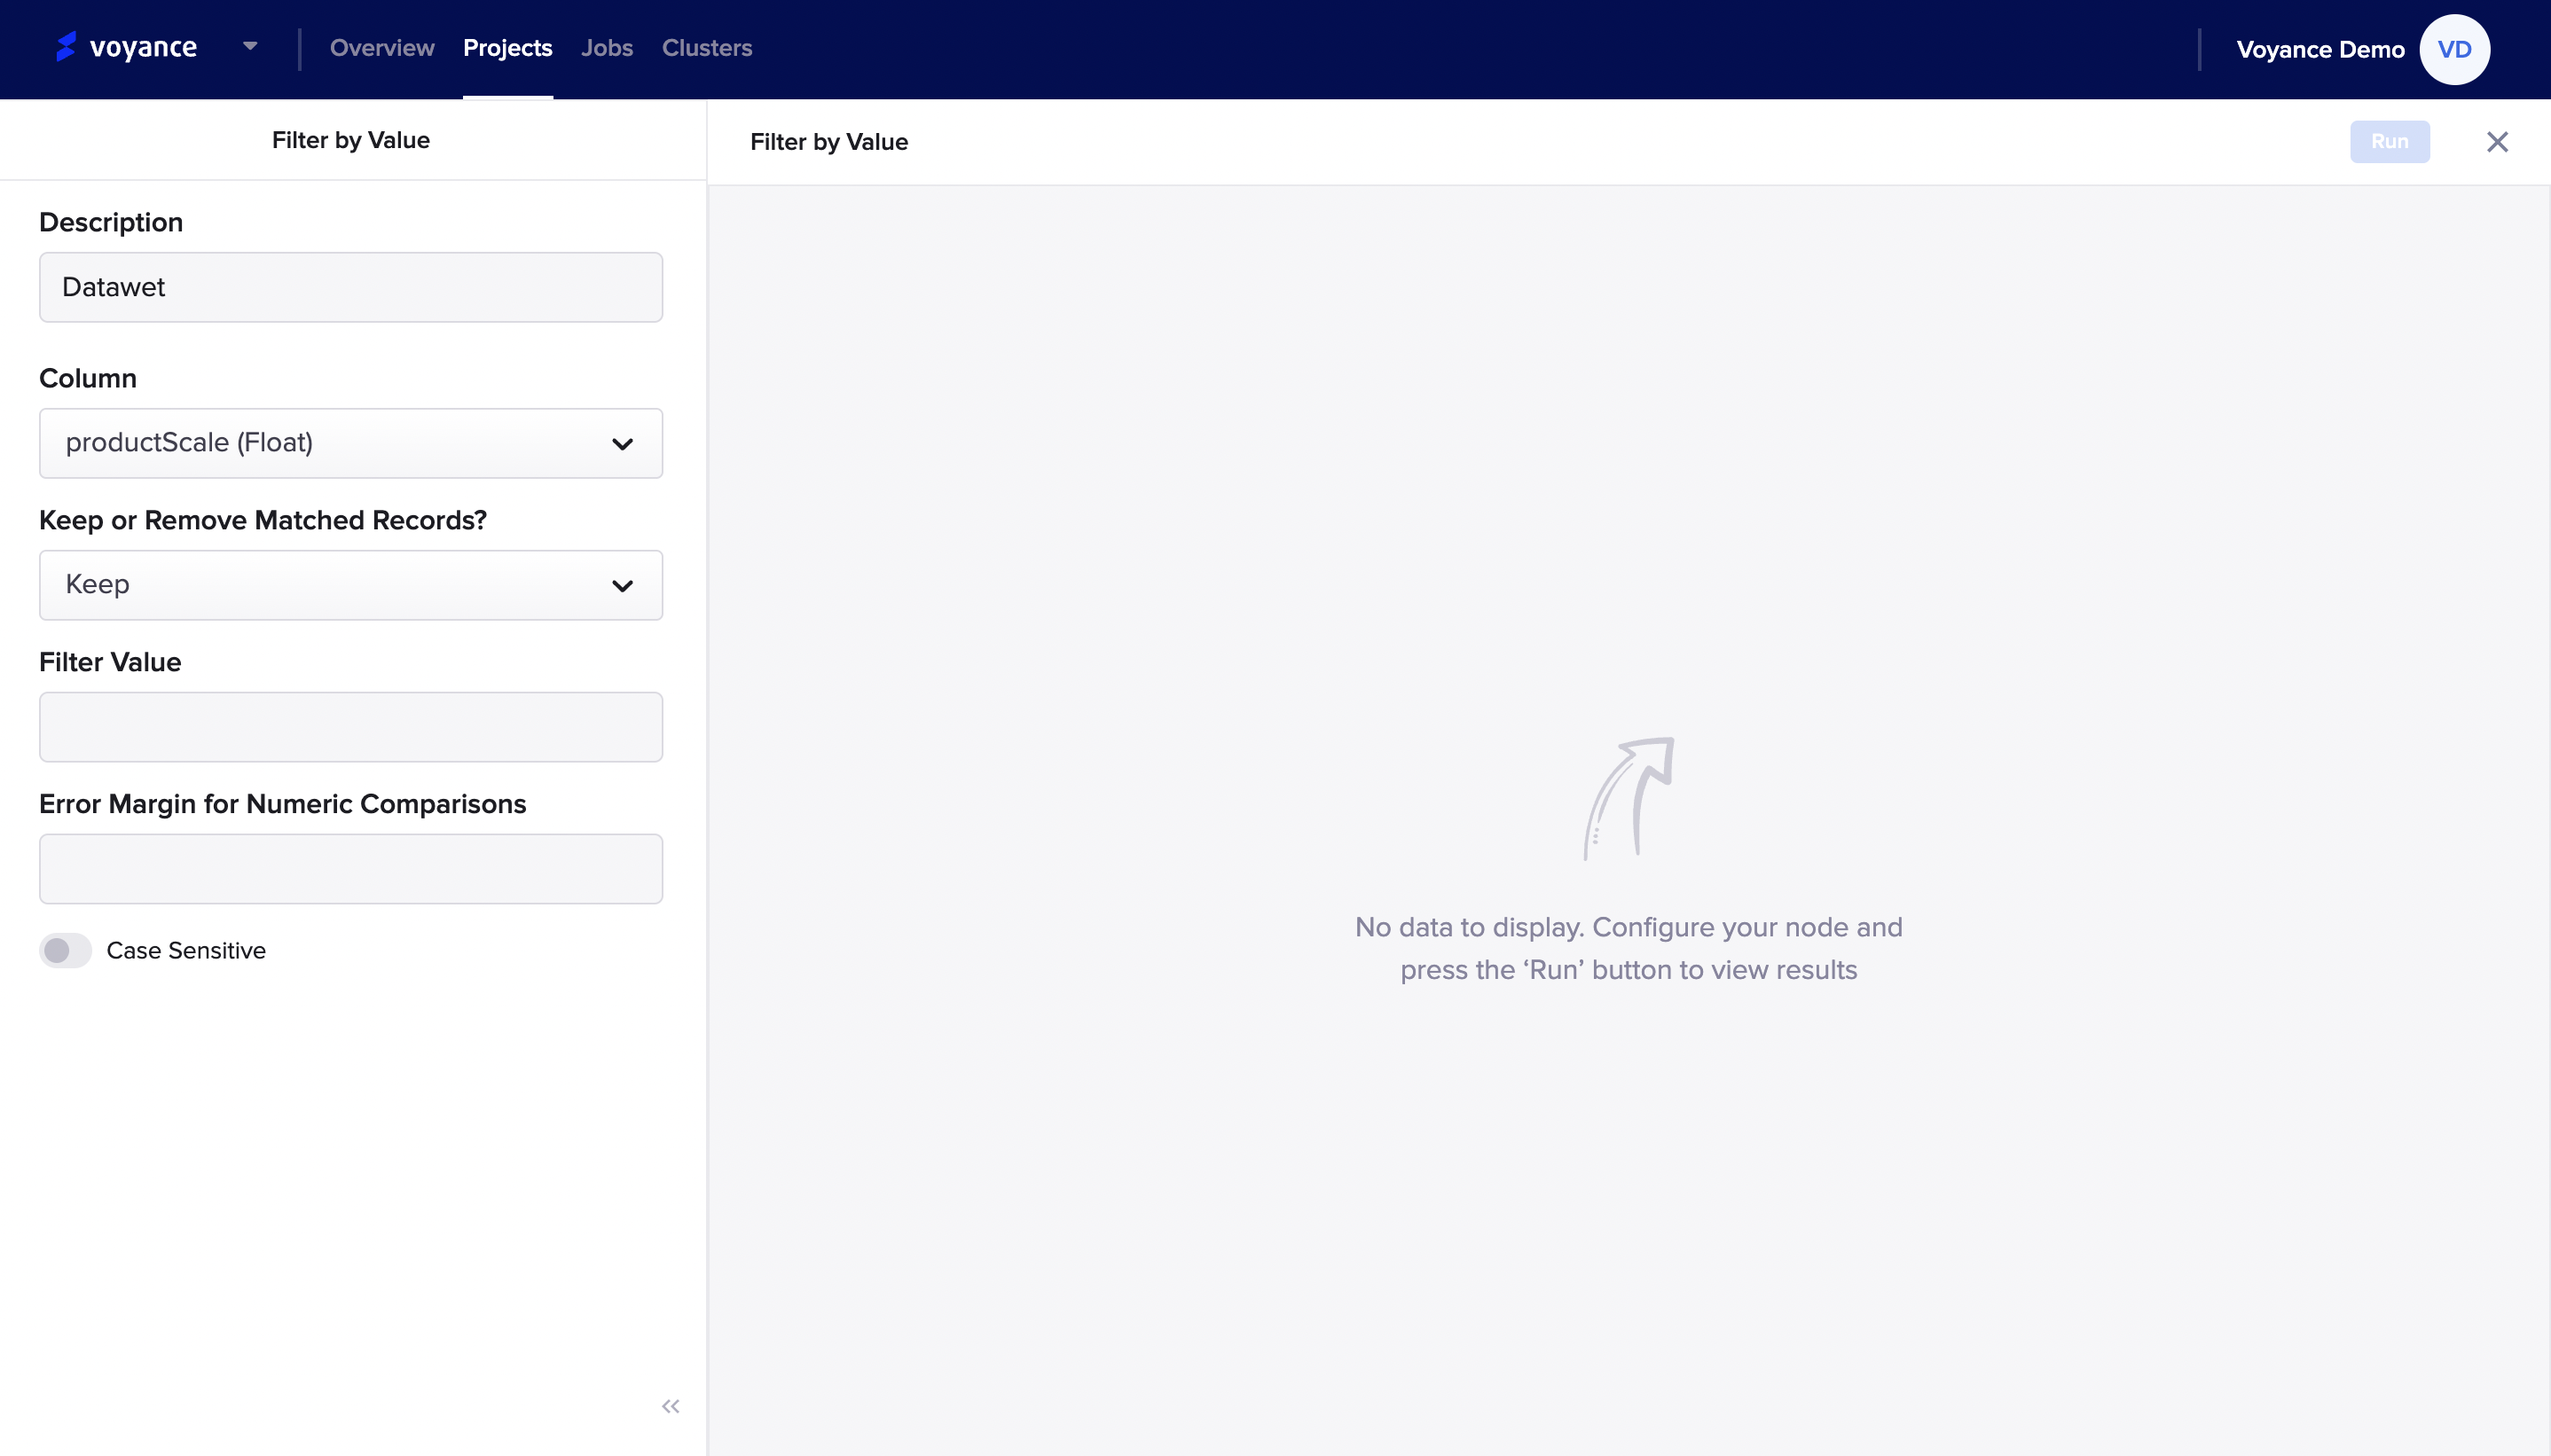
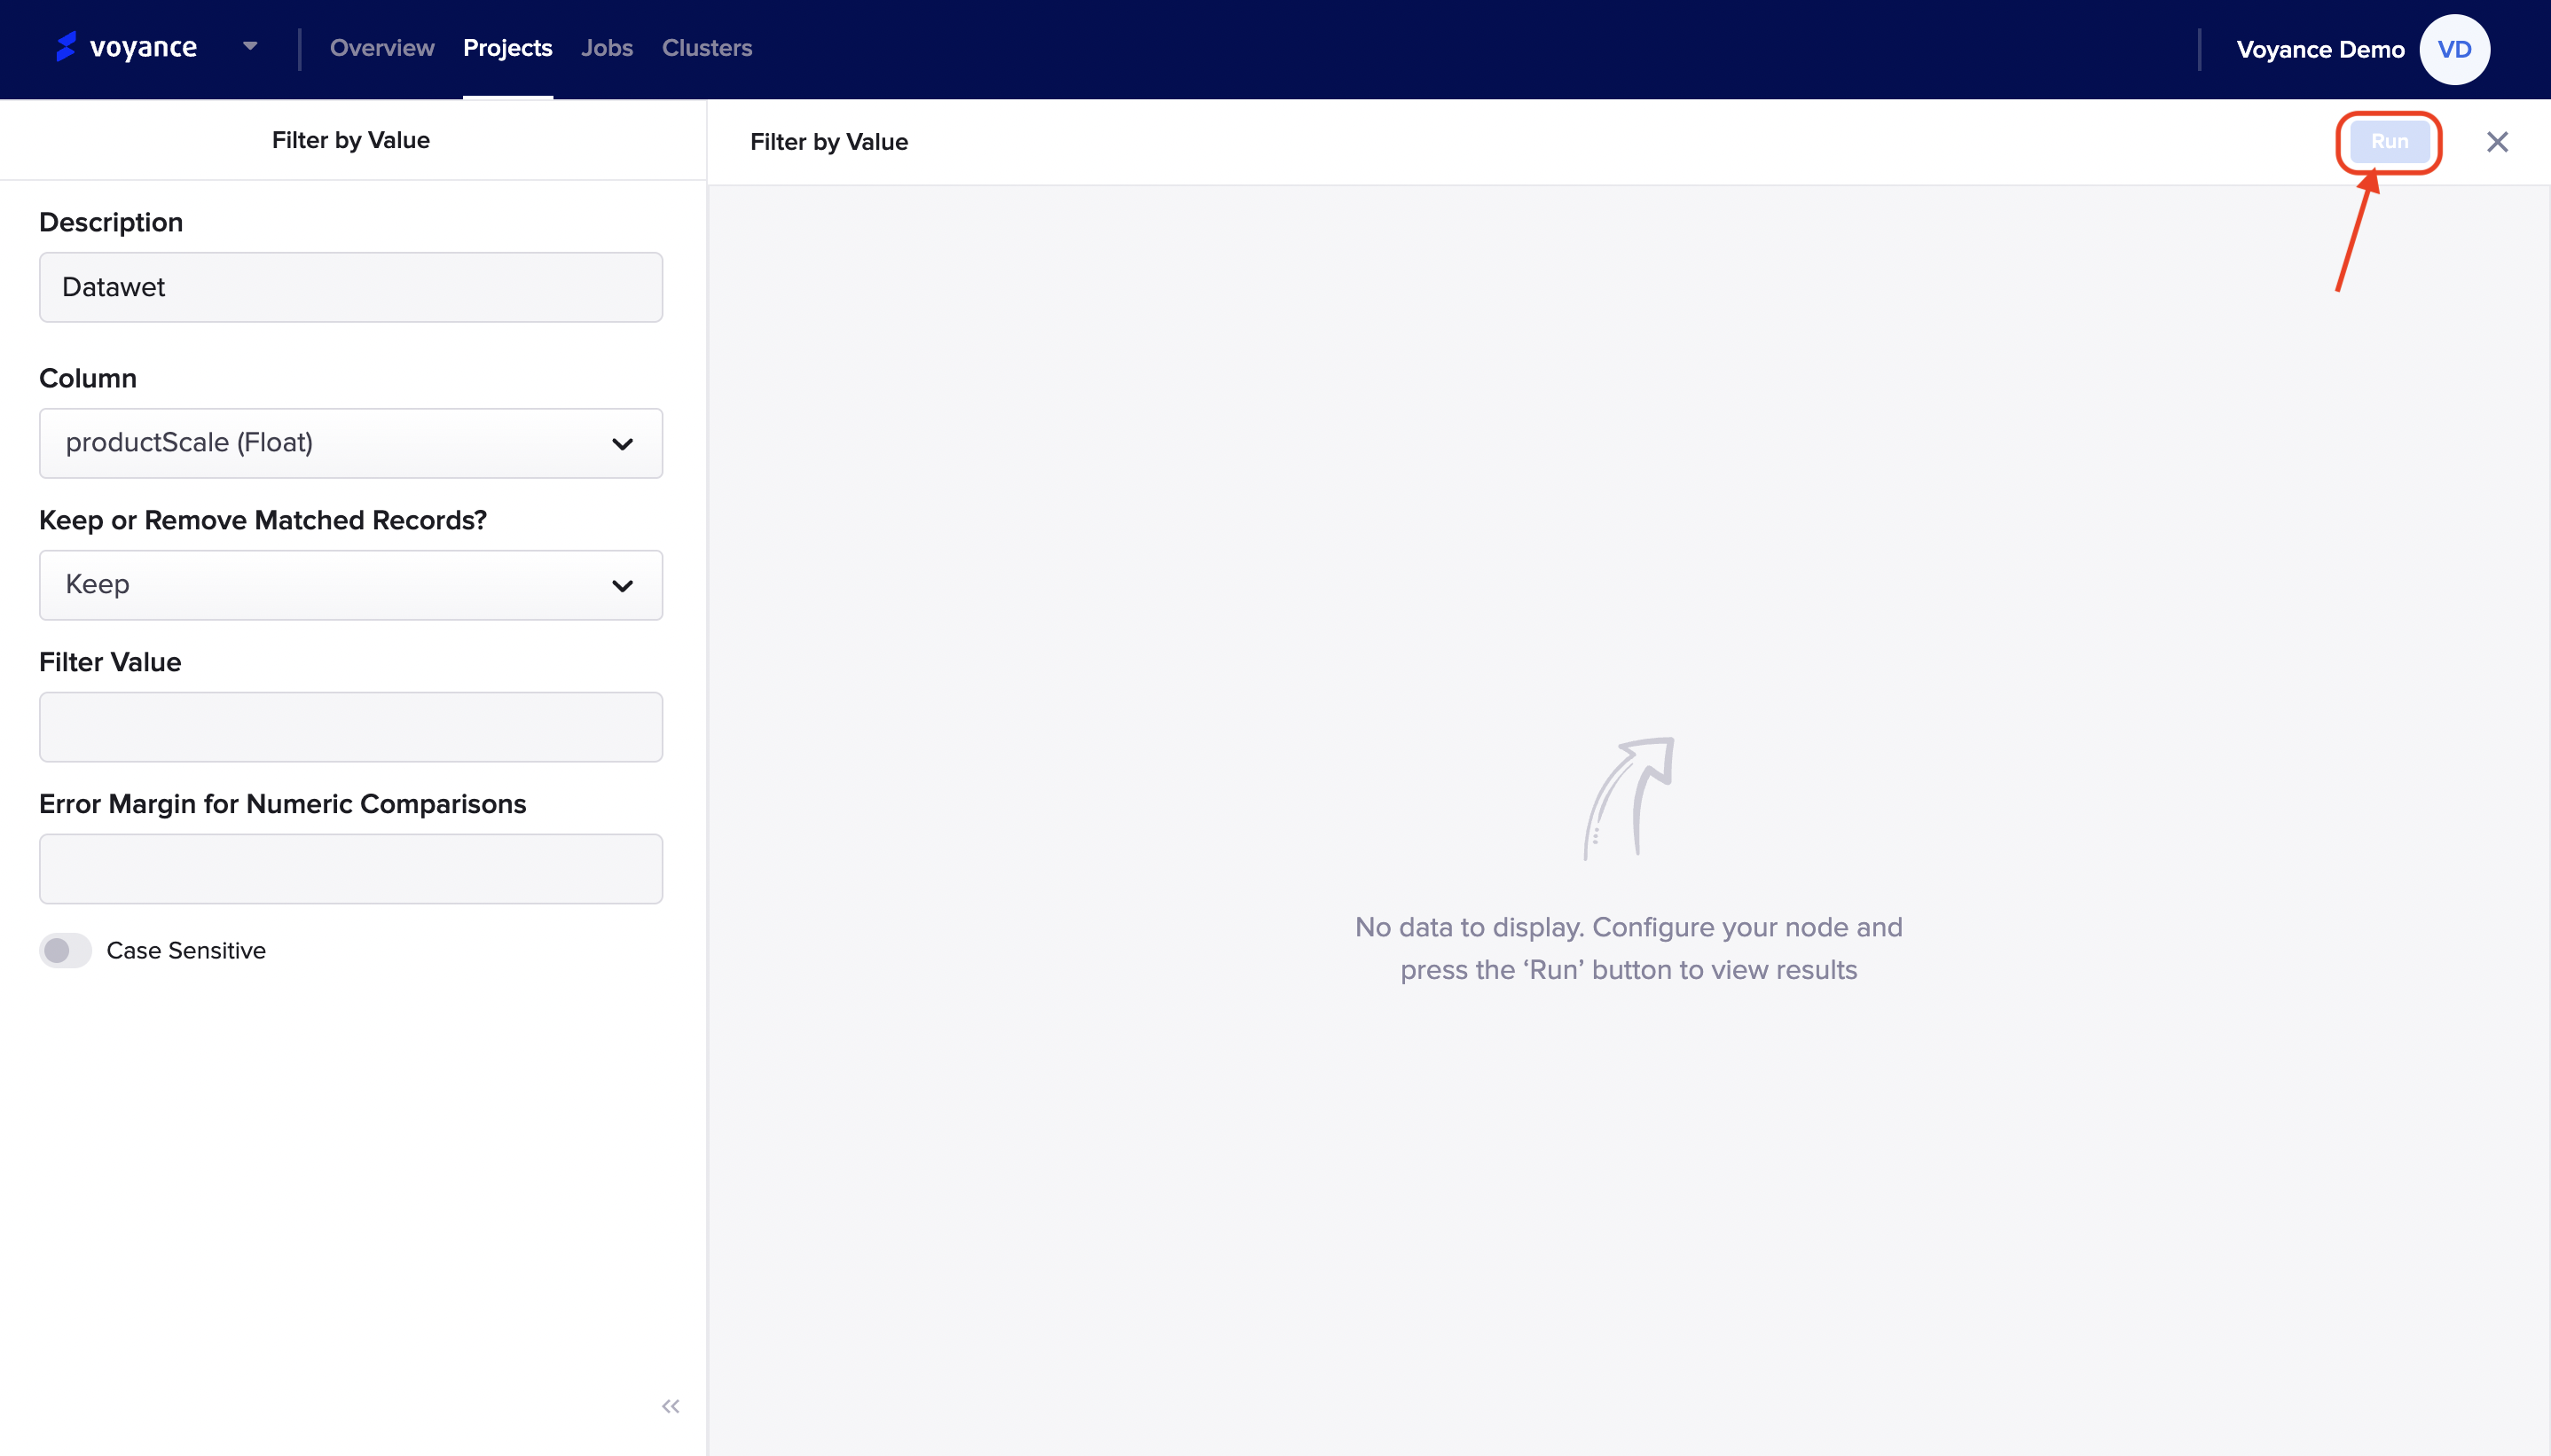
it redirects you to the filter by value page where you can filter. your data in queries. fill in the parameters to be able to configure your node. The parameters describe the process of how to filter your data by value.
Description:It is giving a brief statement to define your node configuration
**Select column: To select a column for your data, click on the drop-down arrow to select a column for your dataset
**Keep or Remove matched records:: you can either keep or remove matched records in your dataset. Click on the drop-down arrow to select your option either you want to "Keep" or "Remove" matched records
**Filter value: click on the "filter value" tab to enter the value you want to filter out
*Error margins for numeric comparison: To select an error margin, click on either the up or down drop-down arrow to select an error margin comparison.
Note
in a situation, the case is sensitive in nature, click on the on and off icon tab to determine the sensitivity of the node
Run program
To view the result of your node's configuration, click on the "Run" tab at the top-right of the filter by value page to view the result of the configuration.
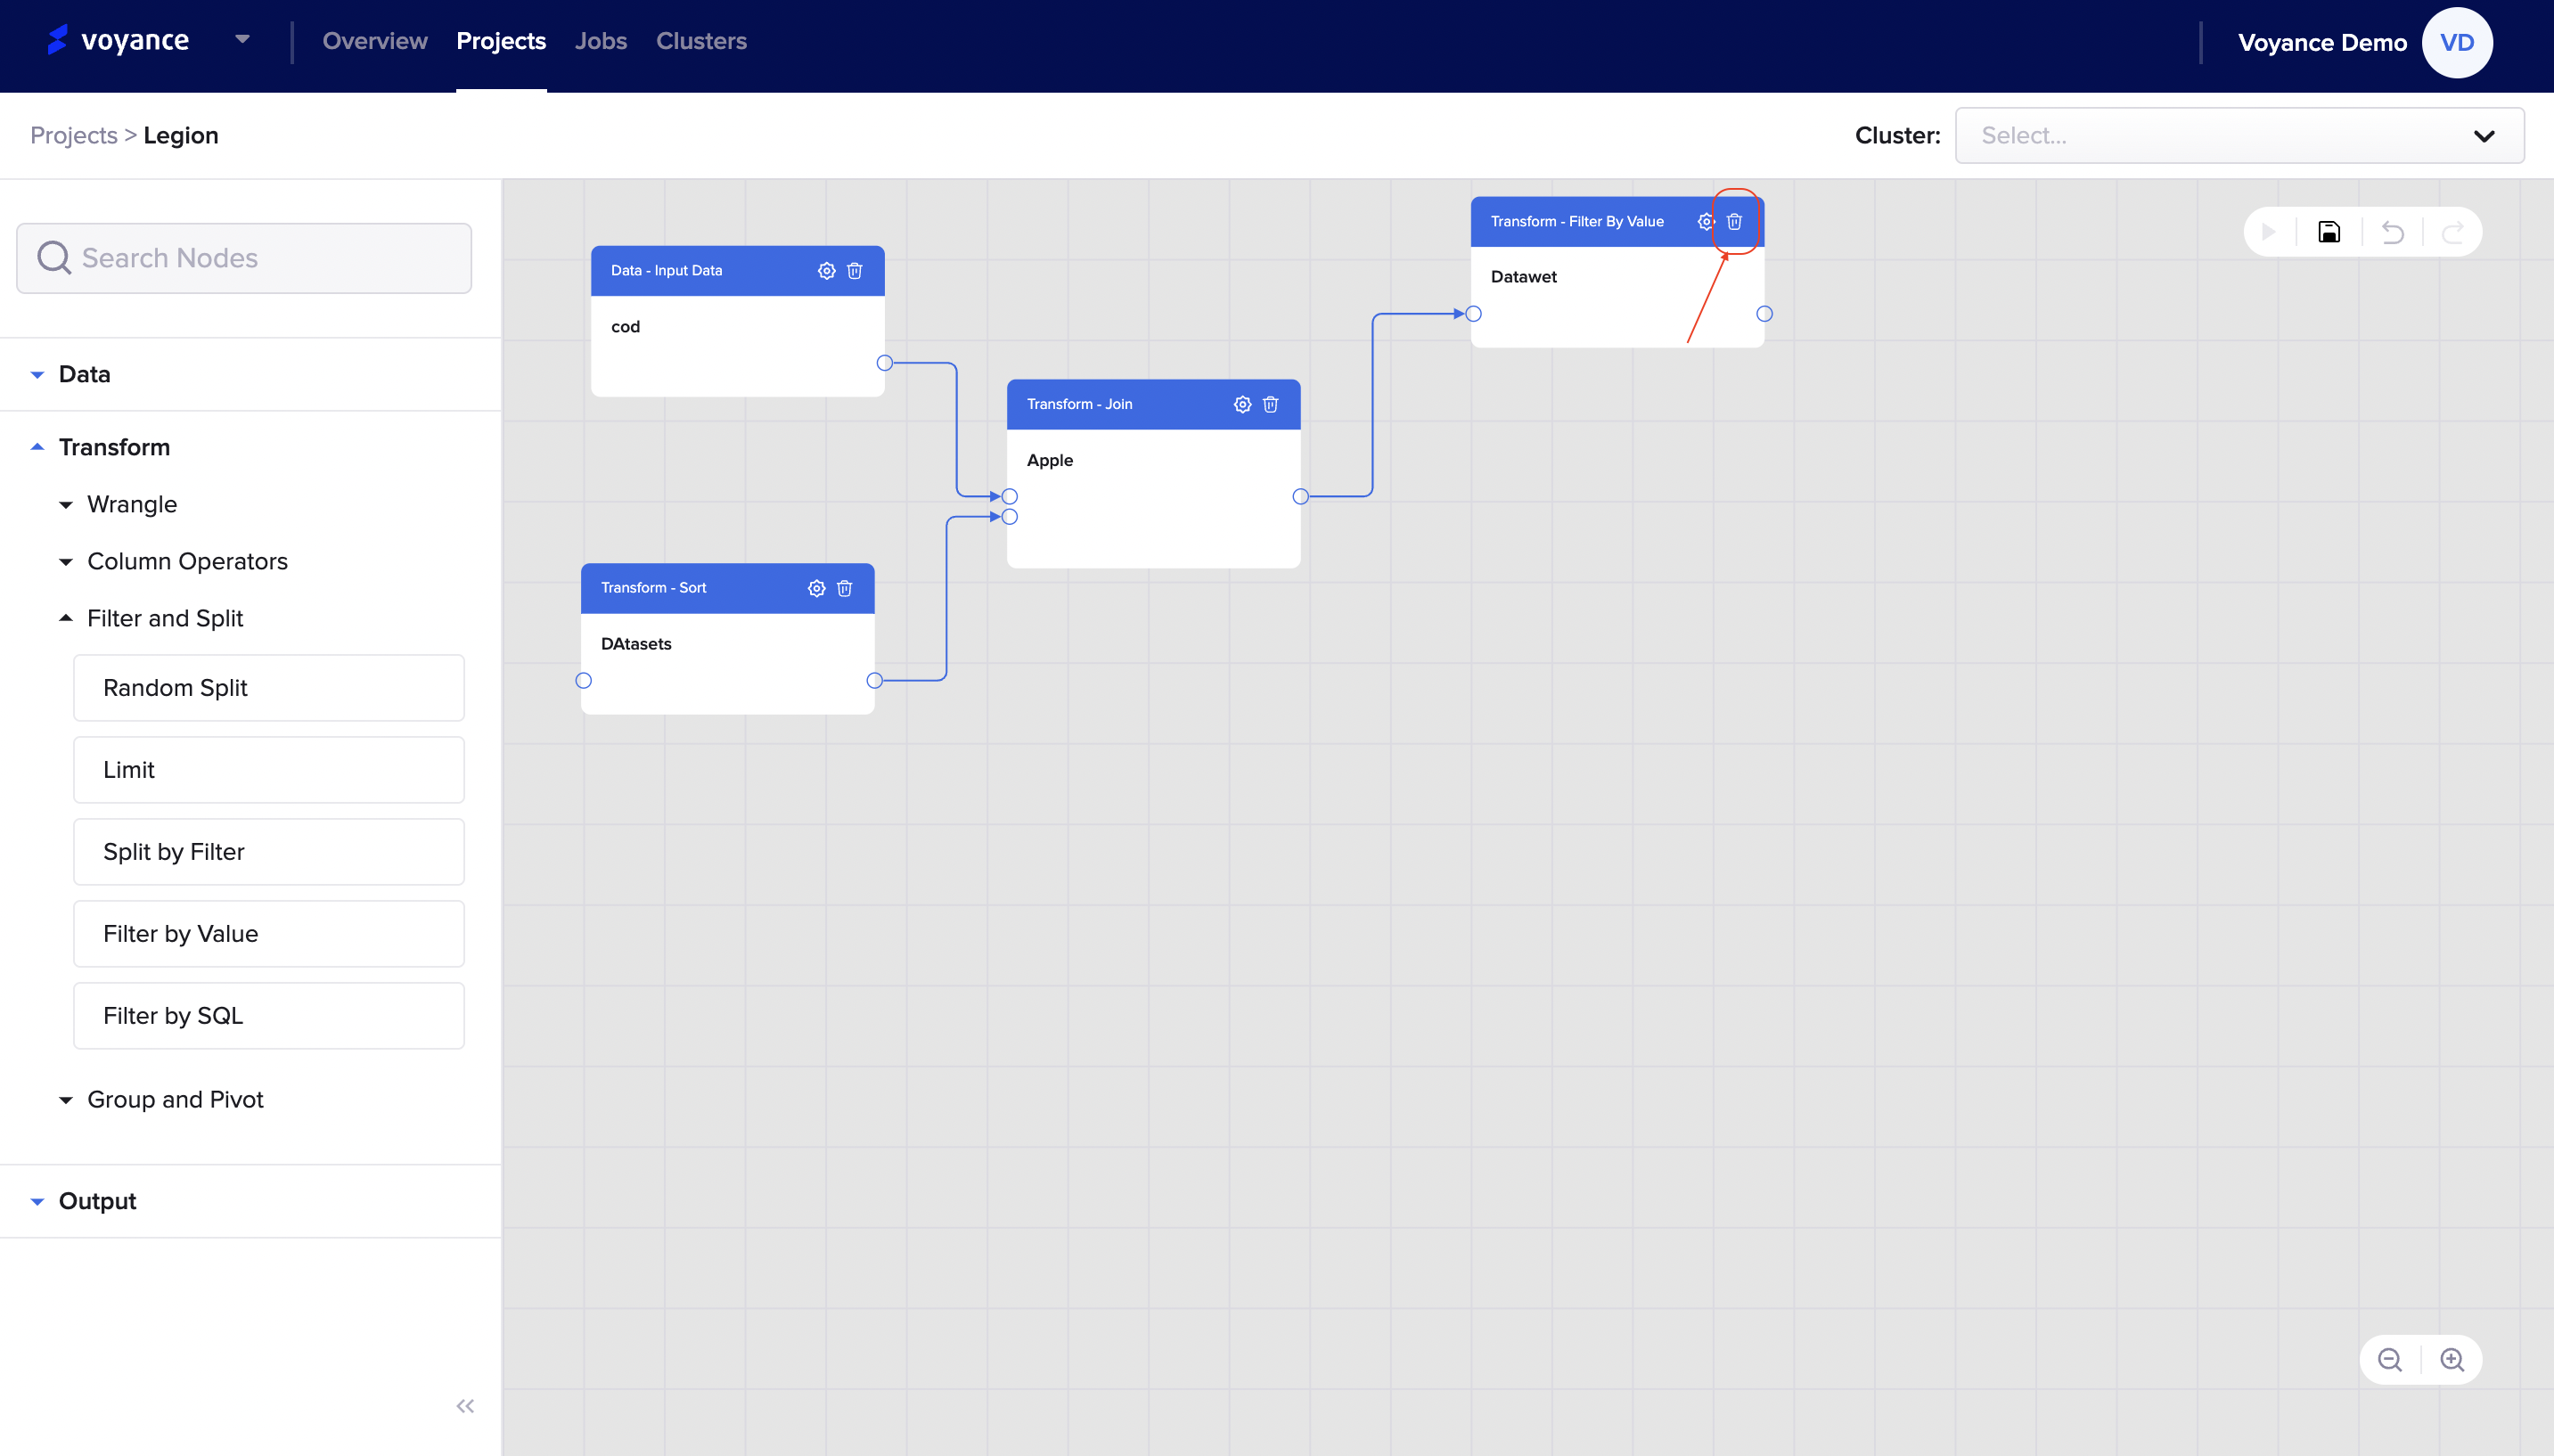
Delete a filter by value feature
To delete a filter by value dialog box on the project workflow, click on the "delete icon" at the top of the dialog box in the project workflow.
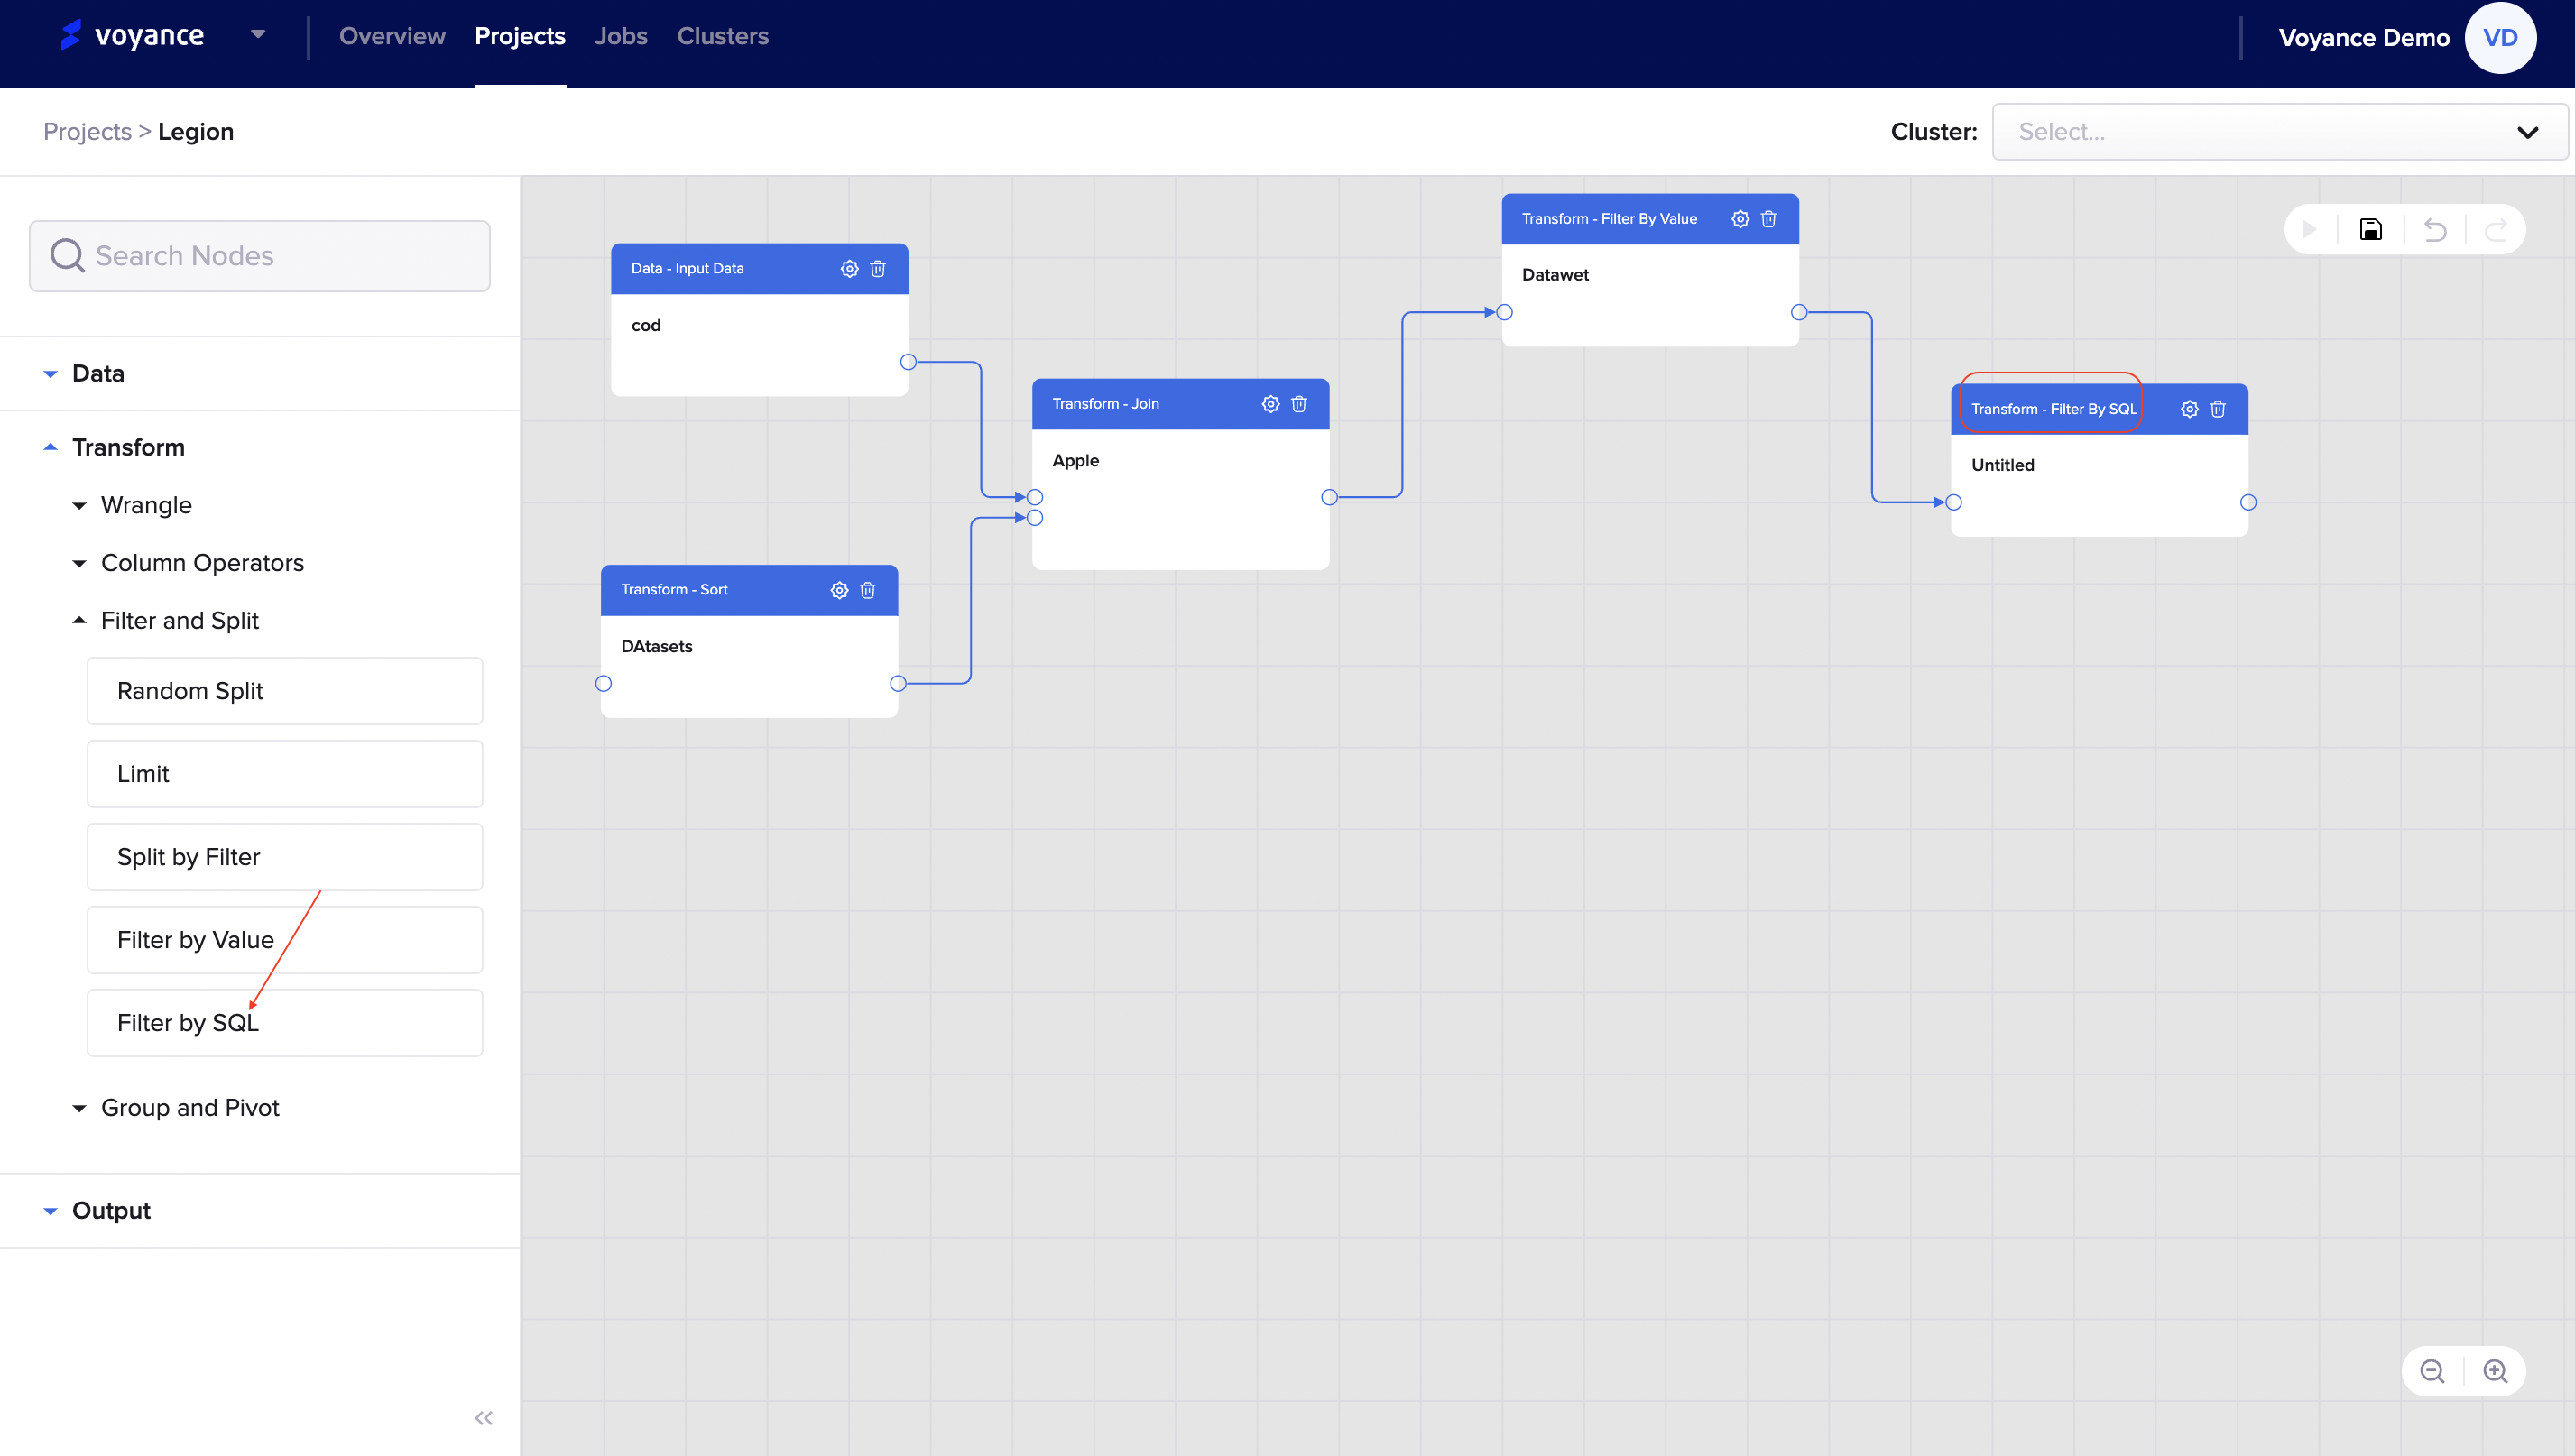
Filter by SQL
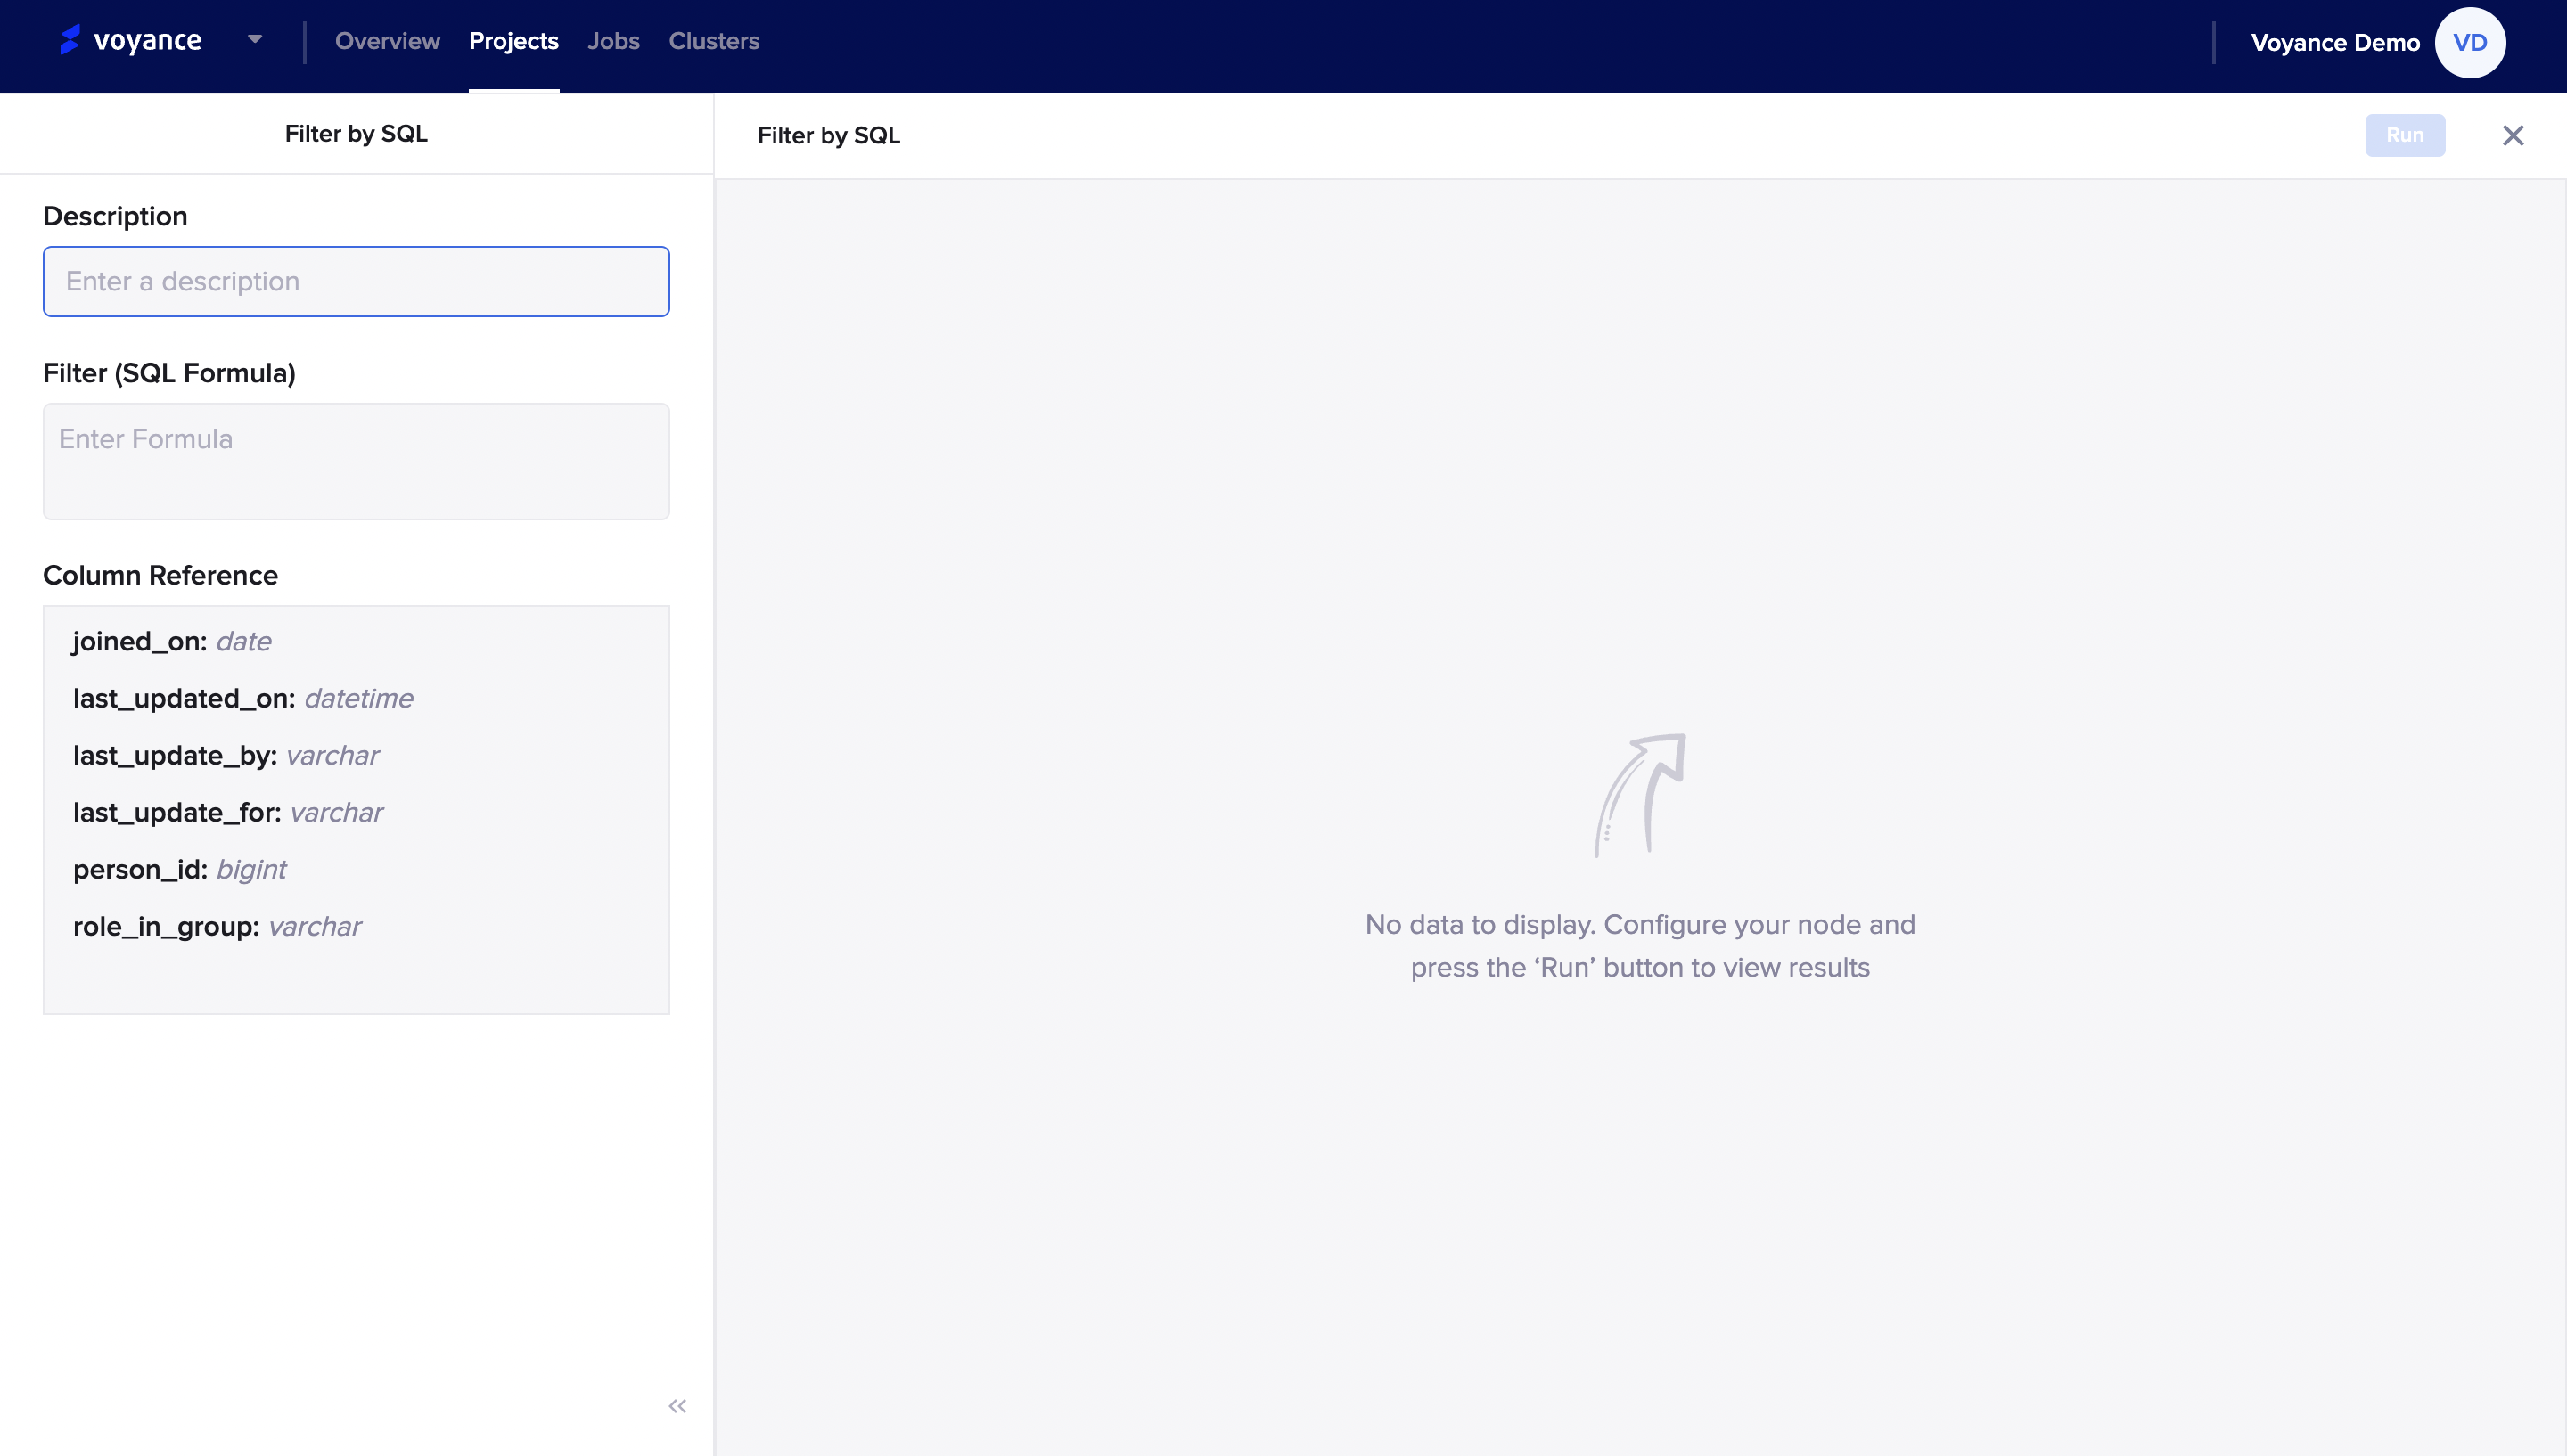
To filter by SQL, click and drag the "Filter by SQL tab to the workflow to be able to perform nodes configuration.
Edit the filter by SQL
To edit the dialog box to perform configuration, click on the "settings icon to fill in the parameters for the configuration.
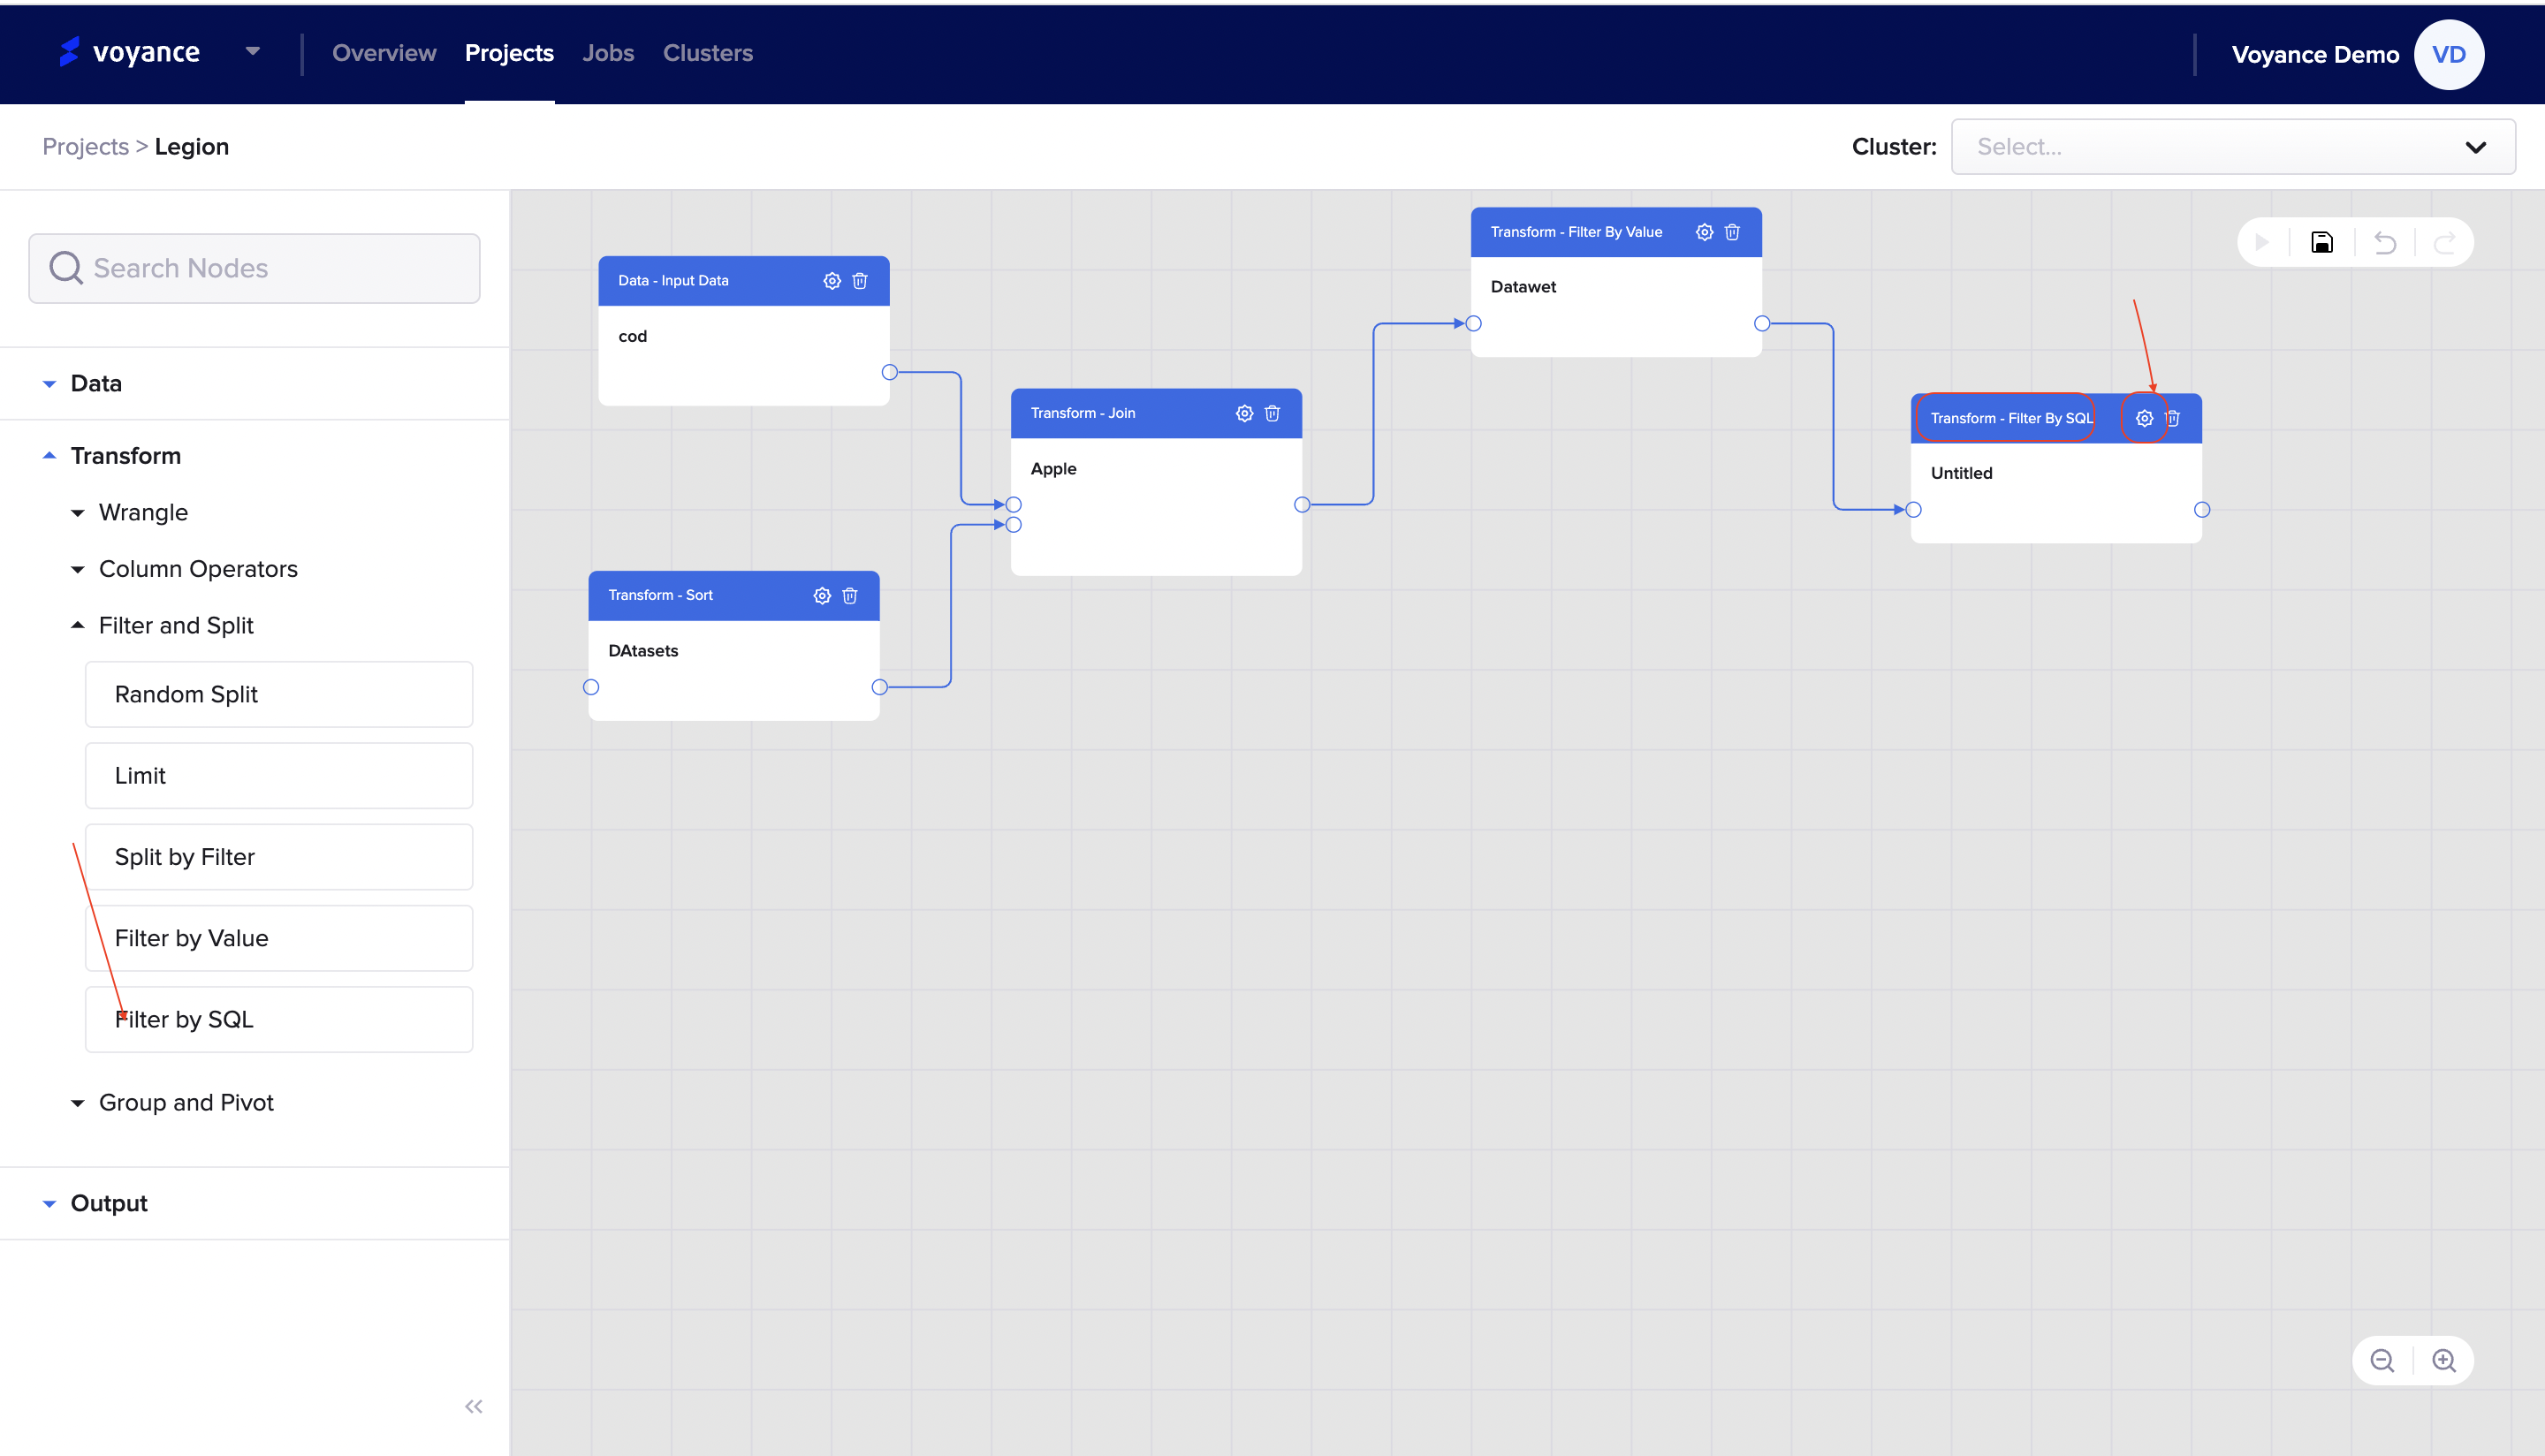
it redirects you to the filter by SQL page, fill in the parameter on the left corner of the page with data to perform nodes configuration.
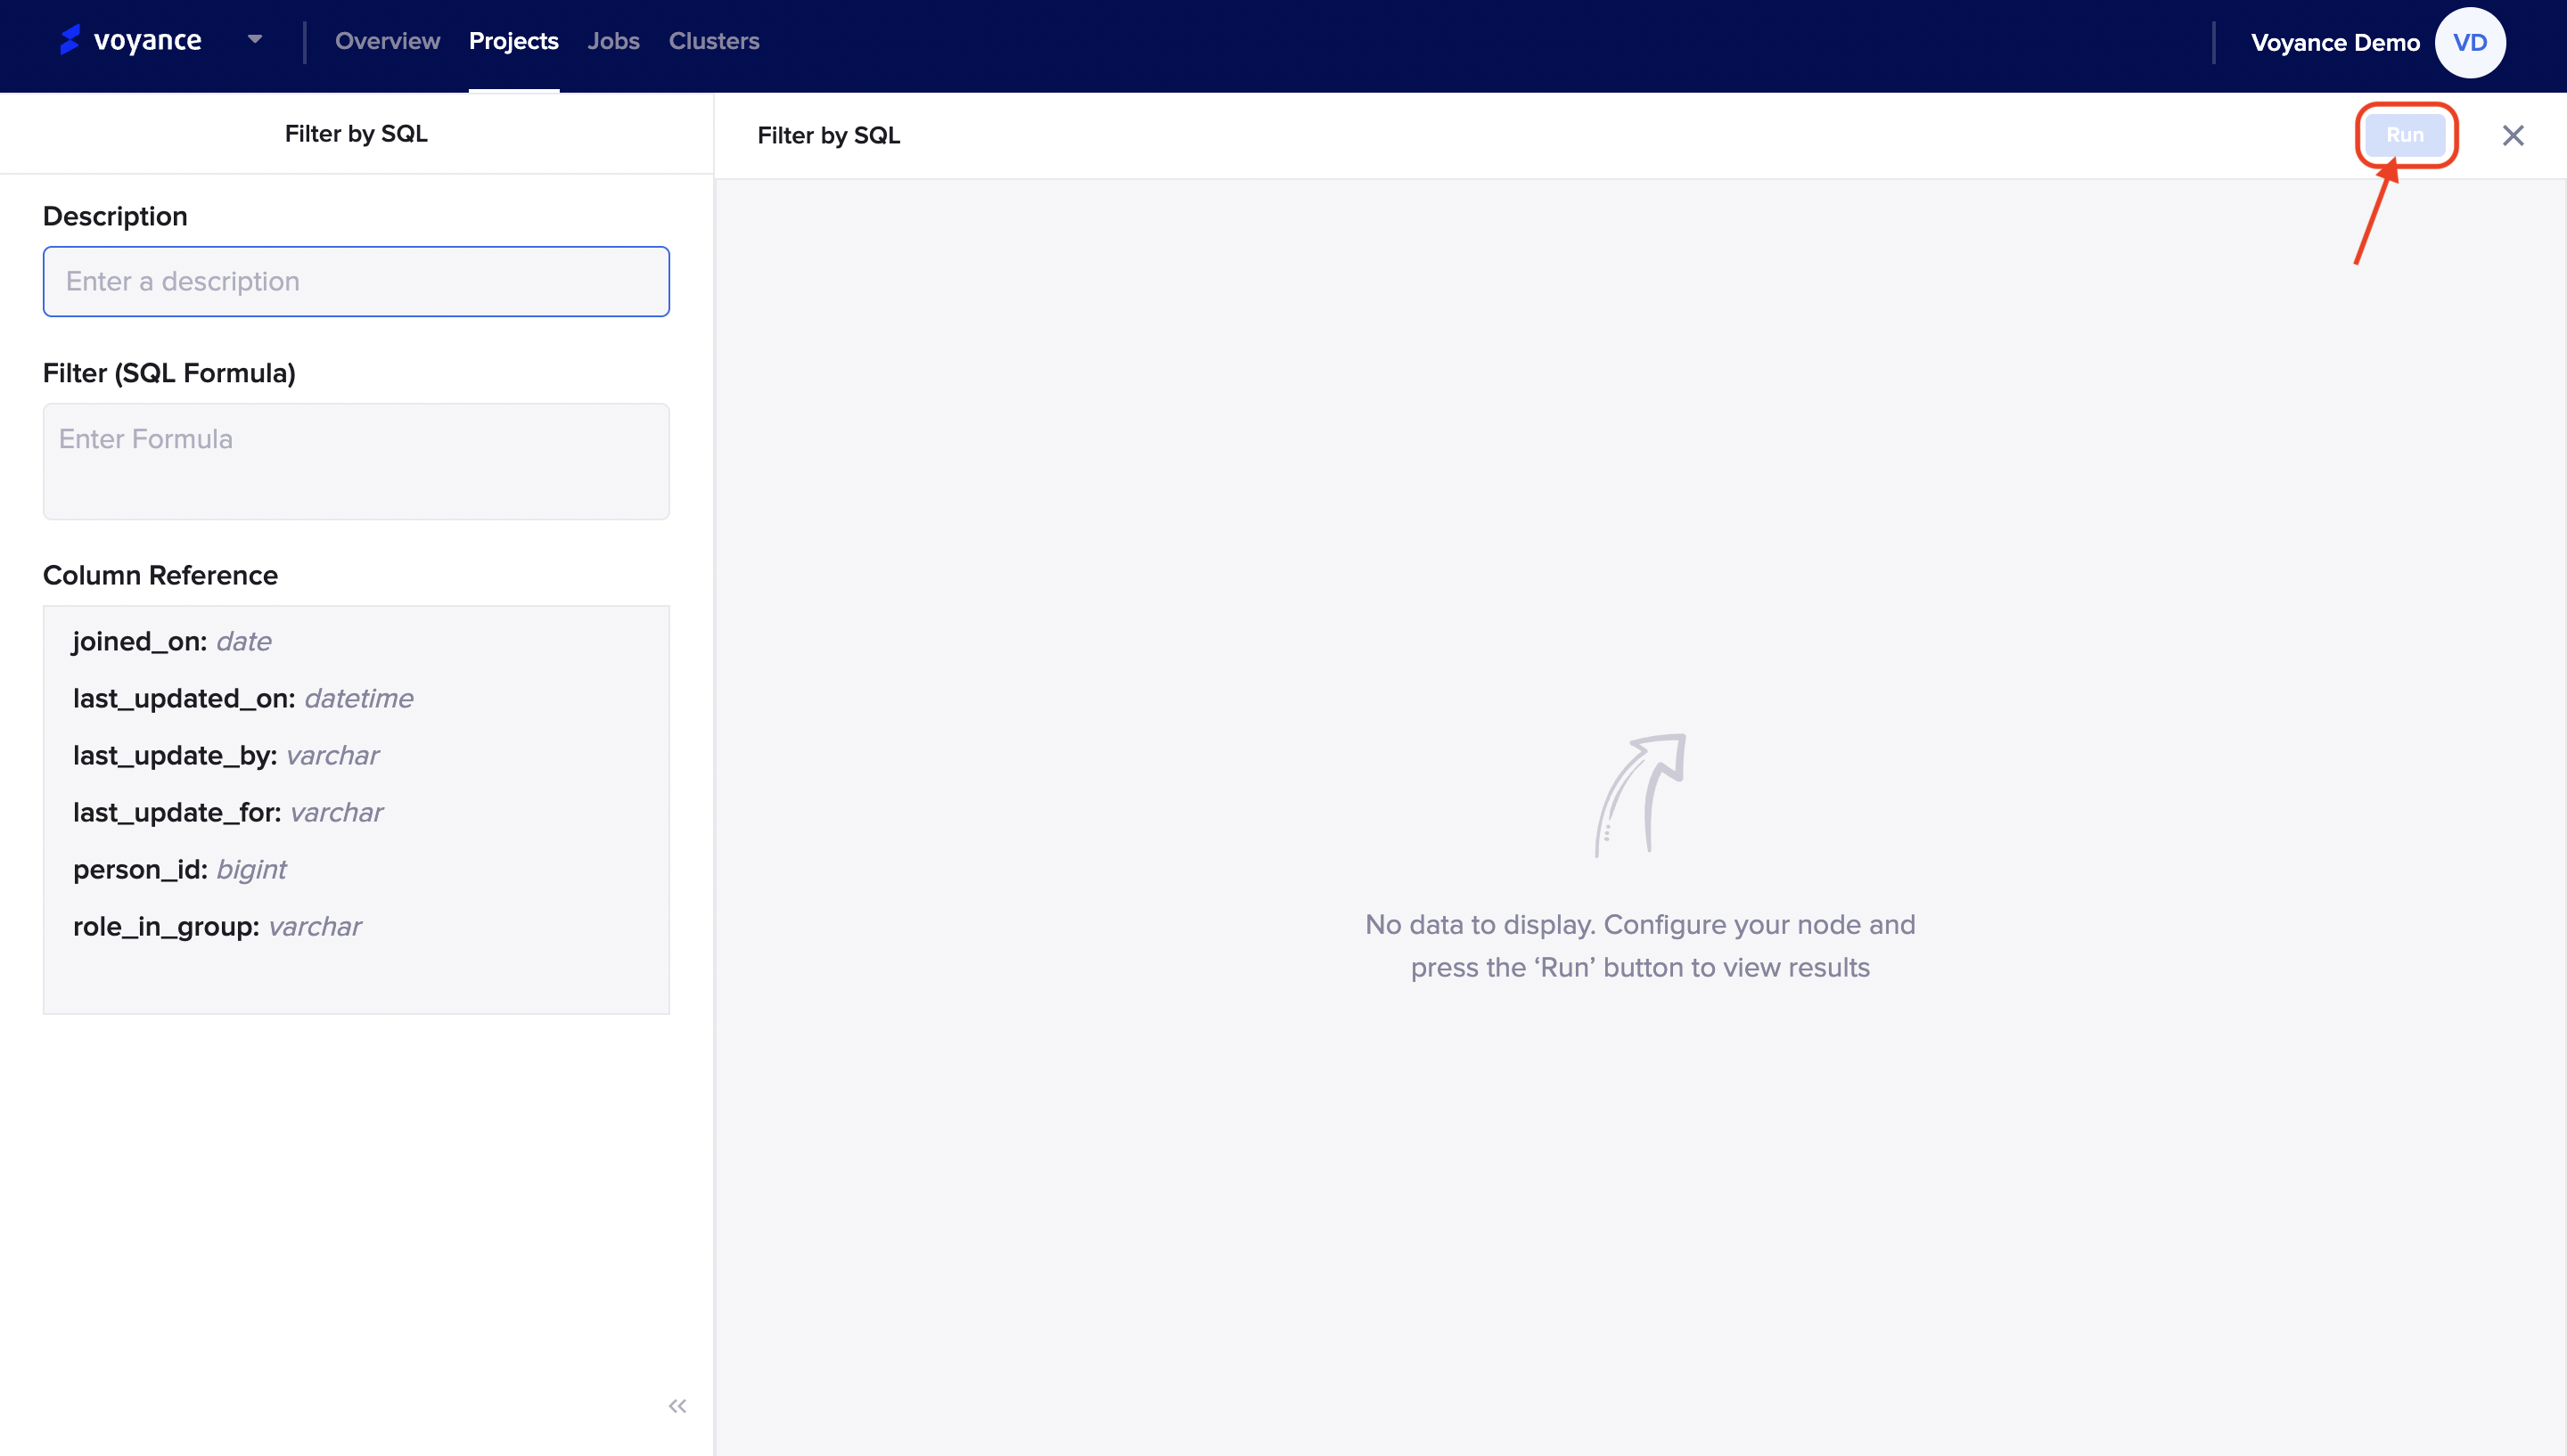
Run program
To view the result of your node's configuration, click on the "Run" tab at the top-right of the filter by value page to analyze and view the result of the configuration.
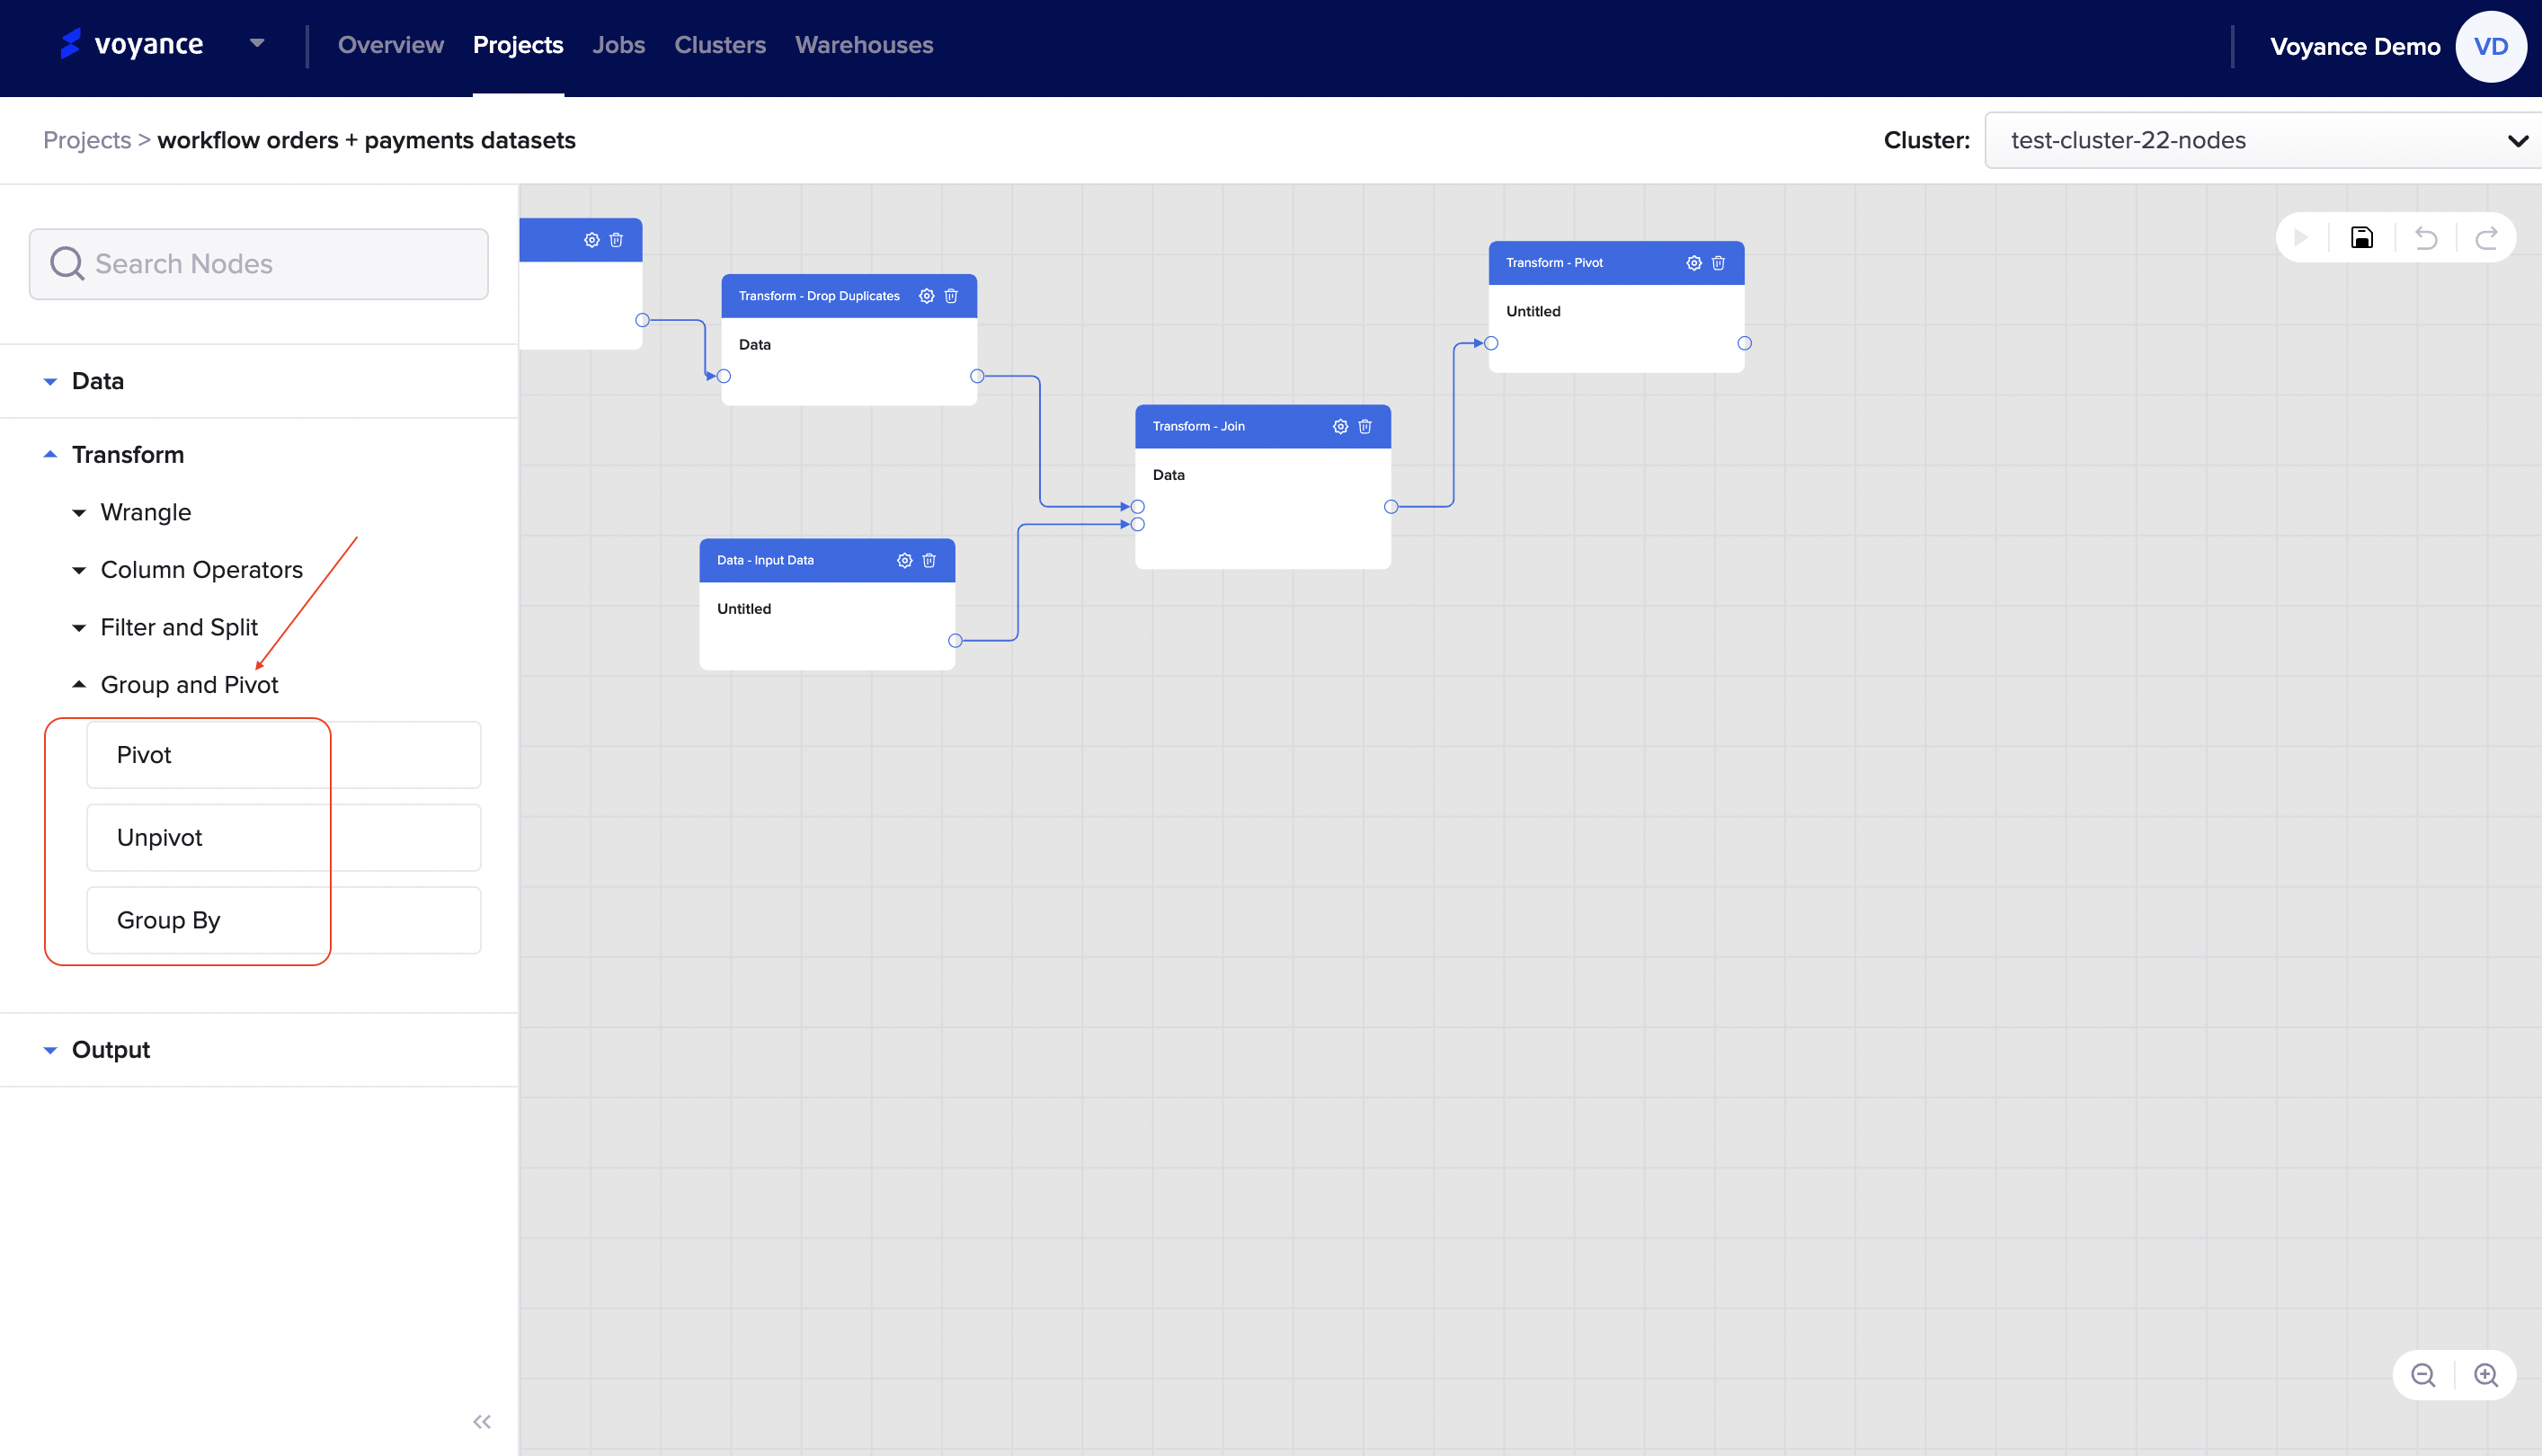
Transform by Group and Pivot
The group and pivot transform tools are processing tools that enable you to query, organize and summarize data between tables or databases. Under the Group and pivot operator drop-down arrow, we have the "Pivot, Unpivot and Group by" that can be used to perform your data transformation process.
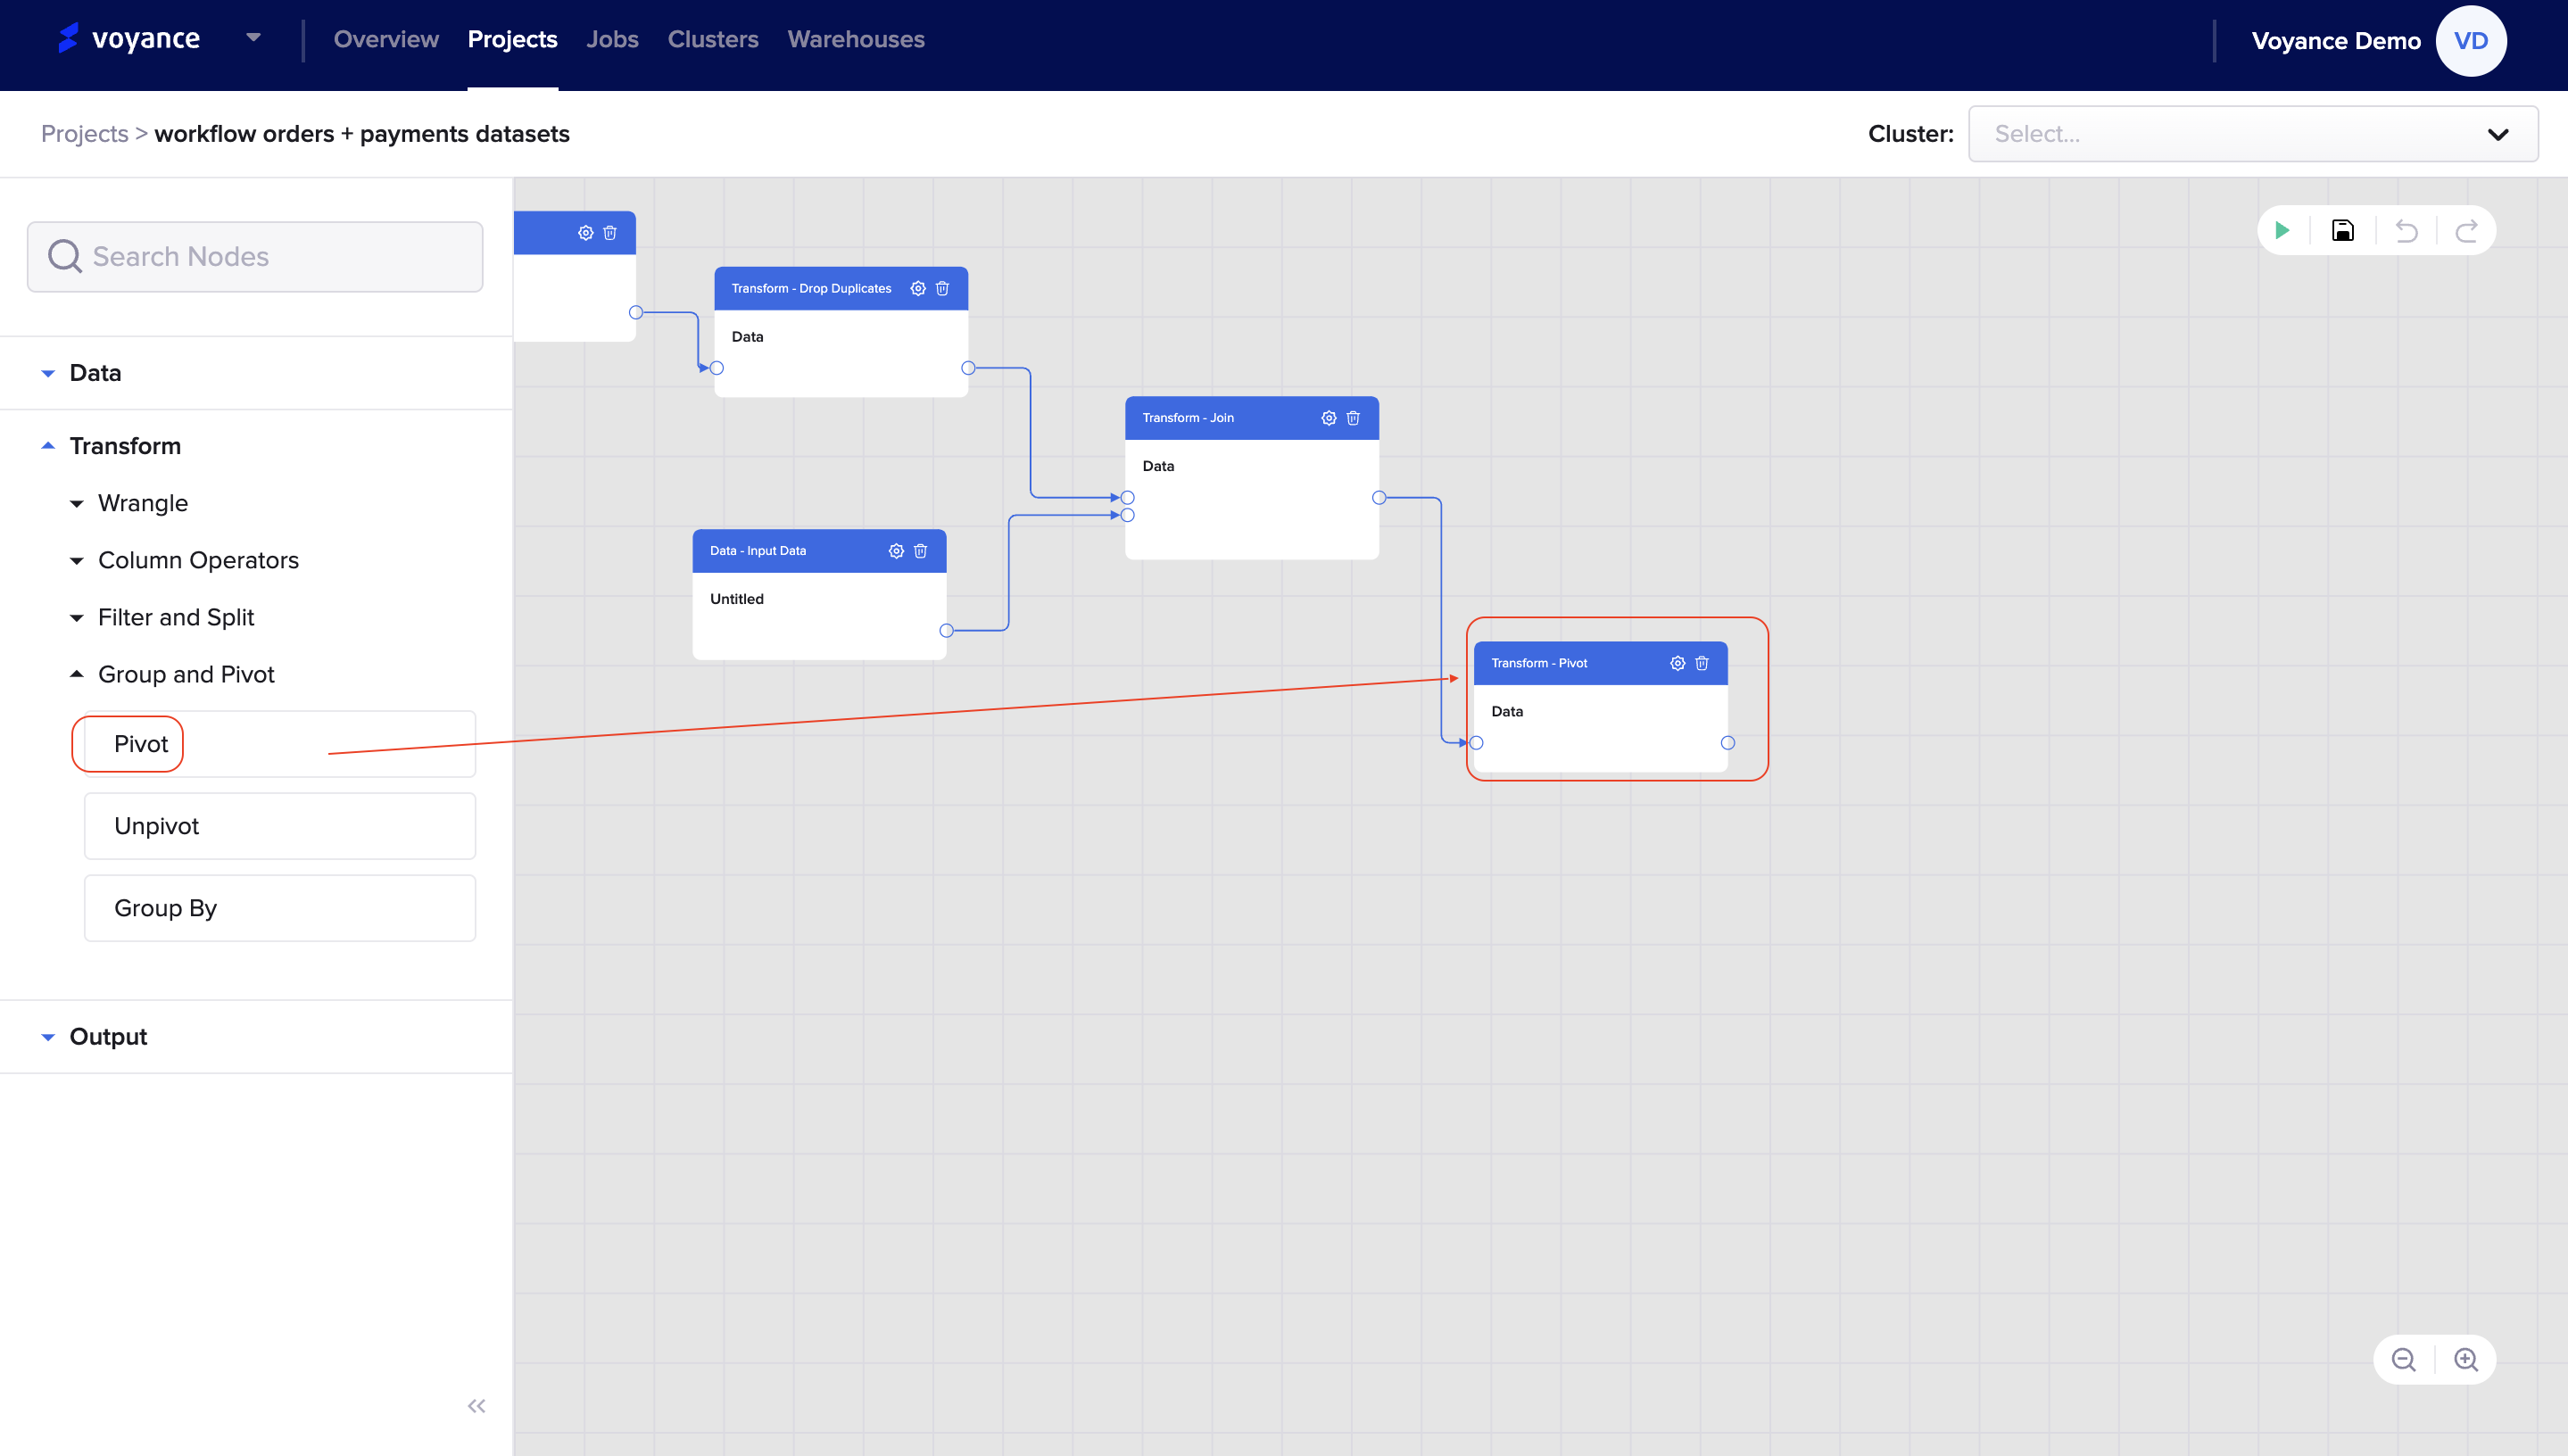
Pivot
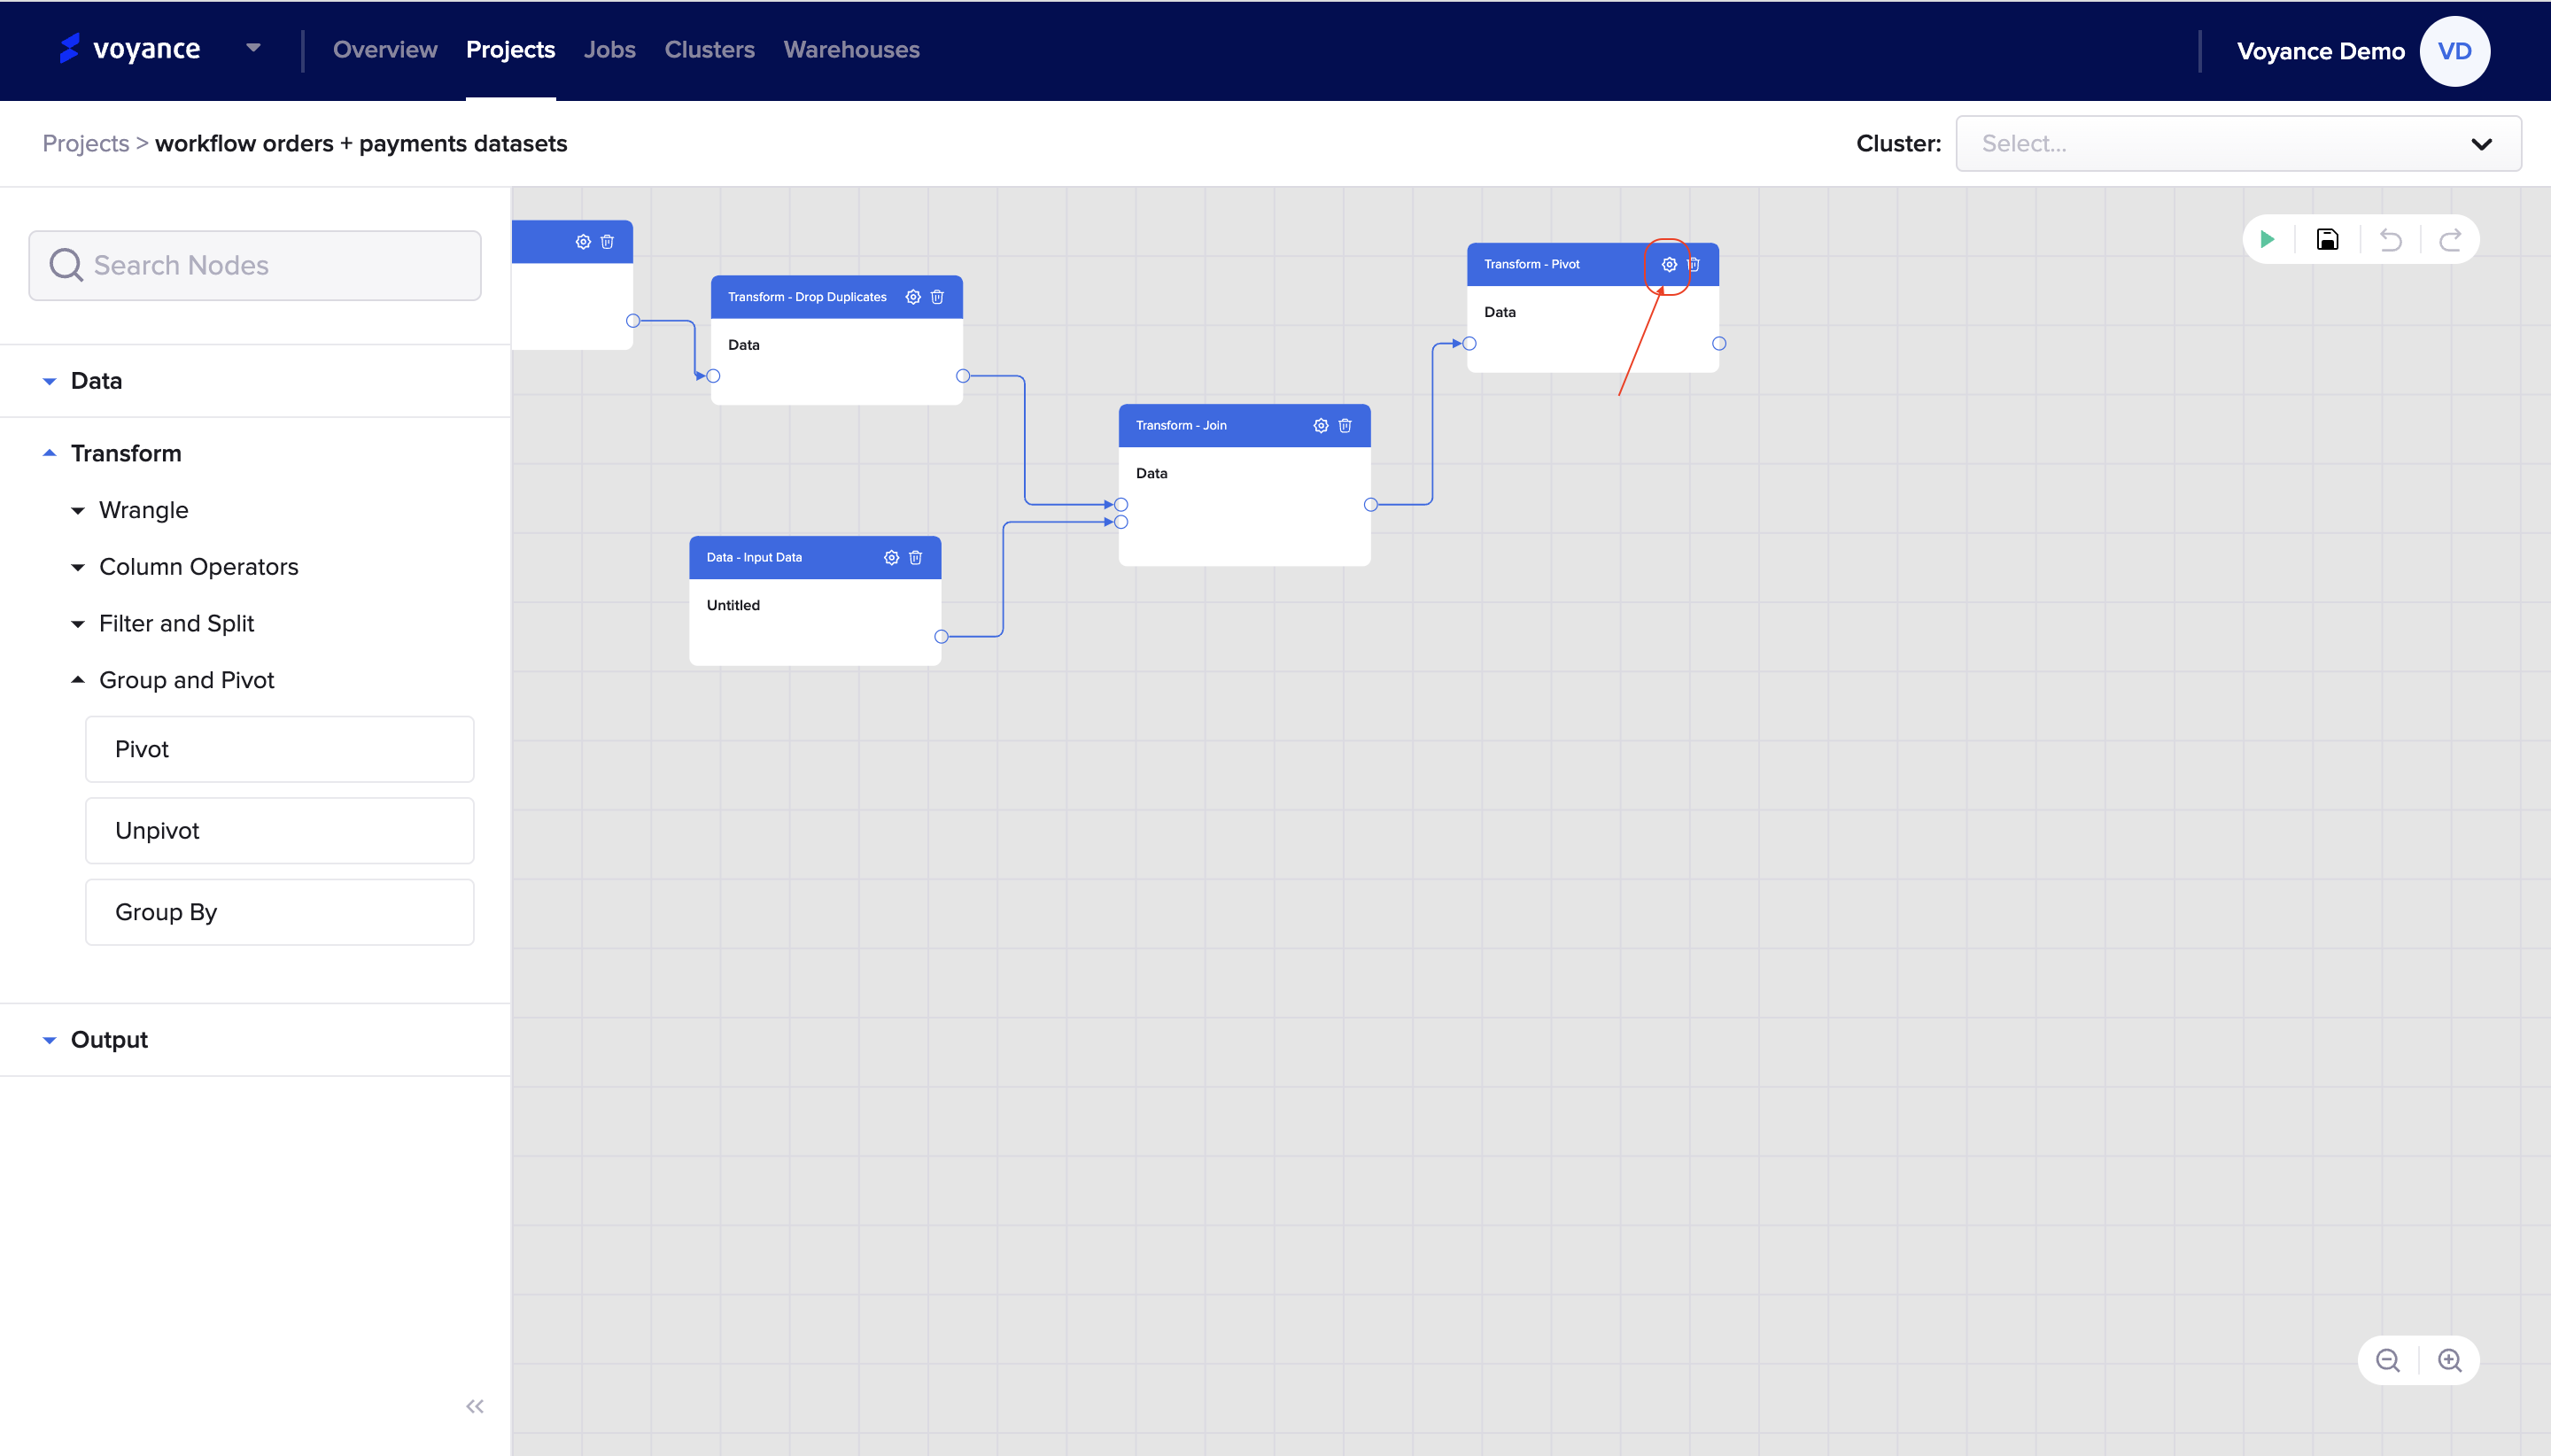
The pivot operator enables you to turn multiple rows of data into one, denormalizing a data set into a more compact version by rotating the input data on a column value. To transform by pivot operator, click and drag the "pivot operators dialog box" to the workflow to perform nodes configurations
Edit Pivot operator
To edit the pivot operator dialog box, click on the "settings icon" at the top of the dialog box
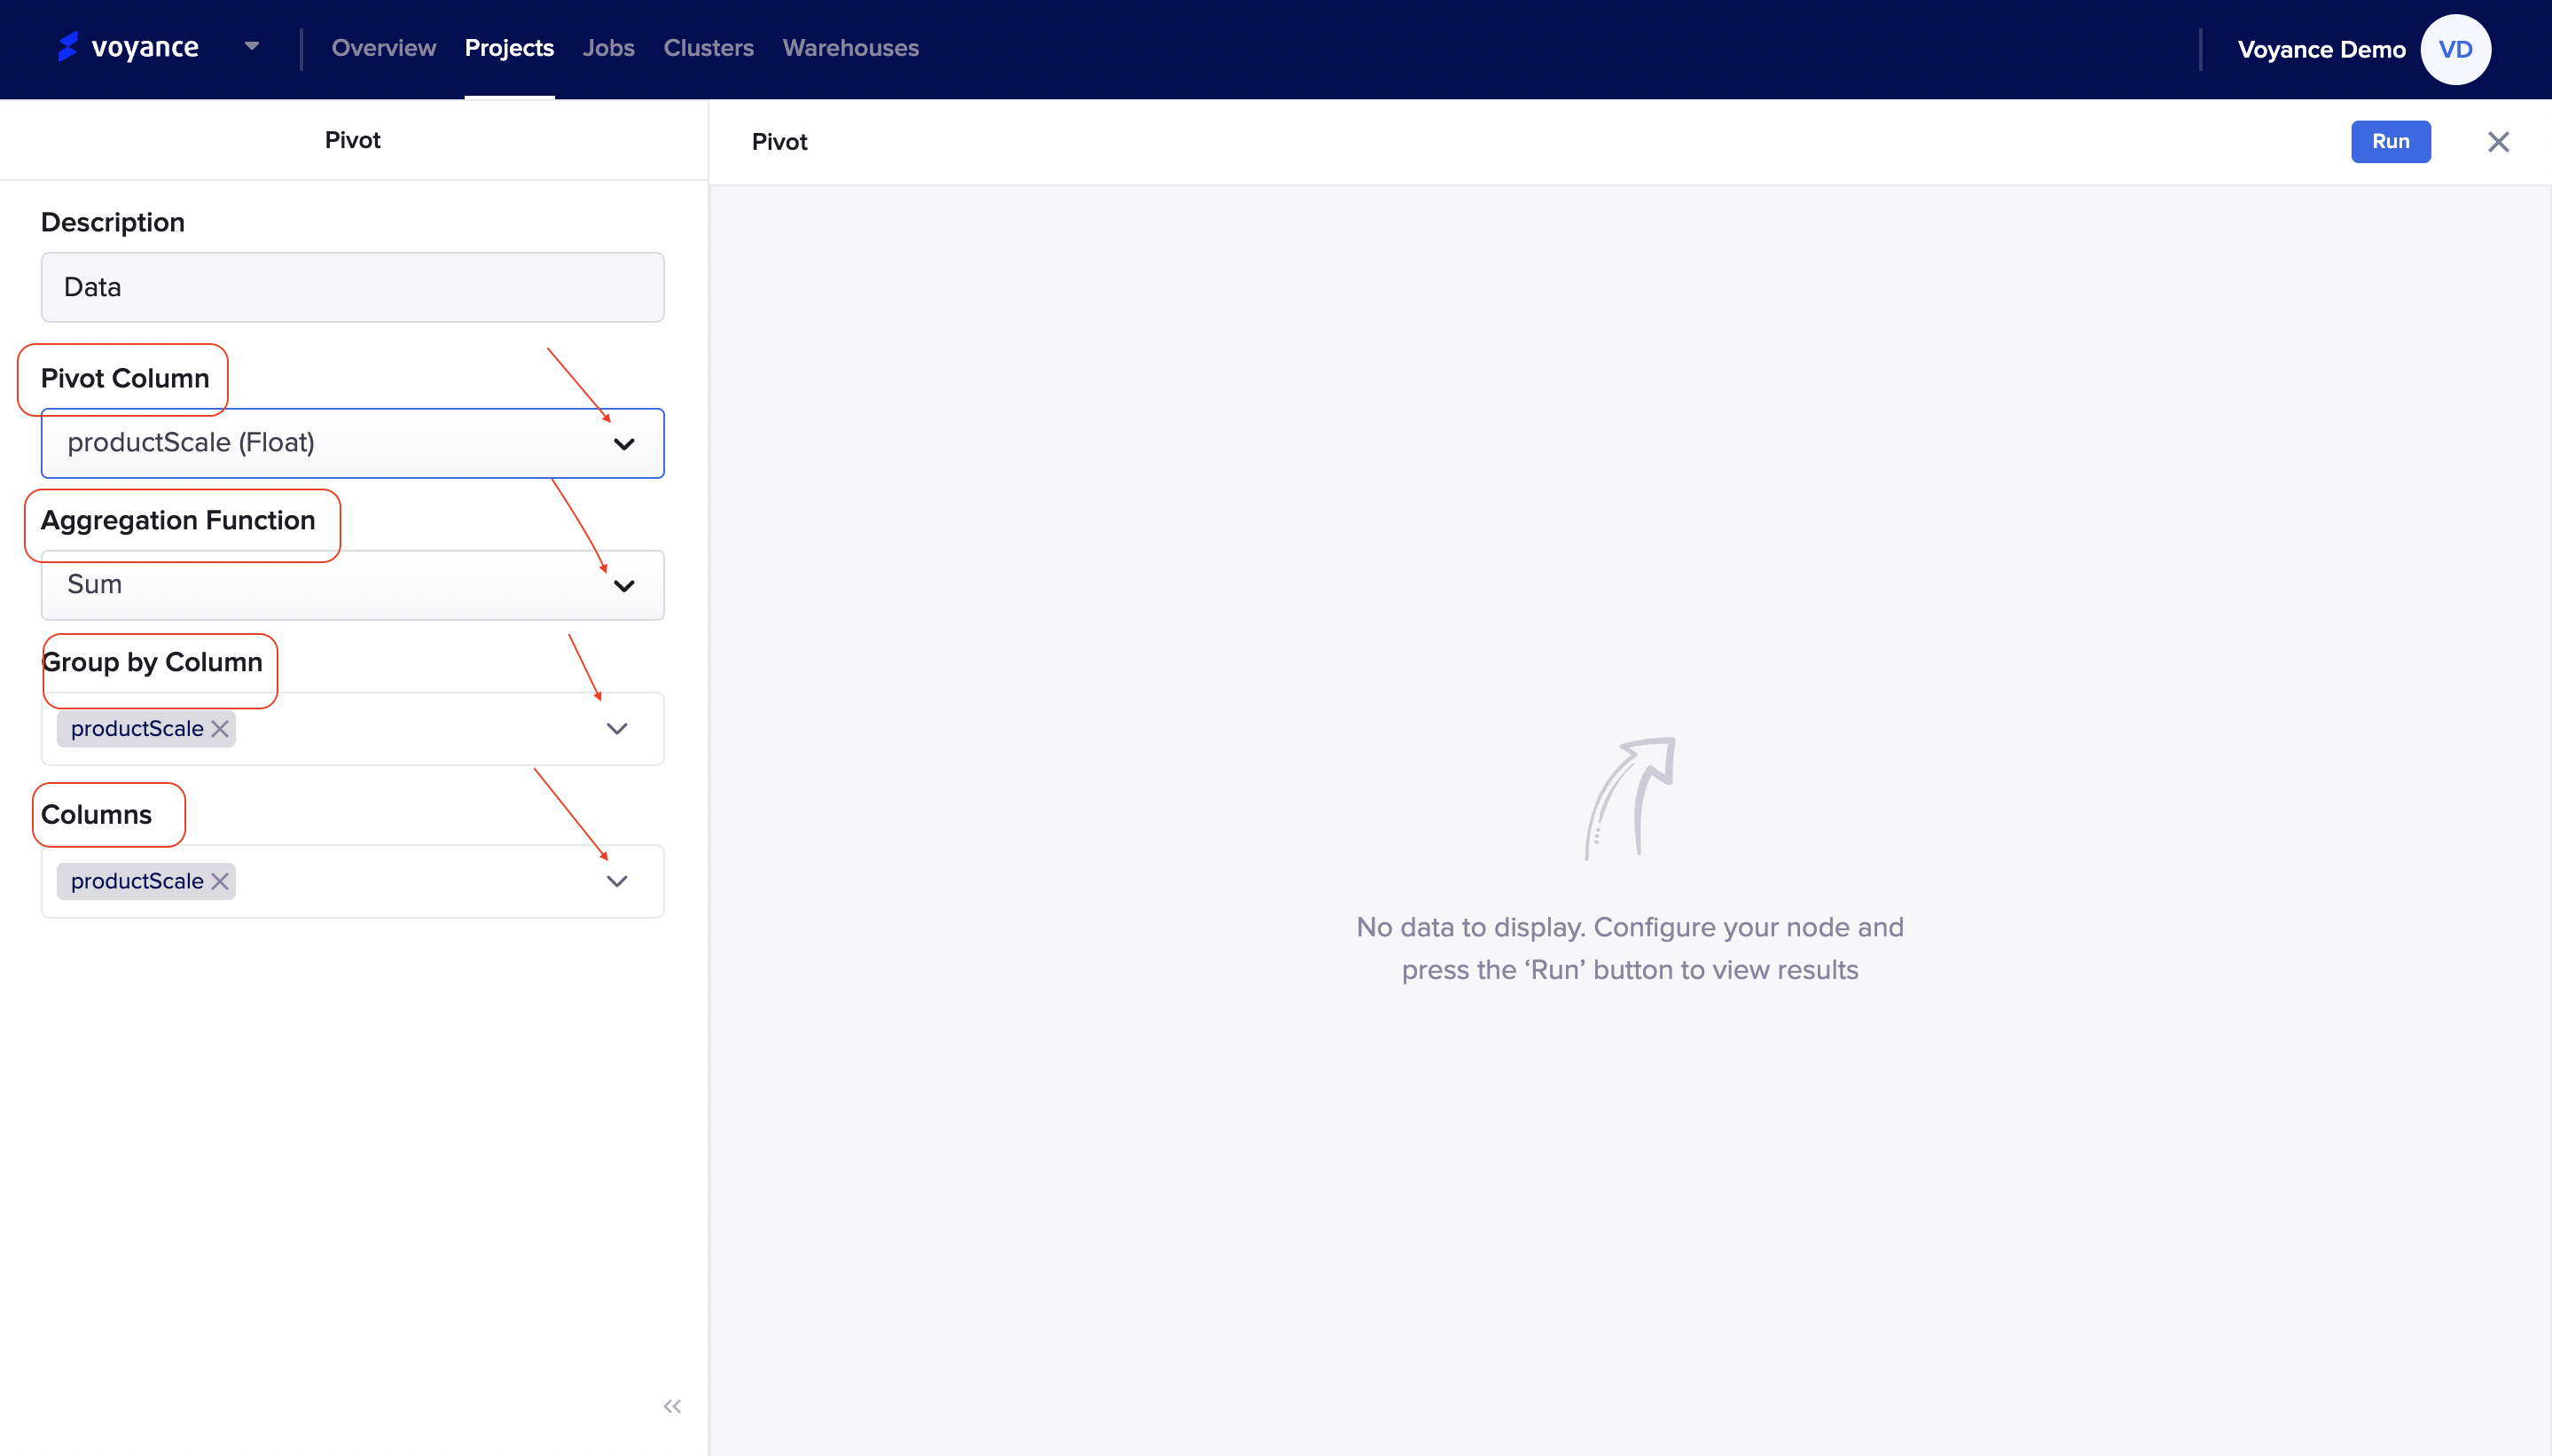
it redirects you to the pivot page where you can configure your data based on the parameters/fields displayed on the page. The page contains the following parameters:
Description: This is giving a title or a description to the pivot operator page.
Pivot column: Select a pivot column for your configuration. To select a pivot column, click on the drop-down and select a column
Aggregation function: You need to select an aggregation function, to choose a function, click on the drop-down arrow to select a function for the pivot. some of the functions under the aggregation functions include "Average, Minimum, Maximum, Sum, Sun distinct, Count, Count distinct"
Group by column: To select a group by column, click on the drop-down and mark the checkbox(es) you want to use for the grouping. you have the option of selecting all the columns for the grouping.
Column: Select the column for the pivot, click on the drop down and click on the checkbox(es) you want to use and you have the option of selecting all of the column checkboxes.
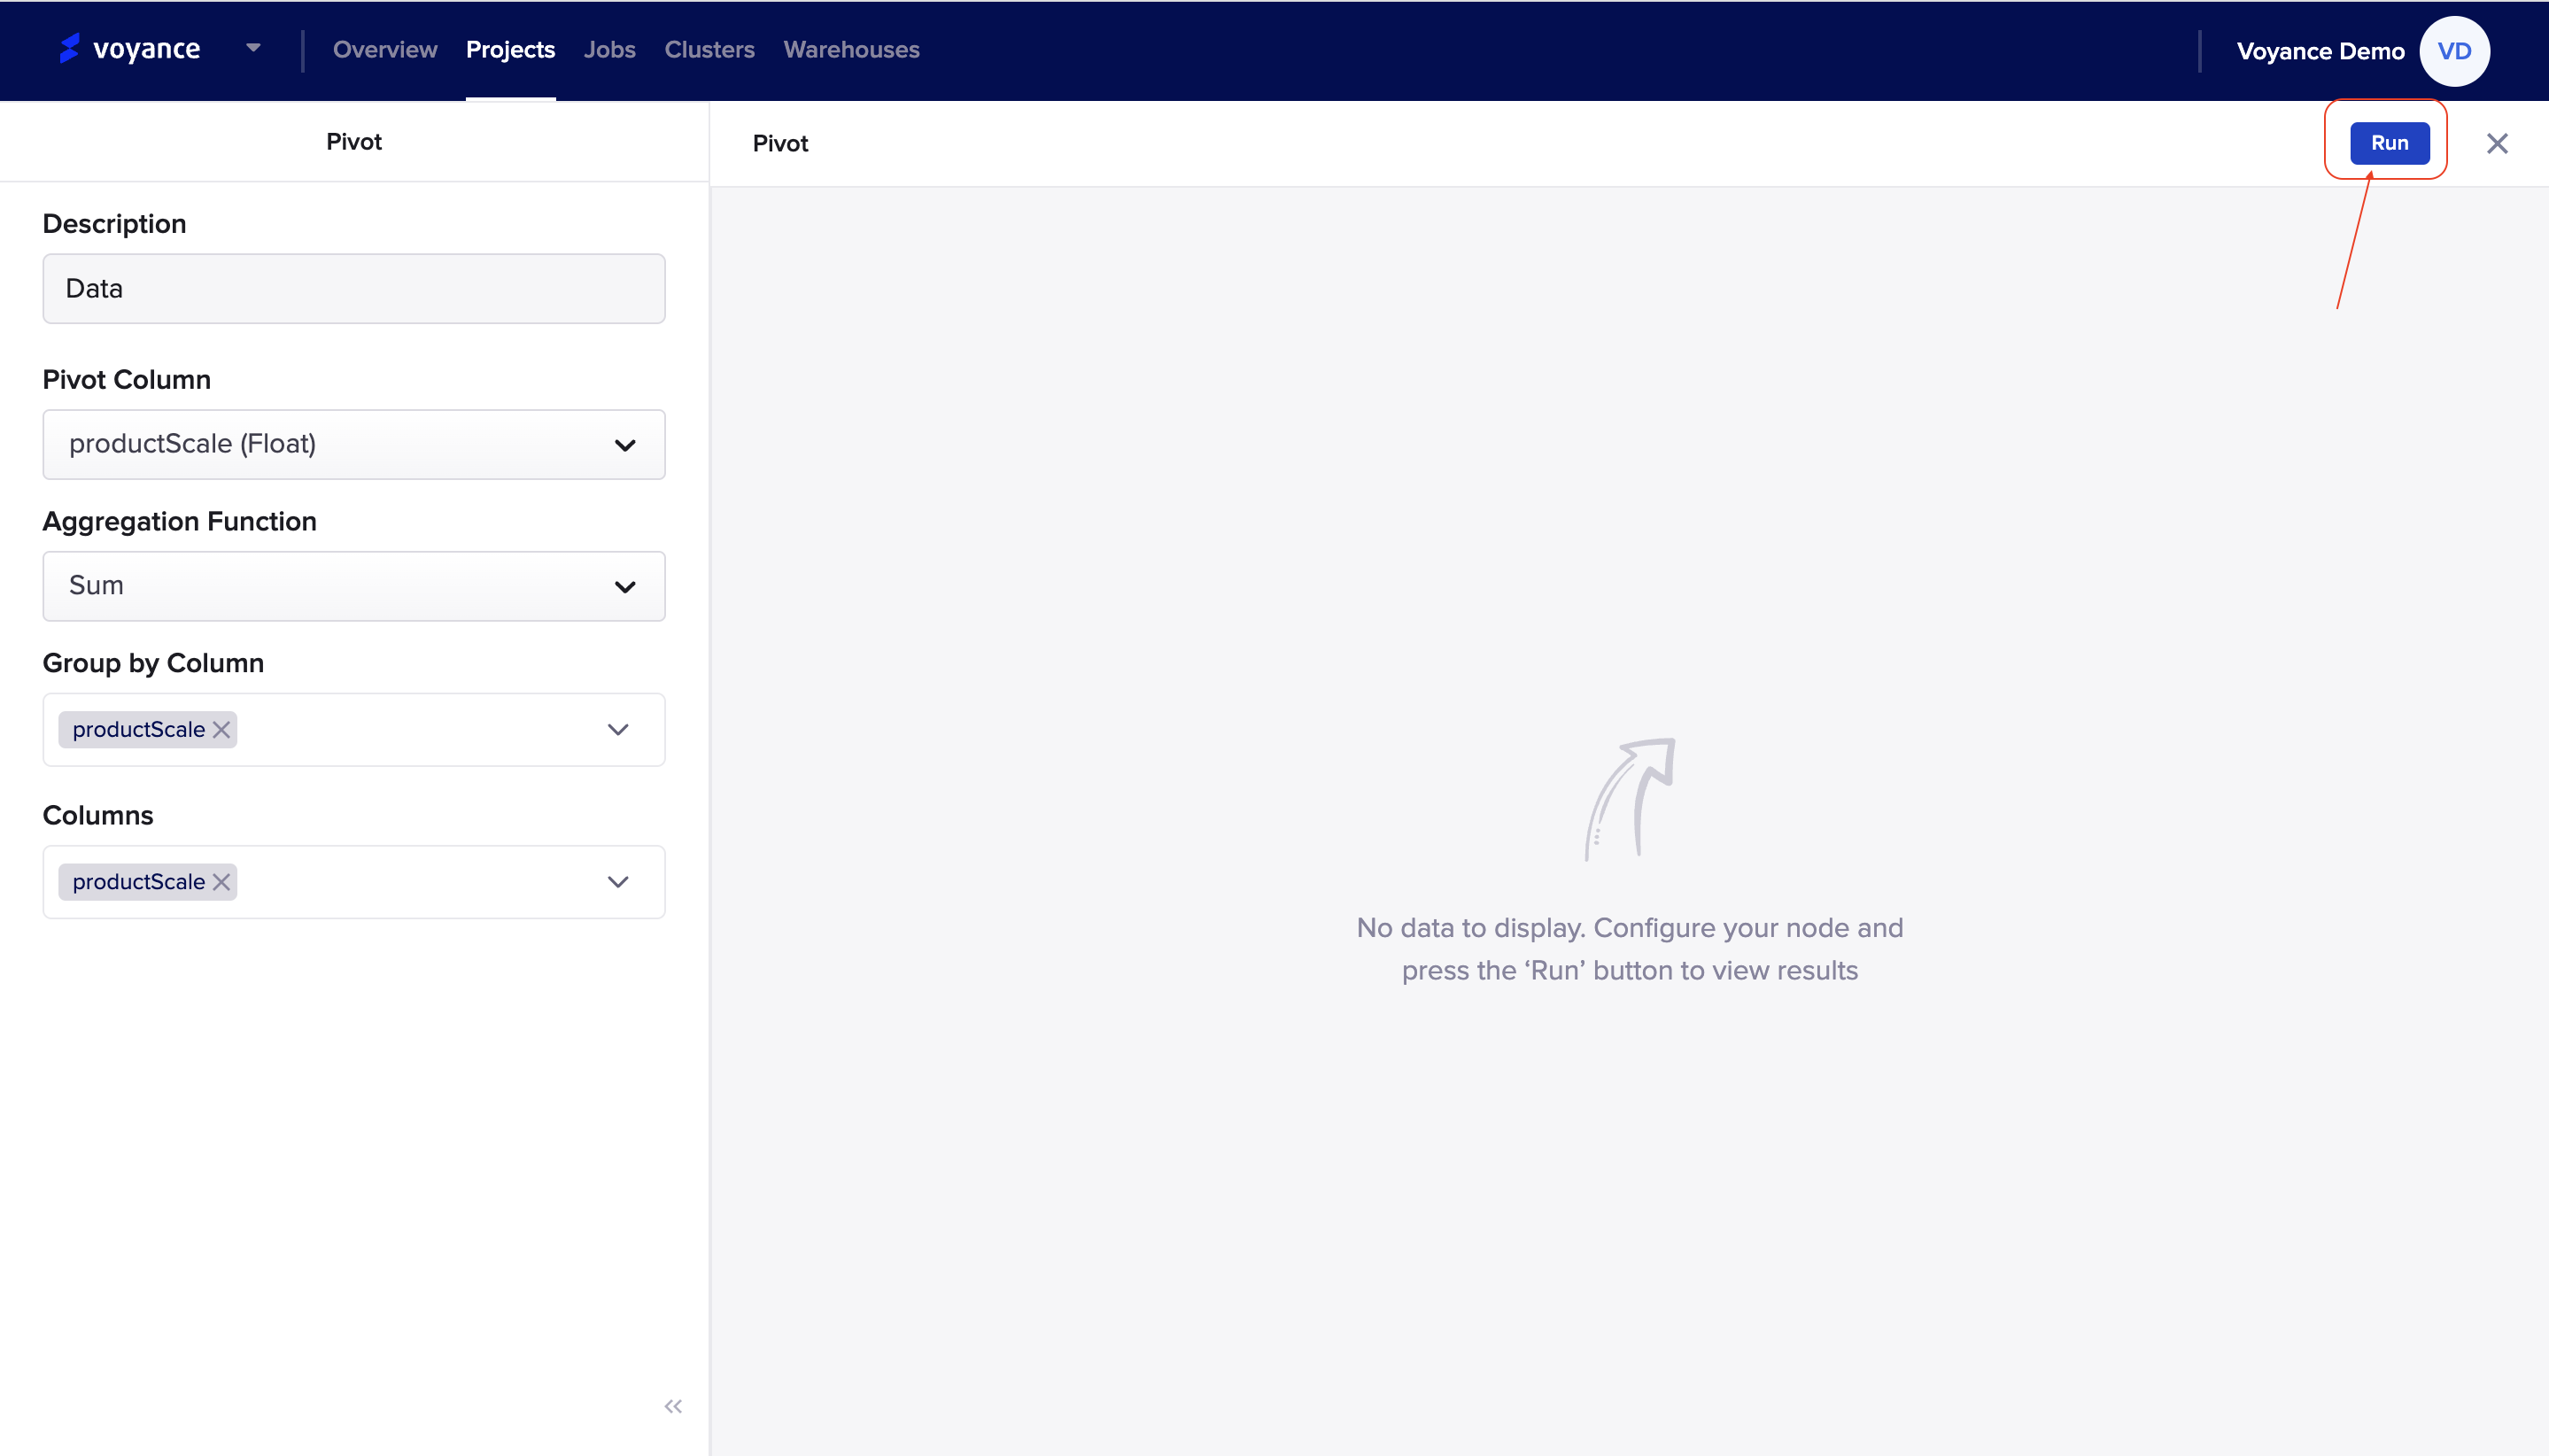
Run program
To view the result of your node's configuration, click on the "Run" tab at the top-right of the pivot page to analyze and view the result of the configuration.
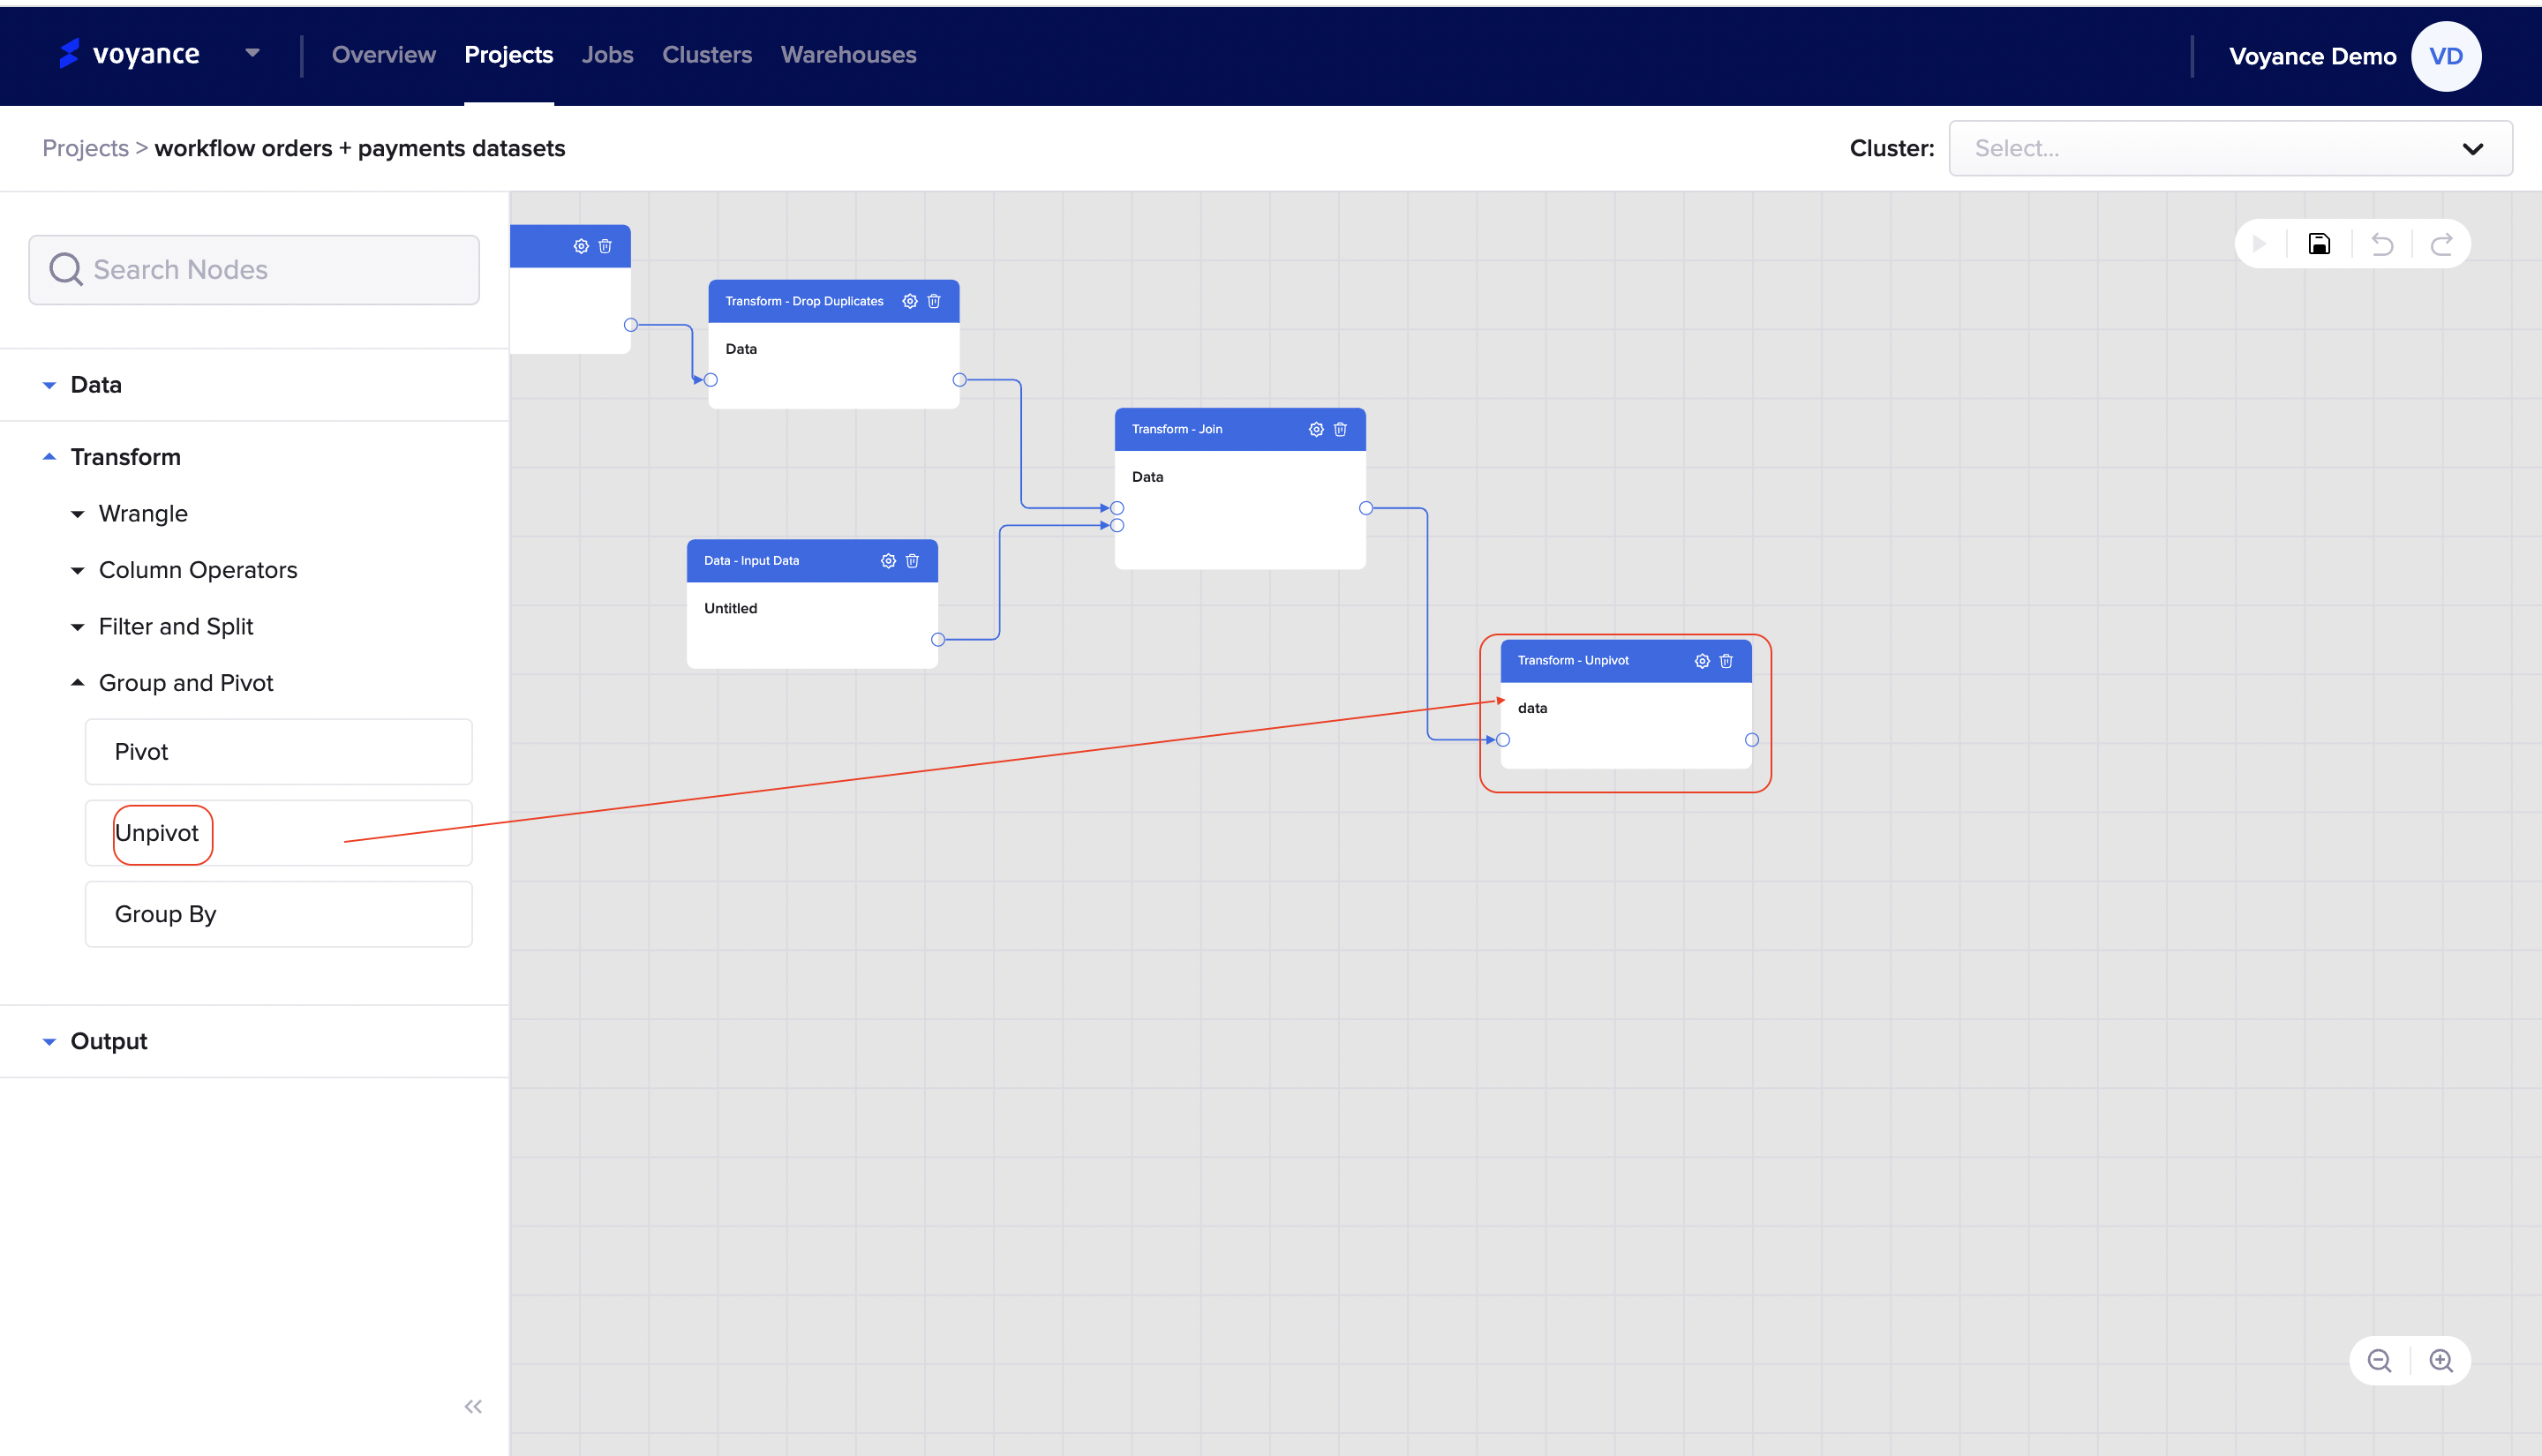
Unpivot
With our data platform, you can perform unpivot transformation, that is converting columns into rows, which normalises the dataset by expanding values in multiple columns in a single record into multiple records with the same values in a single column. To use unpivot operators for transformation, click and drag the "Unpivot operator" to the workflow to perform configuration.
Edit unpivot transform operator
To edit or configure the unpivot operator dialog box, click on the "settings icon at the top of the unpivot dialog box on the workflow
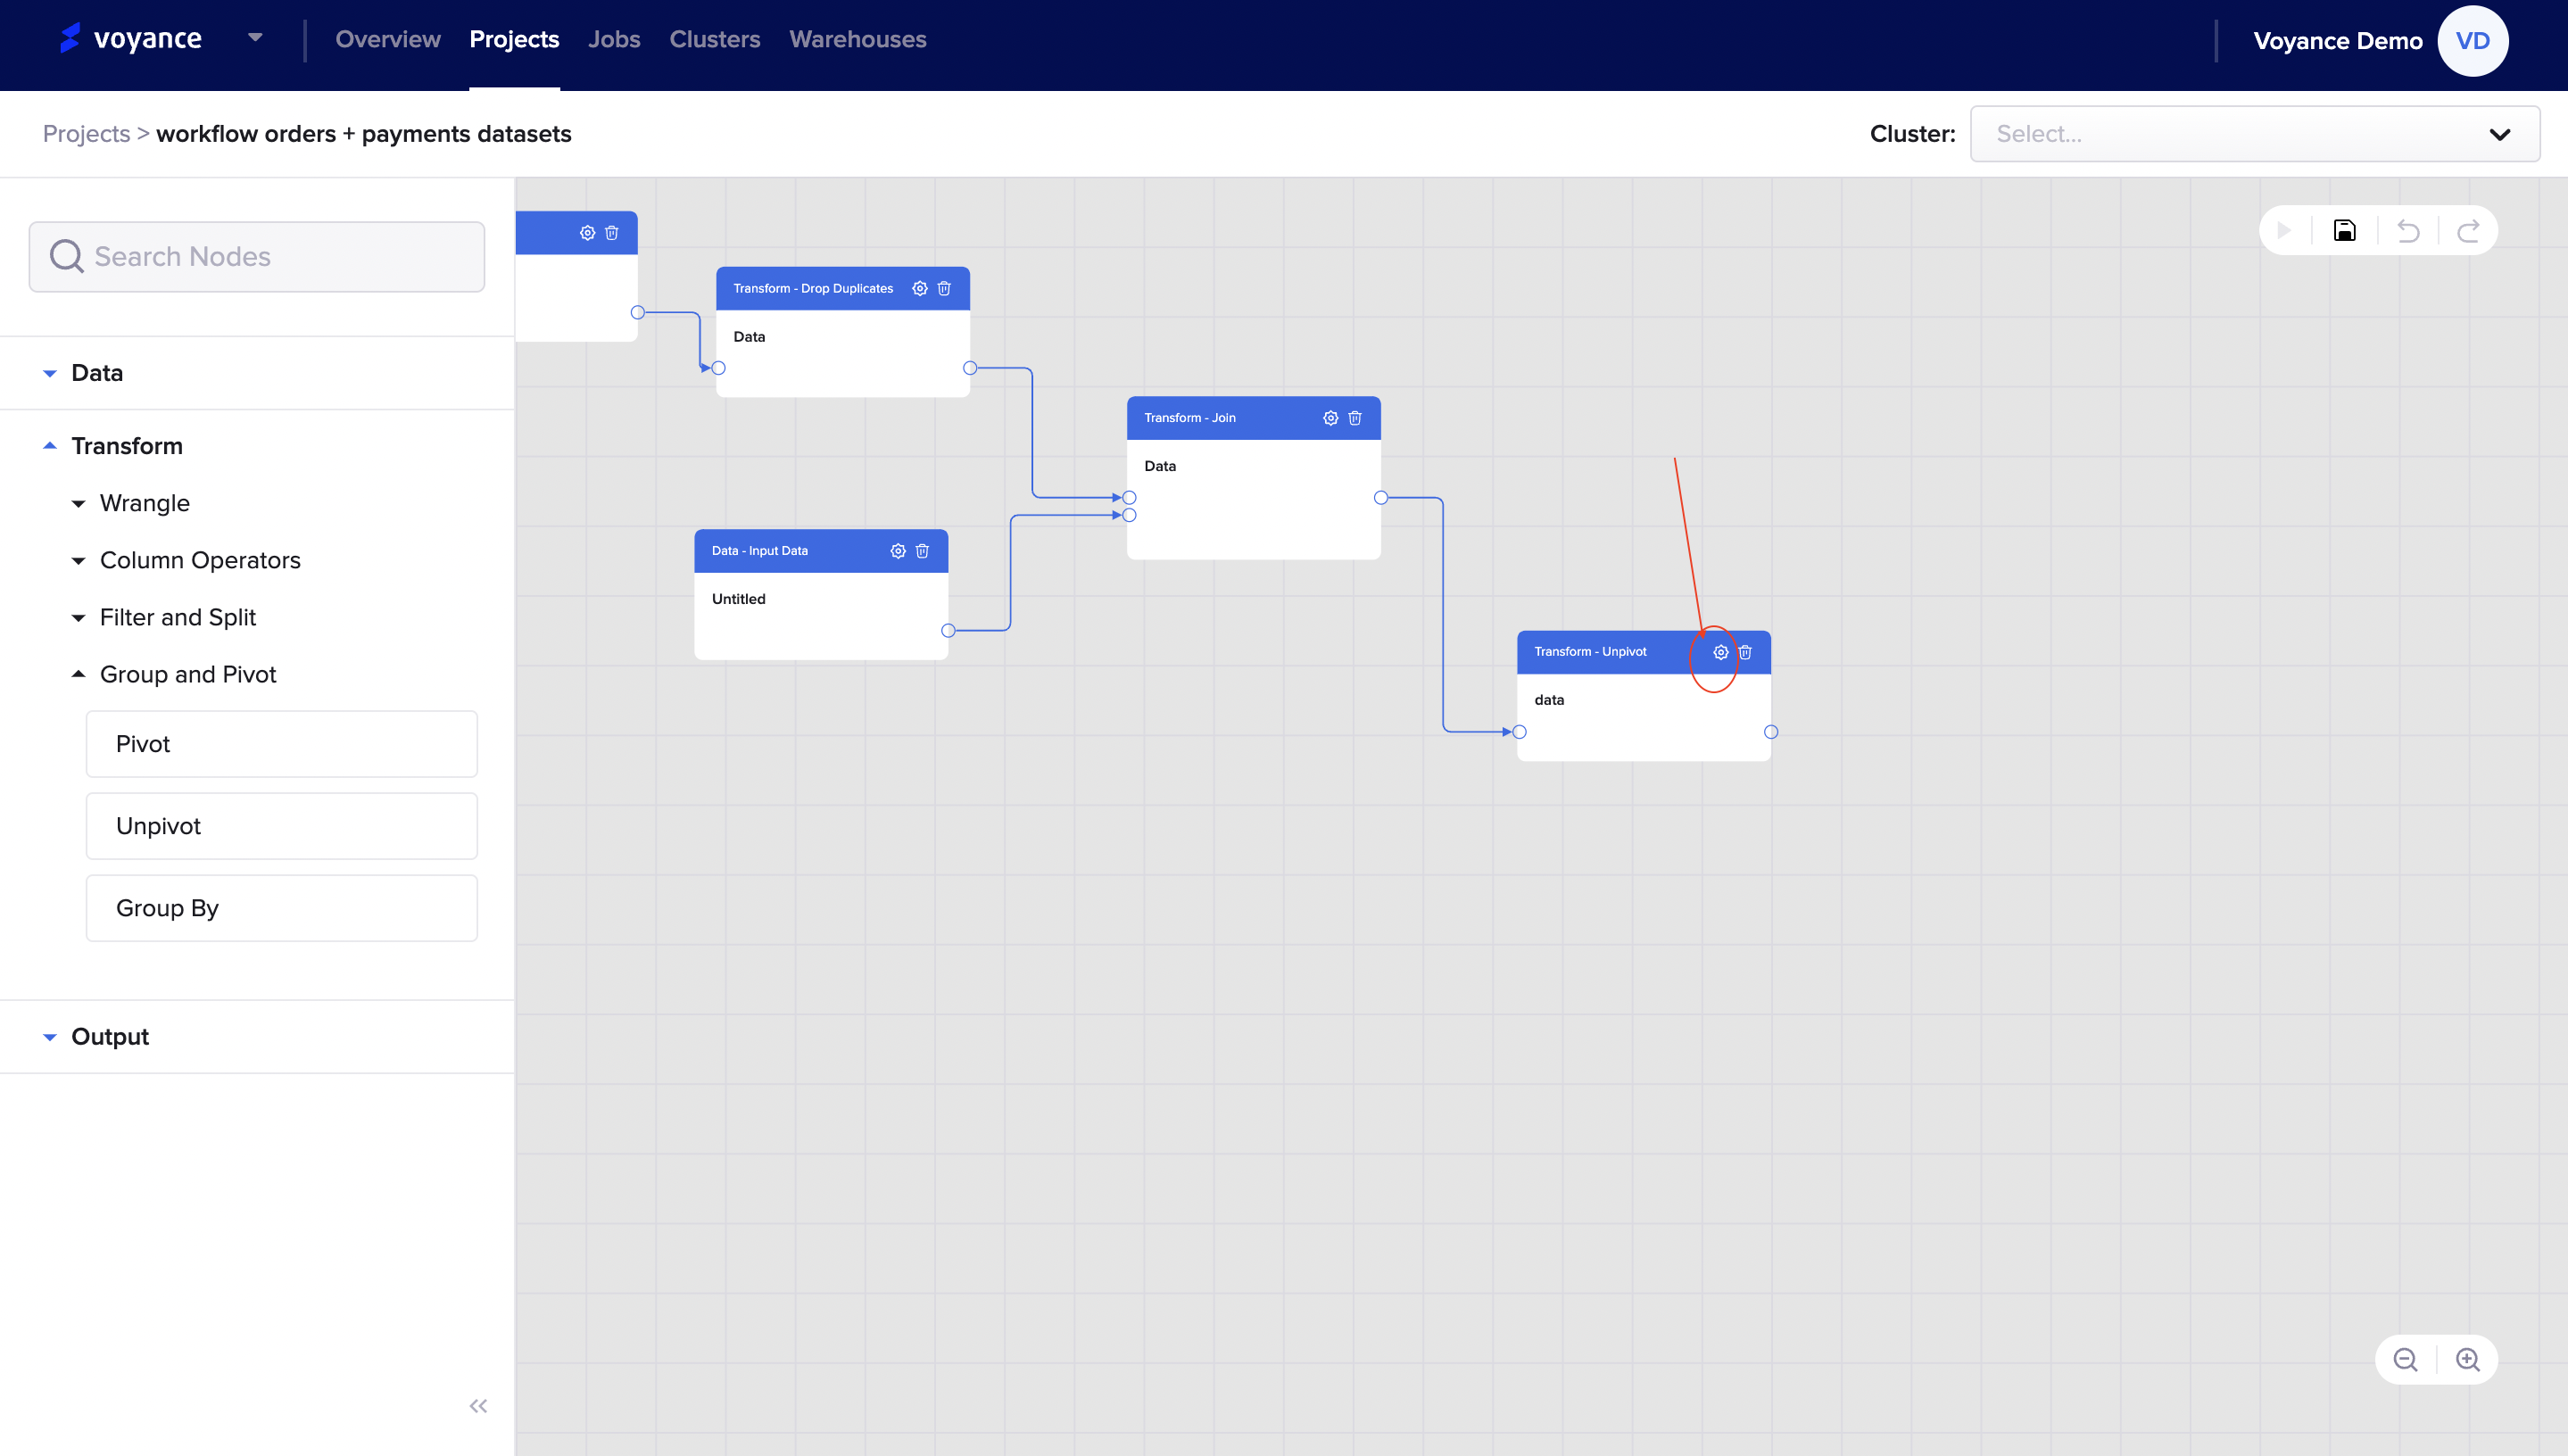
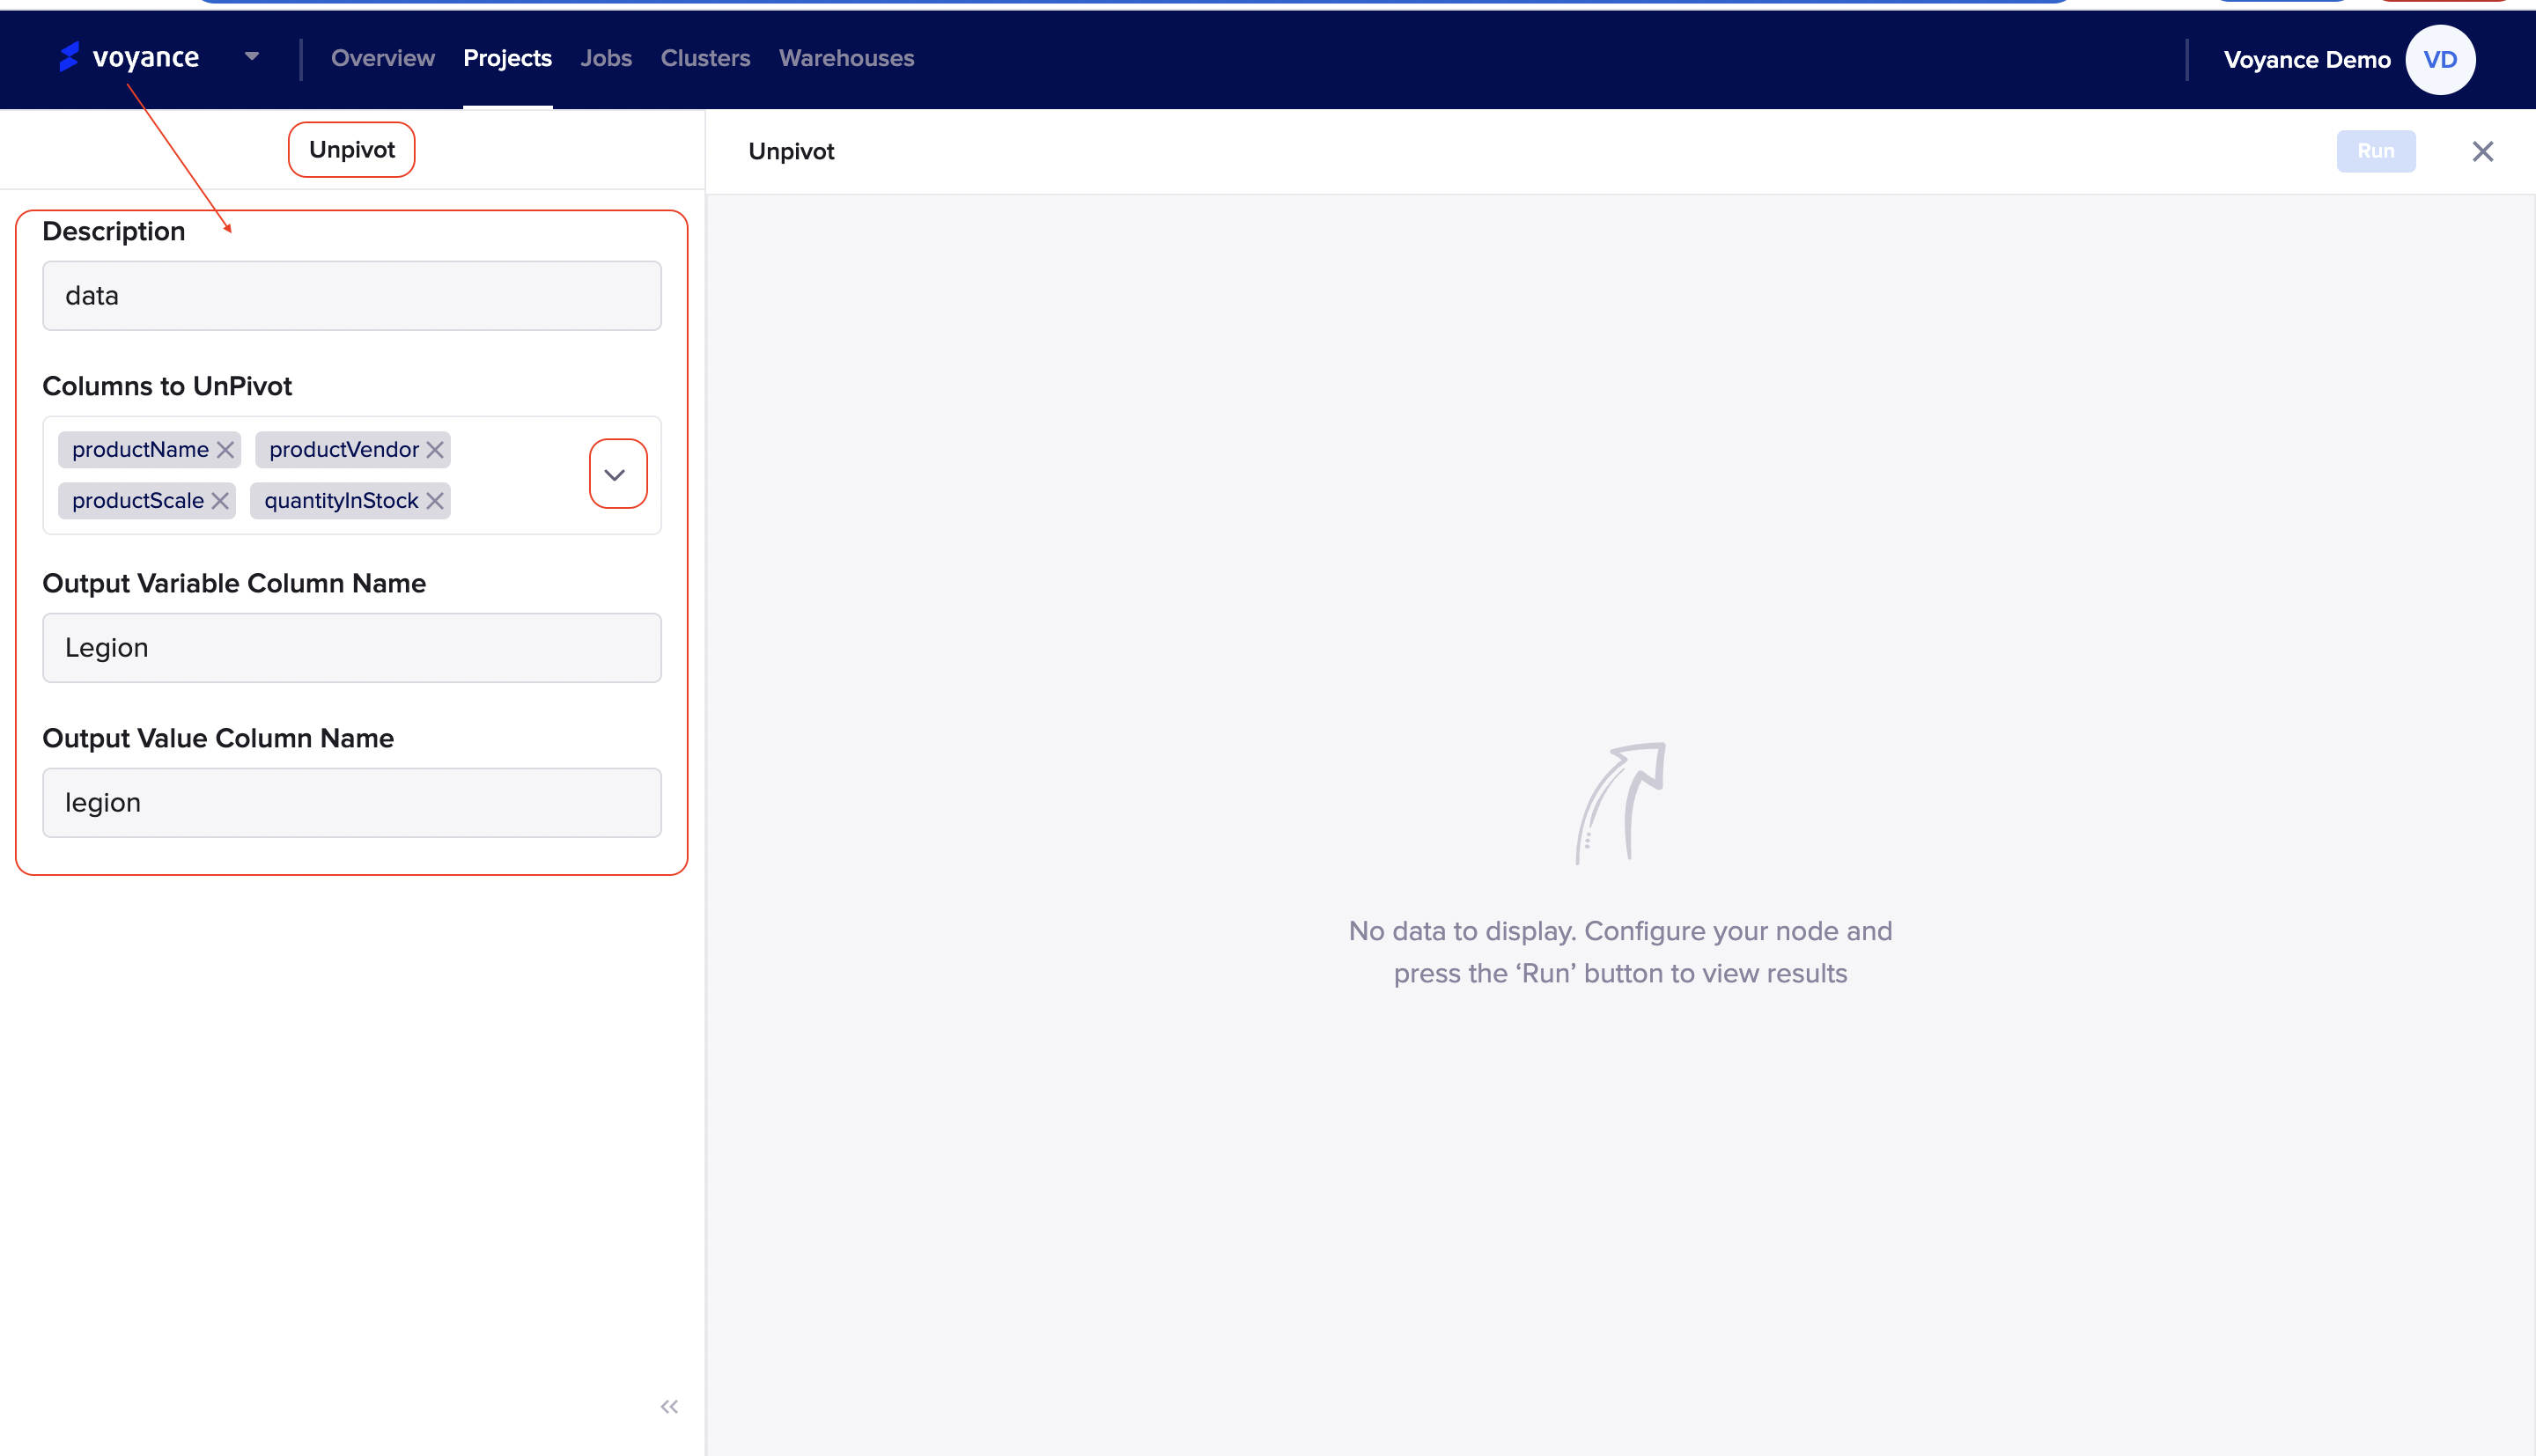
It redirects you to unpivot page where you configure your nodes by filling in the parameters displayed on the page. The parameter includes:
Description: Give the unpivot configuration a title or name. it is optional. Note that, the title or mane will appear on the unpivot dialog box of the workflow.
Column to unpivot:To select the column to unpivot, click on the drop-down arrow and choose the column to unpivot by clicking or marking the columns checkbox(es). you also have the option to select all of the columns to unpivot.
Output variable column name:Give a name to the output variable column.
Output variable column name: Give a name to the output variable column.
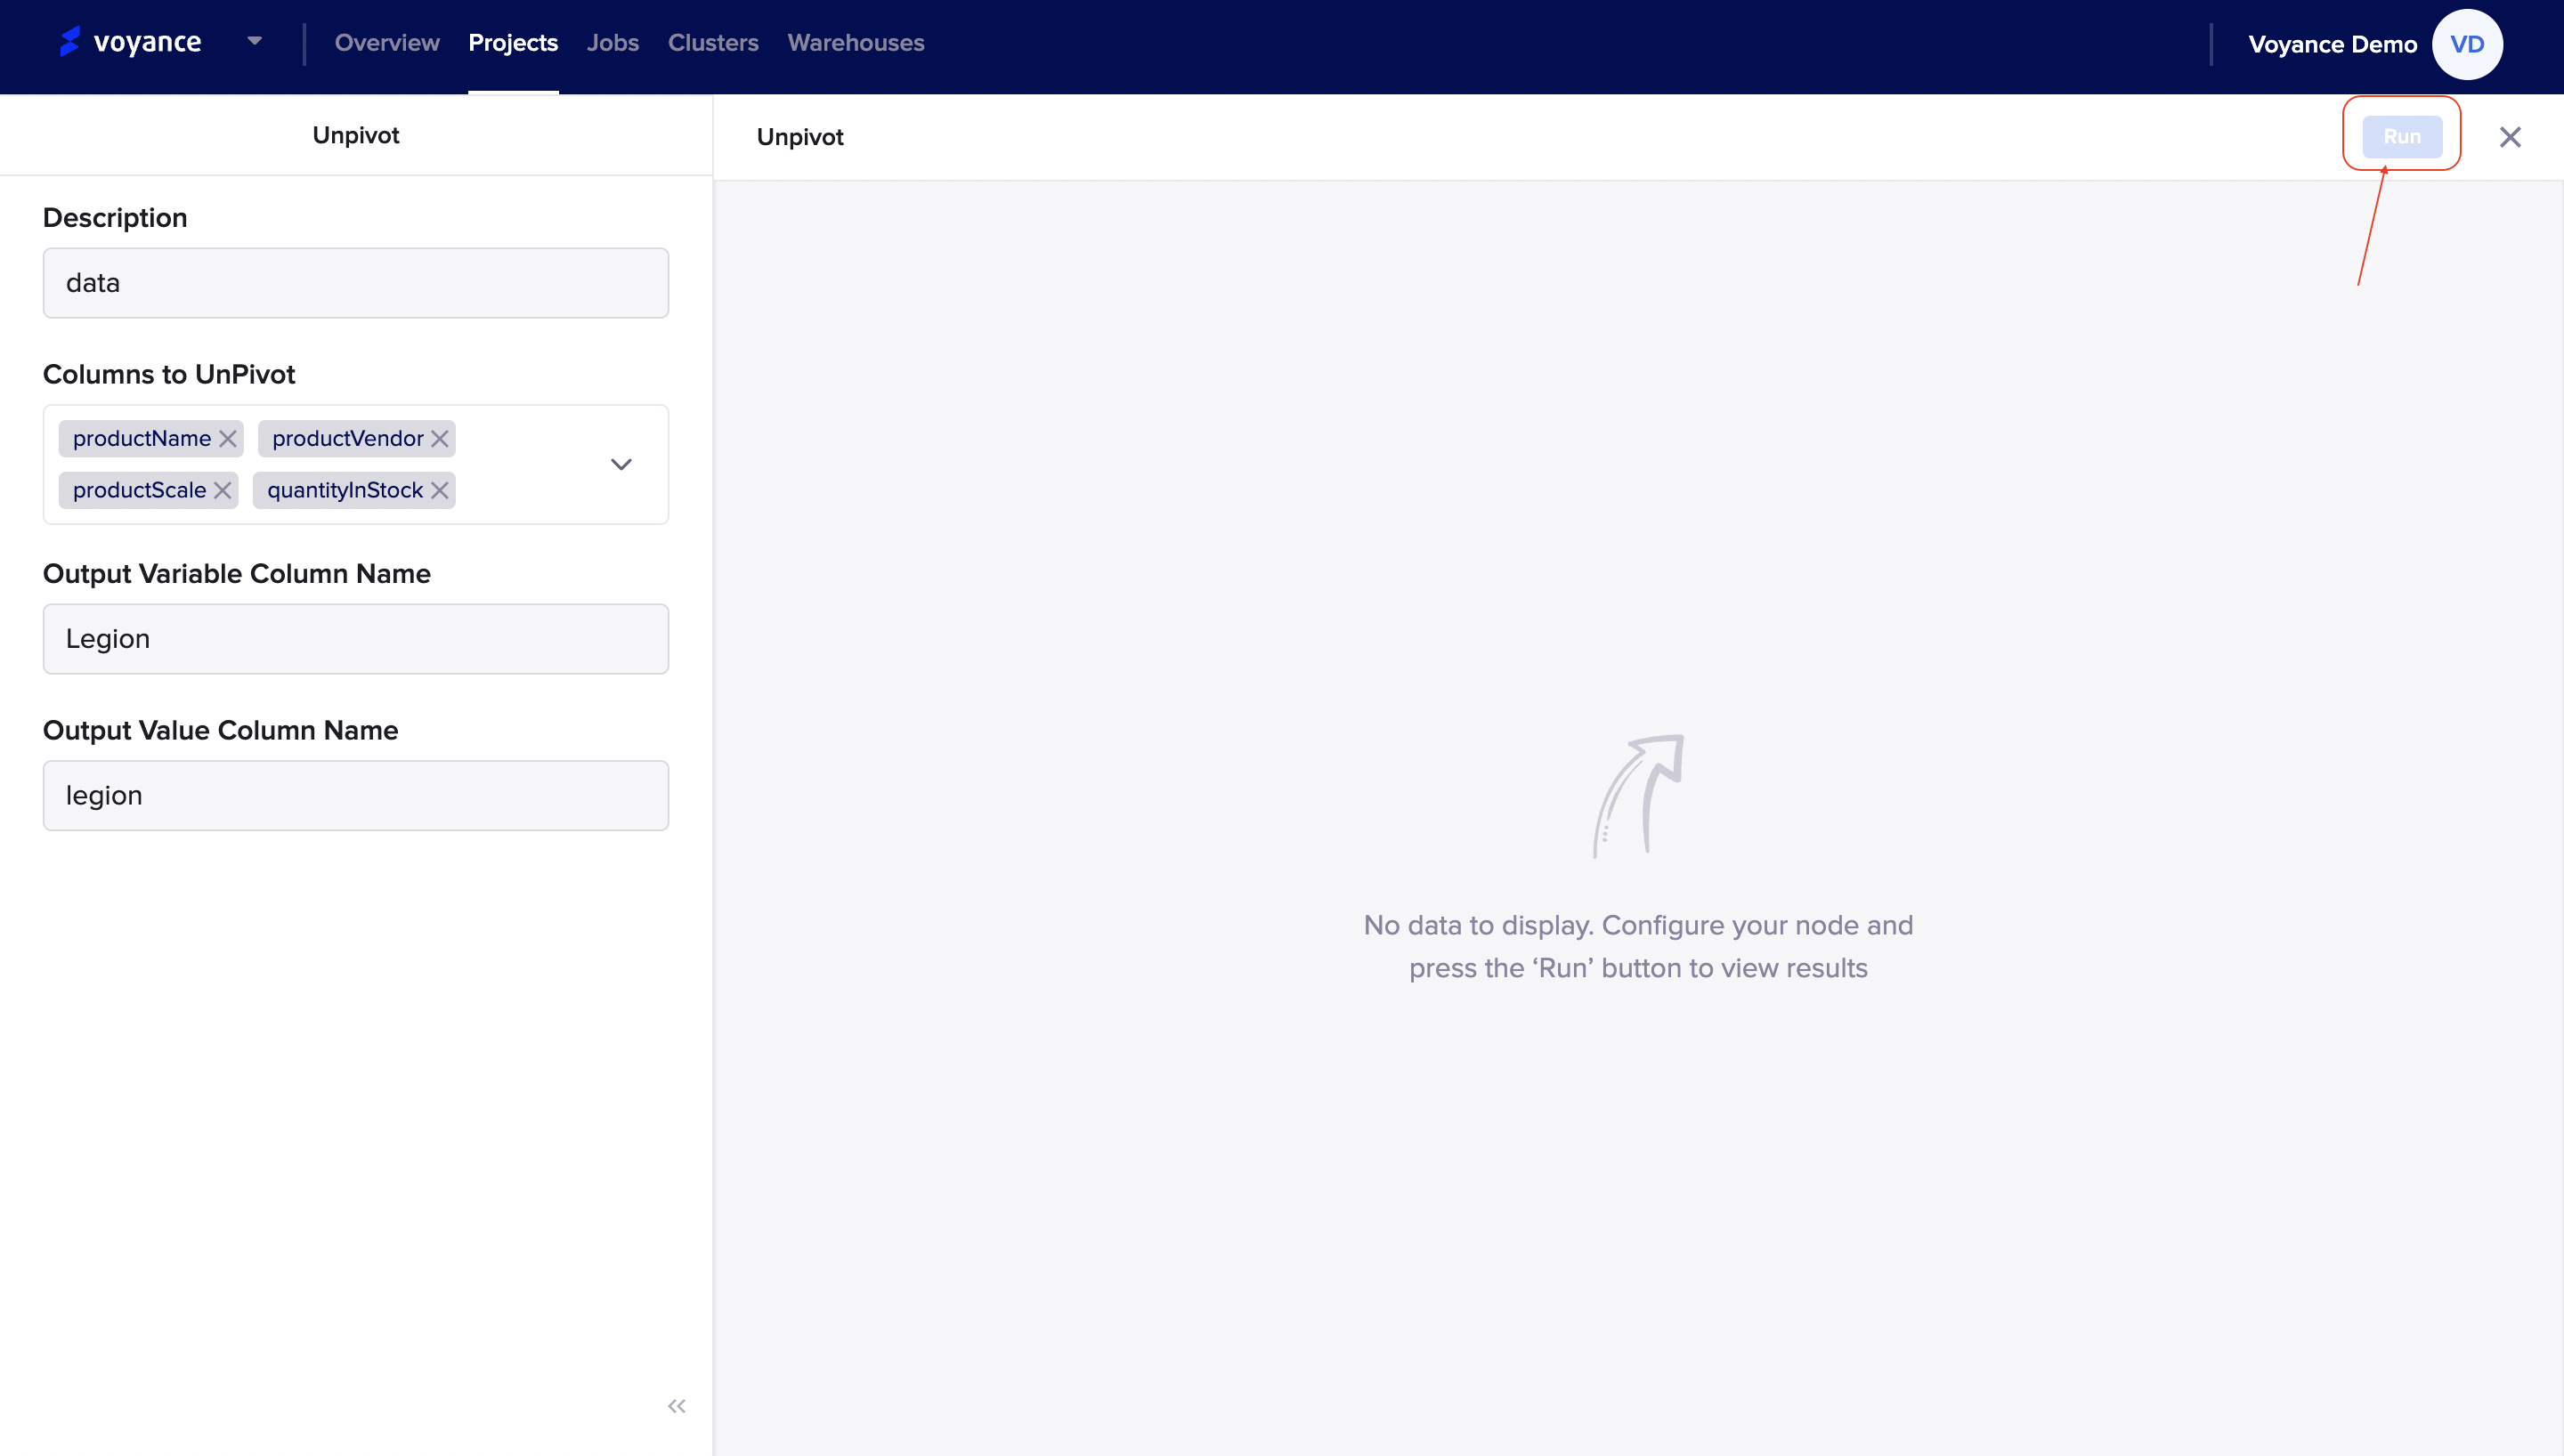
Run program
To view the result of your node's configuration, click on the "Run" tab at the top-right of the unpivot page to analyze and view the result of the configuration.
Group by
The "Group by transform allows you to be able to define groups in your data that can return combined values of the fields specified in the group. it enables you to transform your data into a well-defined and concise group. it enables you to calculate Aggregated Values for a given field To transform data with the group by, click and drag the "Group by operator to the workflow.
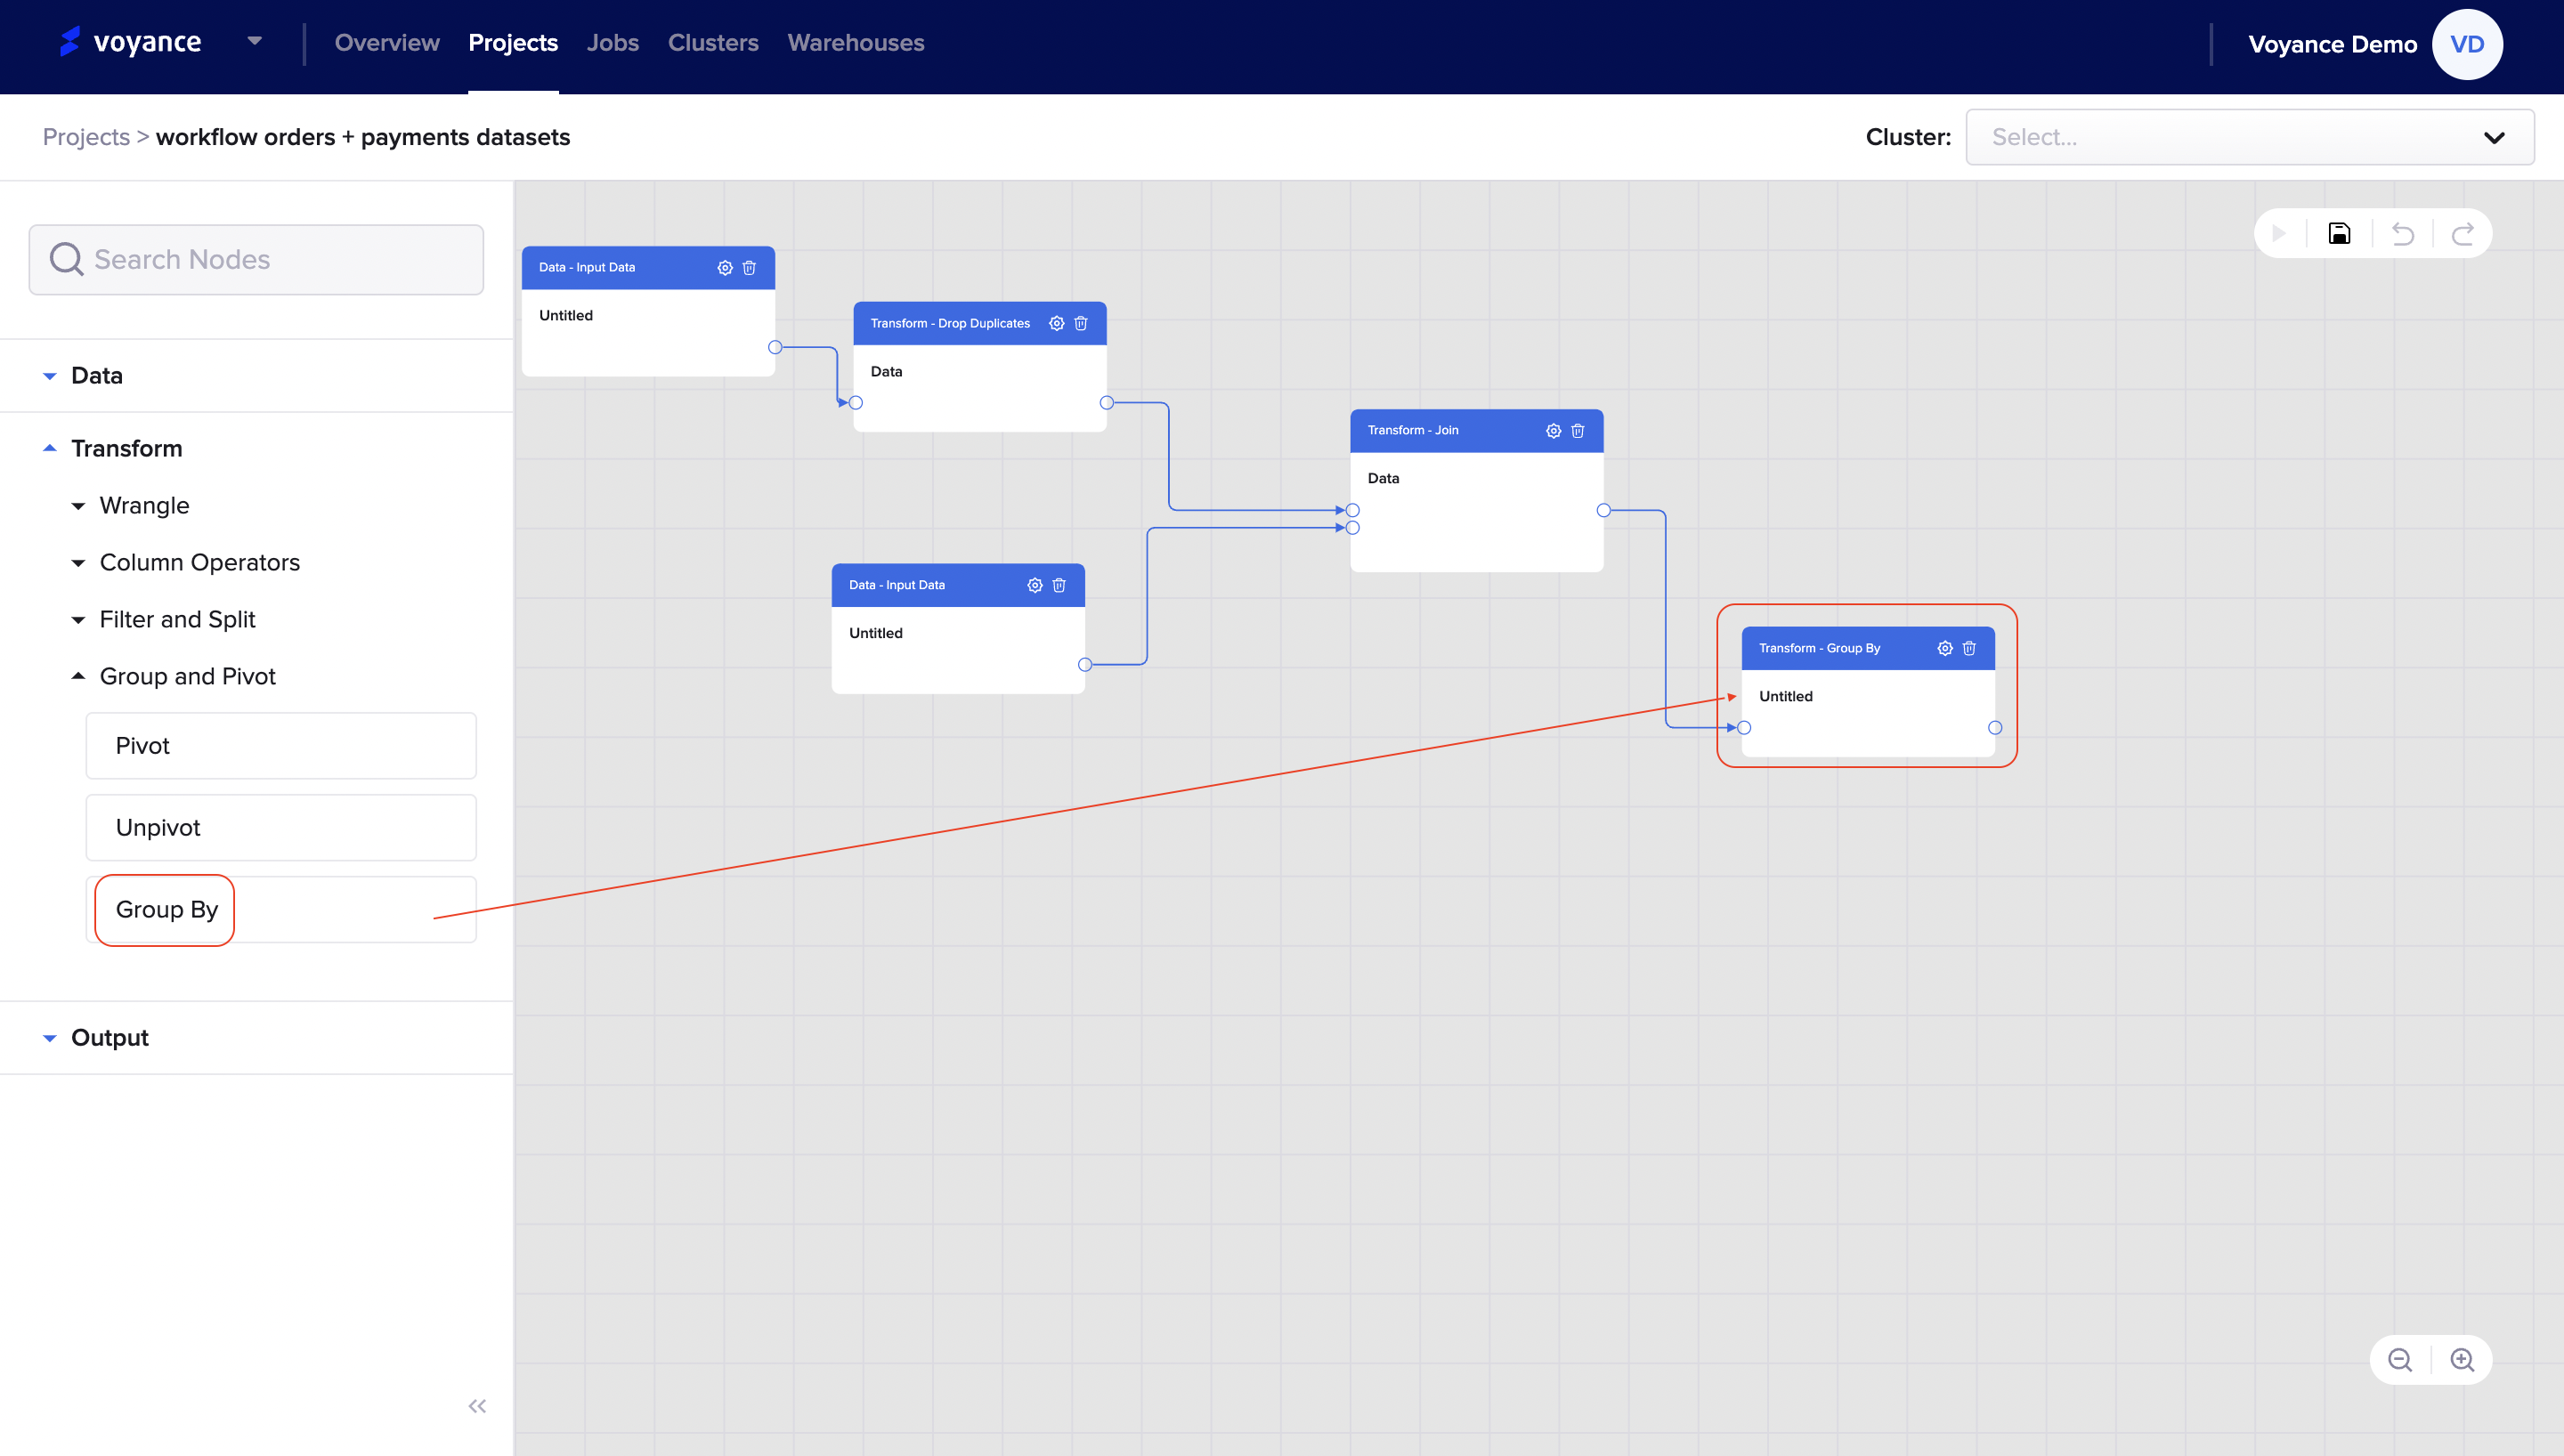
Edit the Group by operator
To edit your group by transformation for configuration, click on the "settings icon at the top of the group by dialog box on the workflow.
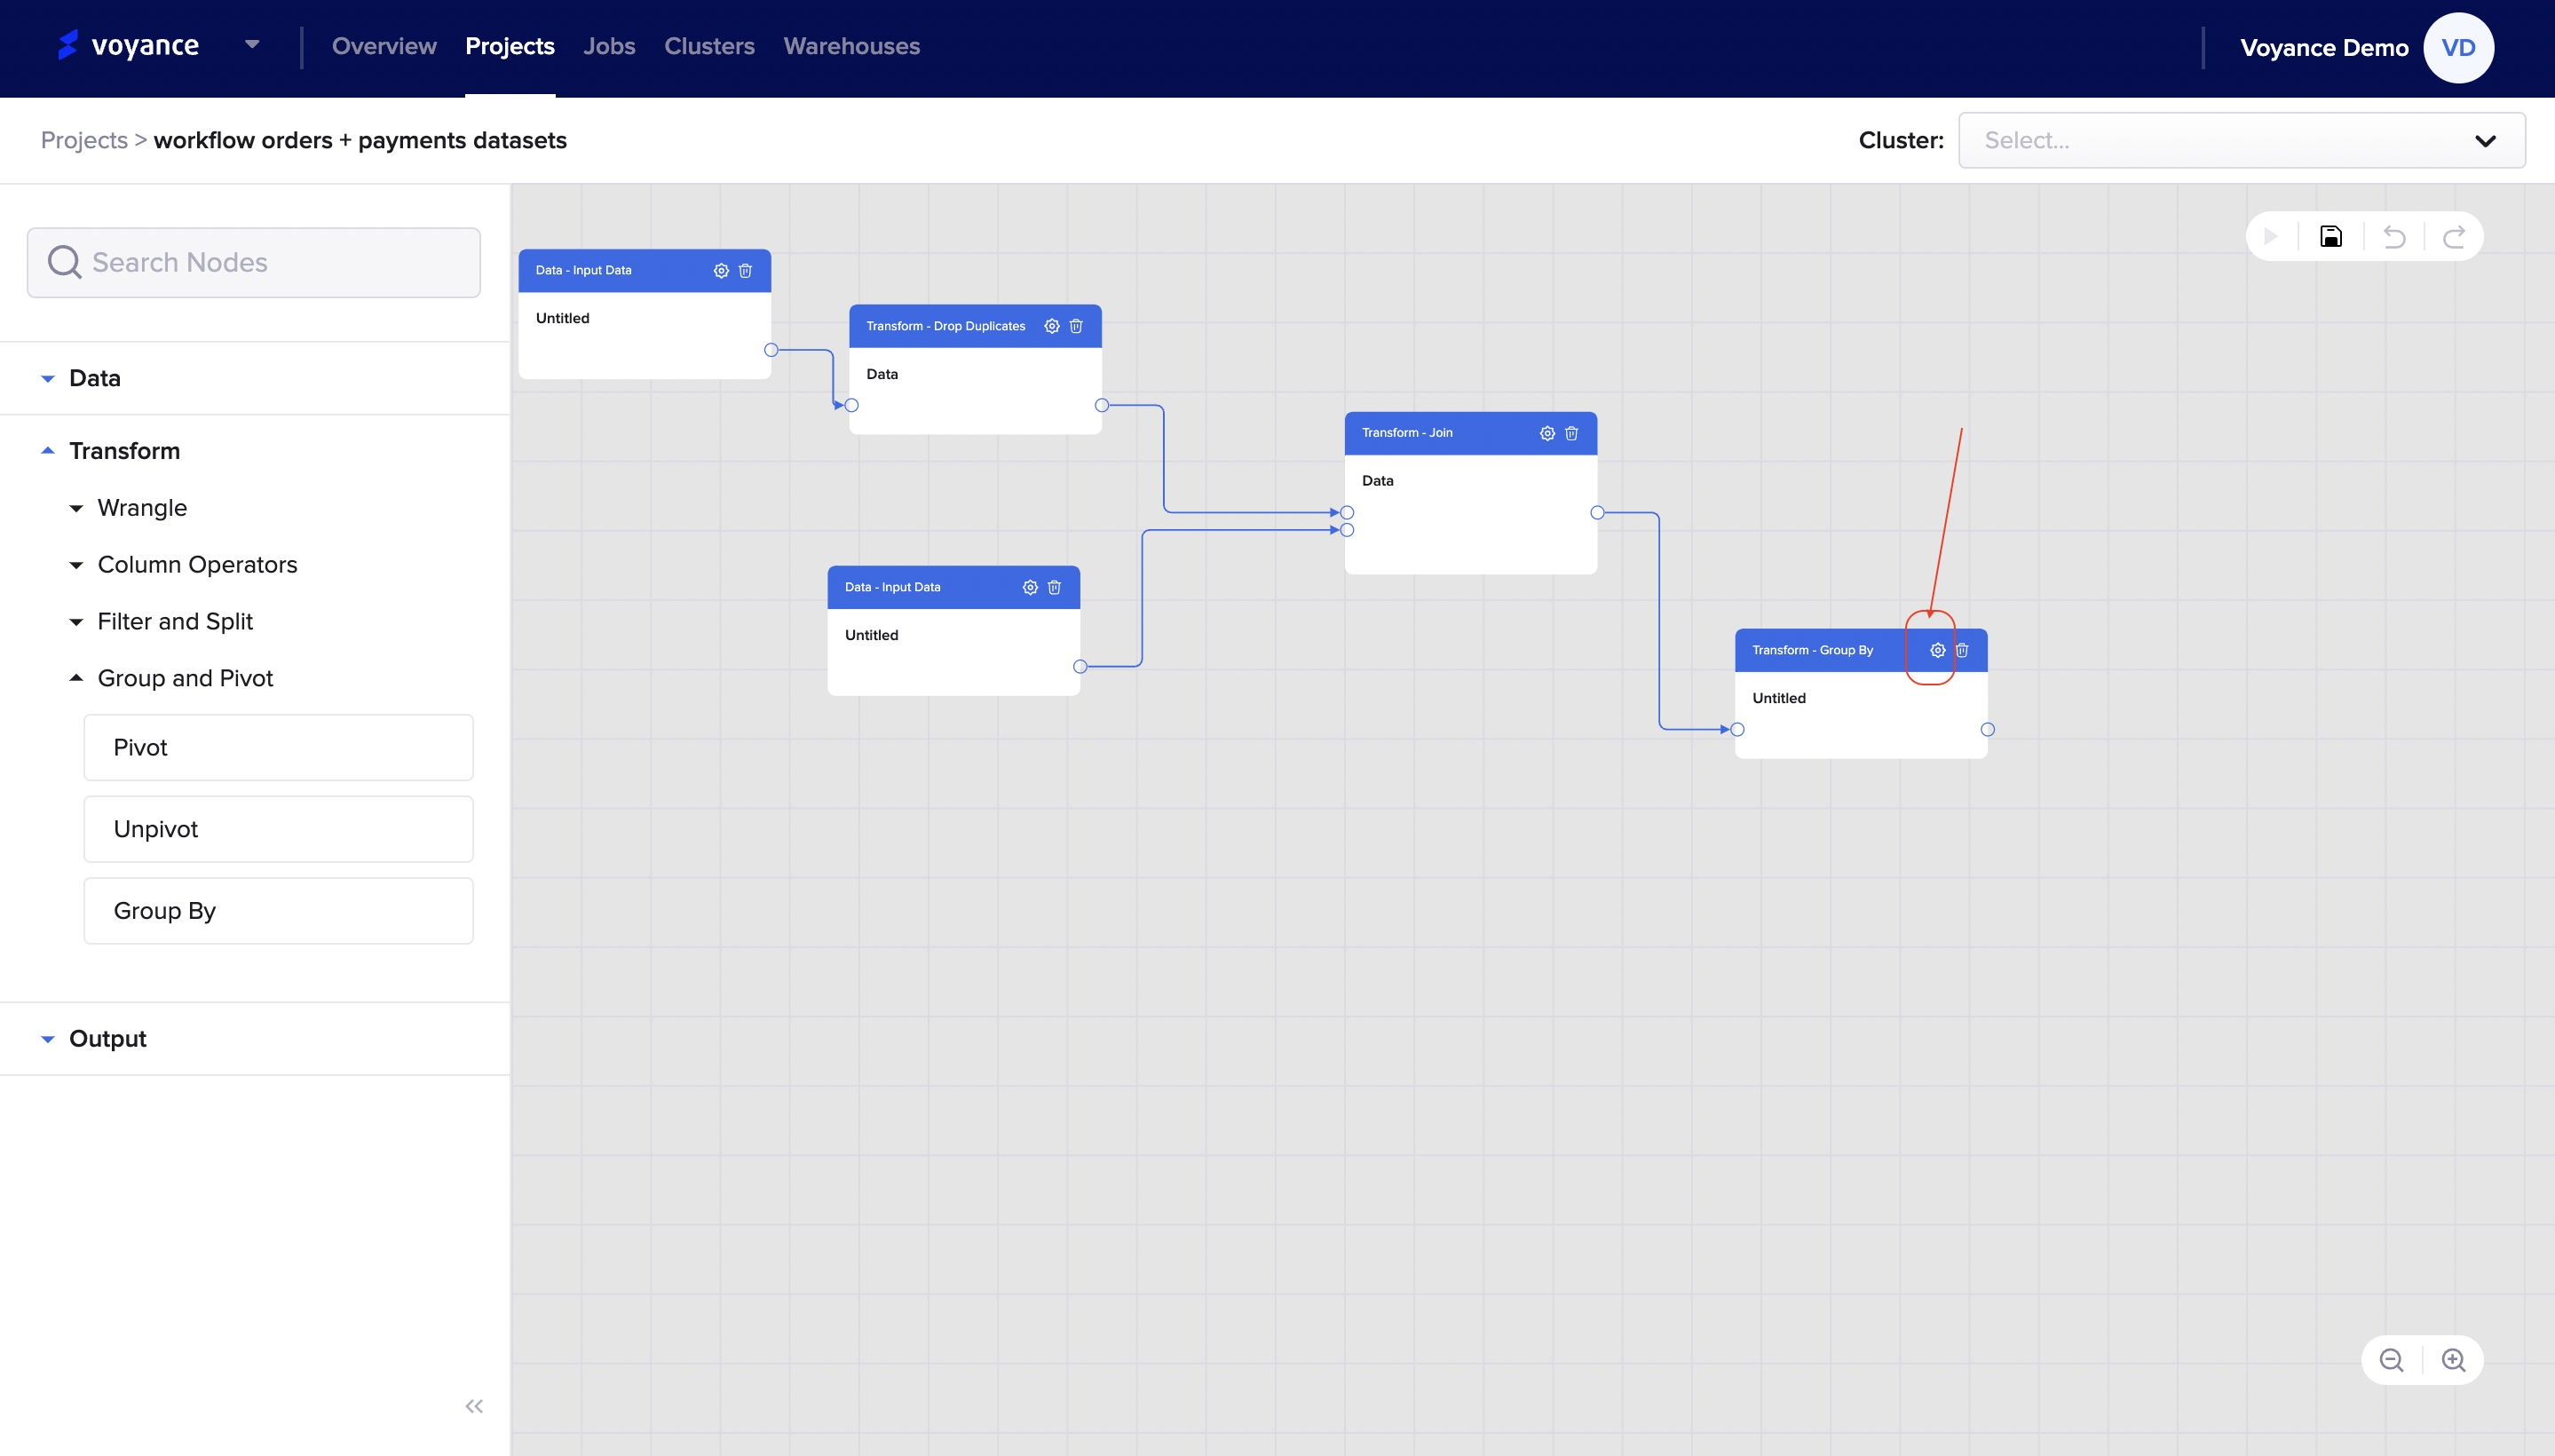
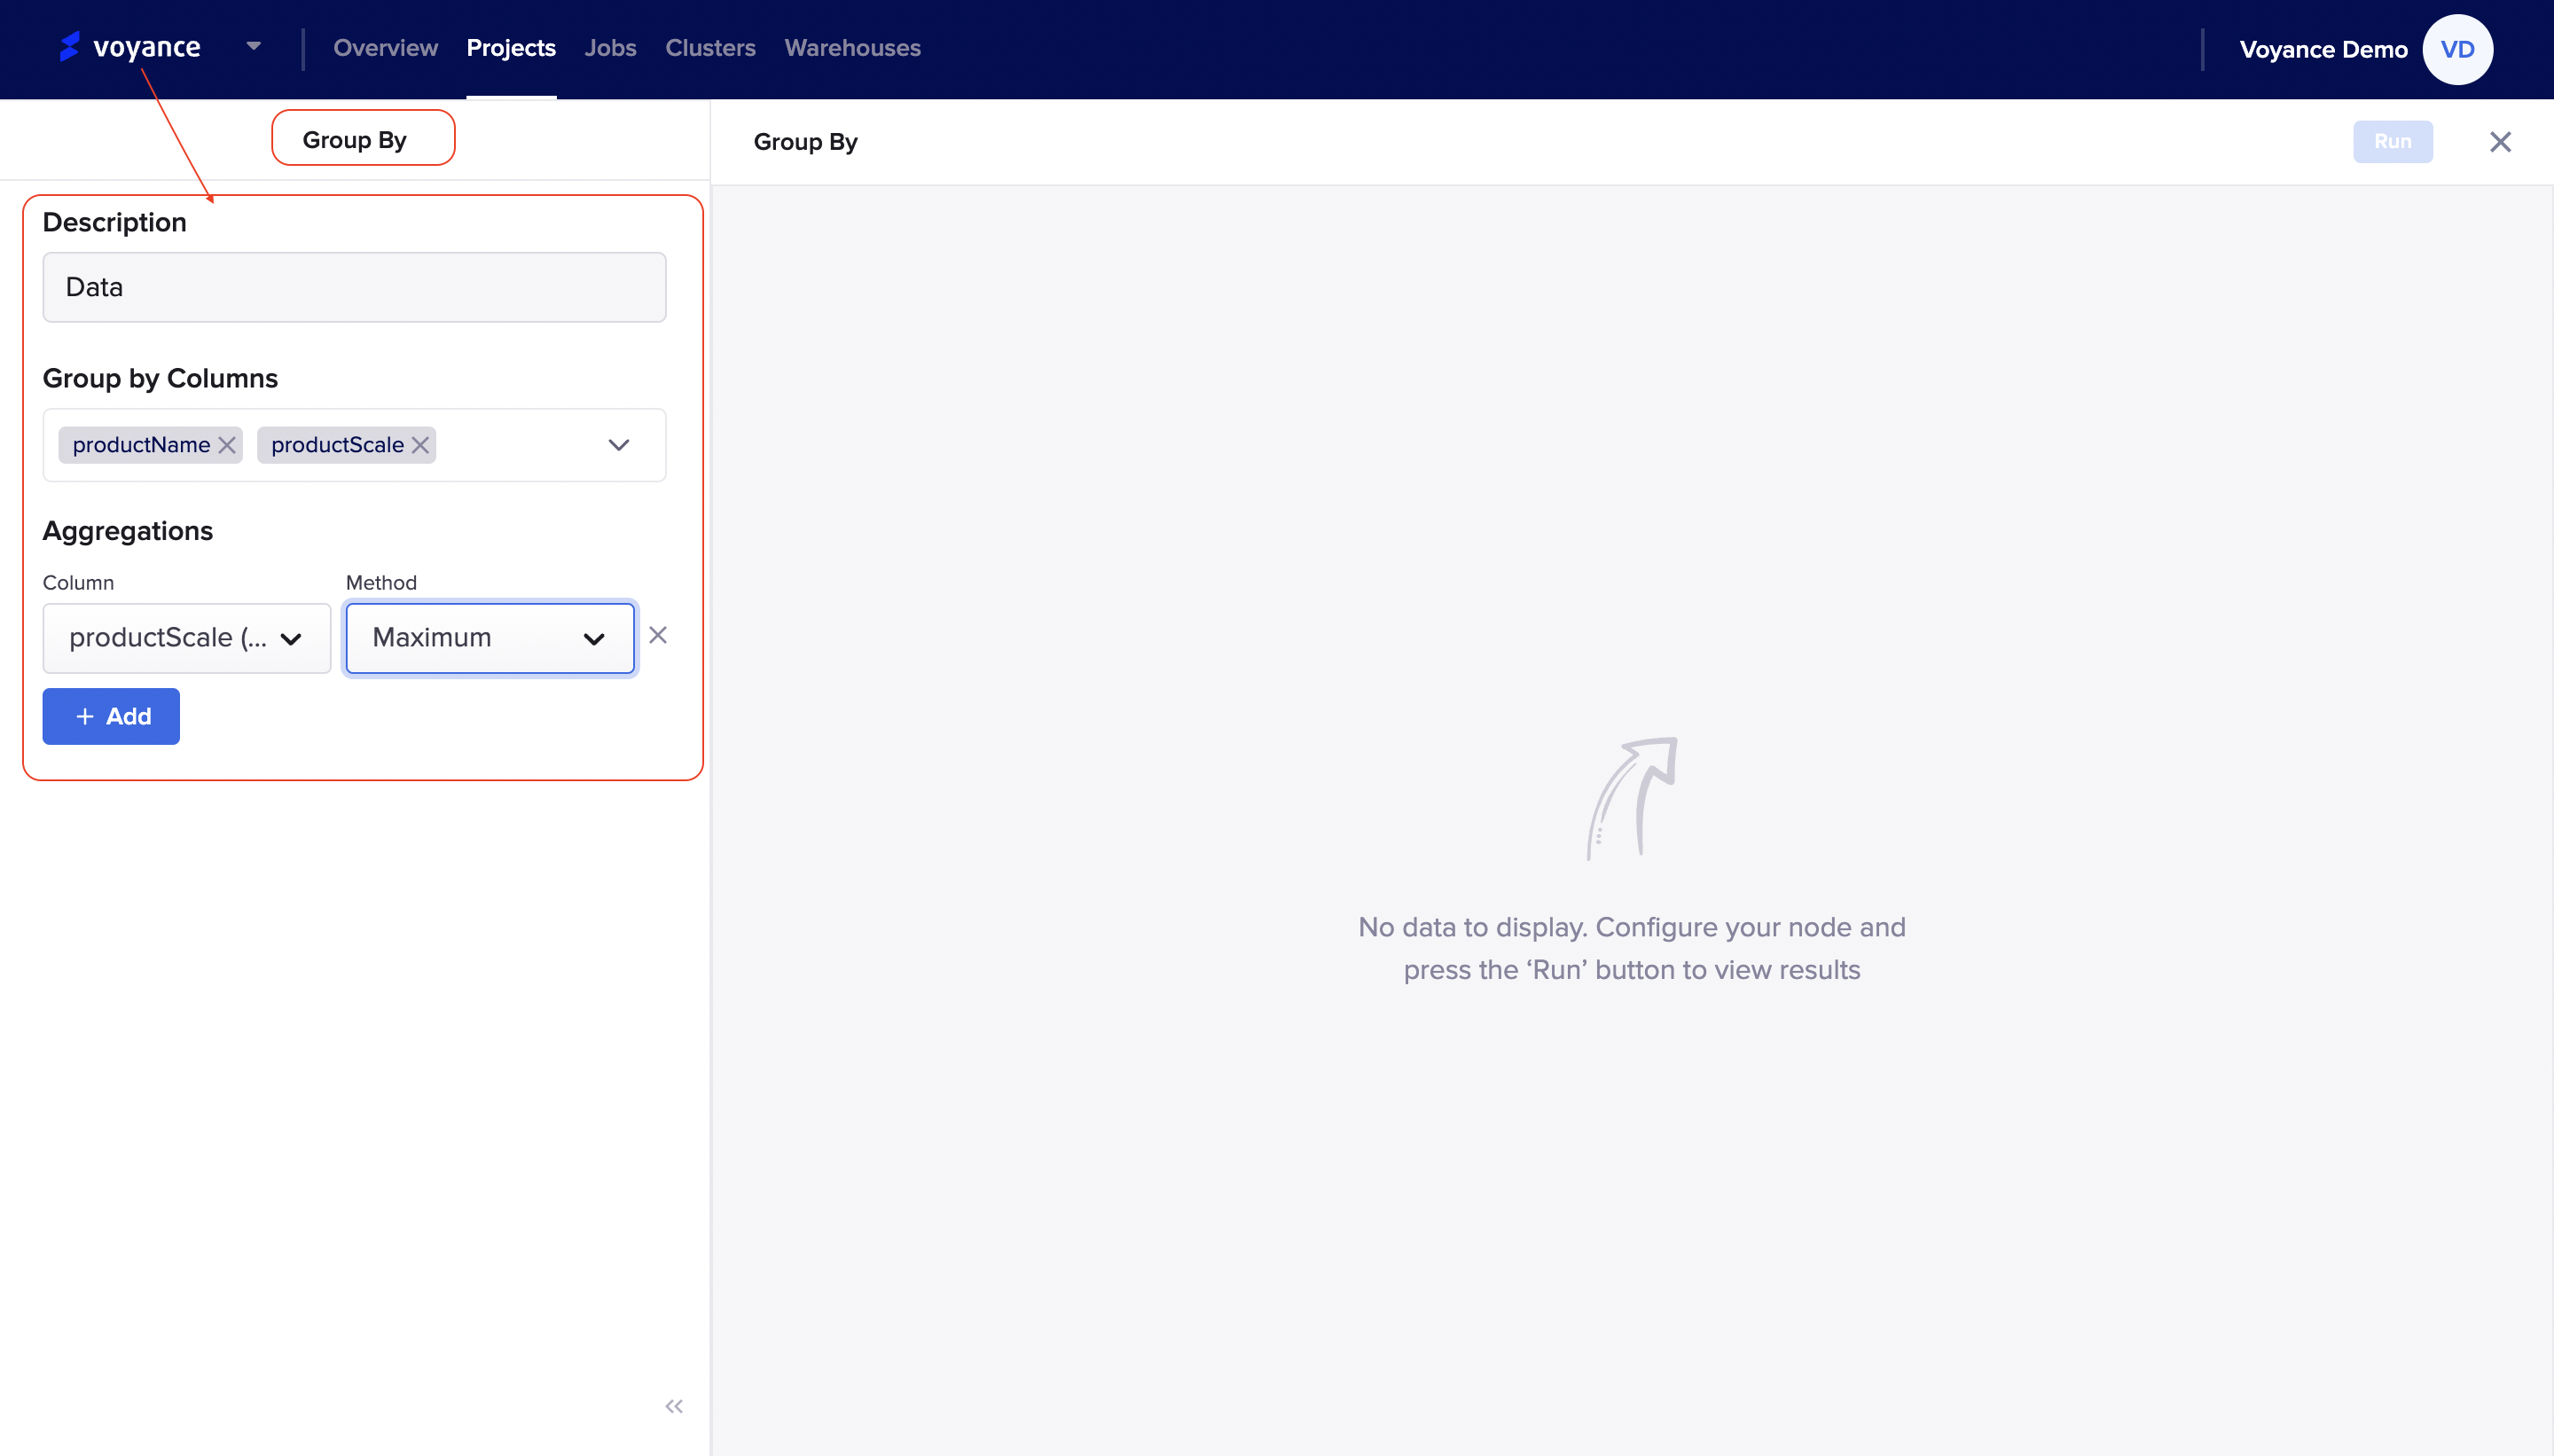
Once you click on the settings icon, it redirects to the group by page where you can configure your data into groups. fill in the details that are displayed on the page. The parameter allows you to be able to group your data. these parameters include:
Description:Give a name or title to the Group by page. it is optional. Note that, the name or title given will be displayed on the group by dialog box of the workflow.
Group by column:To select a column, click on the drop-down arrow to select column by clicking on the checkbox(es), you can select more than one column and also you have the option to select all of the column
AggregationTo perform aggregation, click on the column drop-down to select a column and select on method drop-down to select a method for the grouping.
You have the option to add more than one aggregation, click on the "Add tab" to add more aggregation for the grouping.
Run program
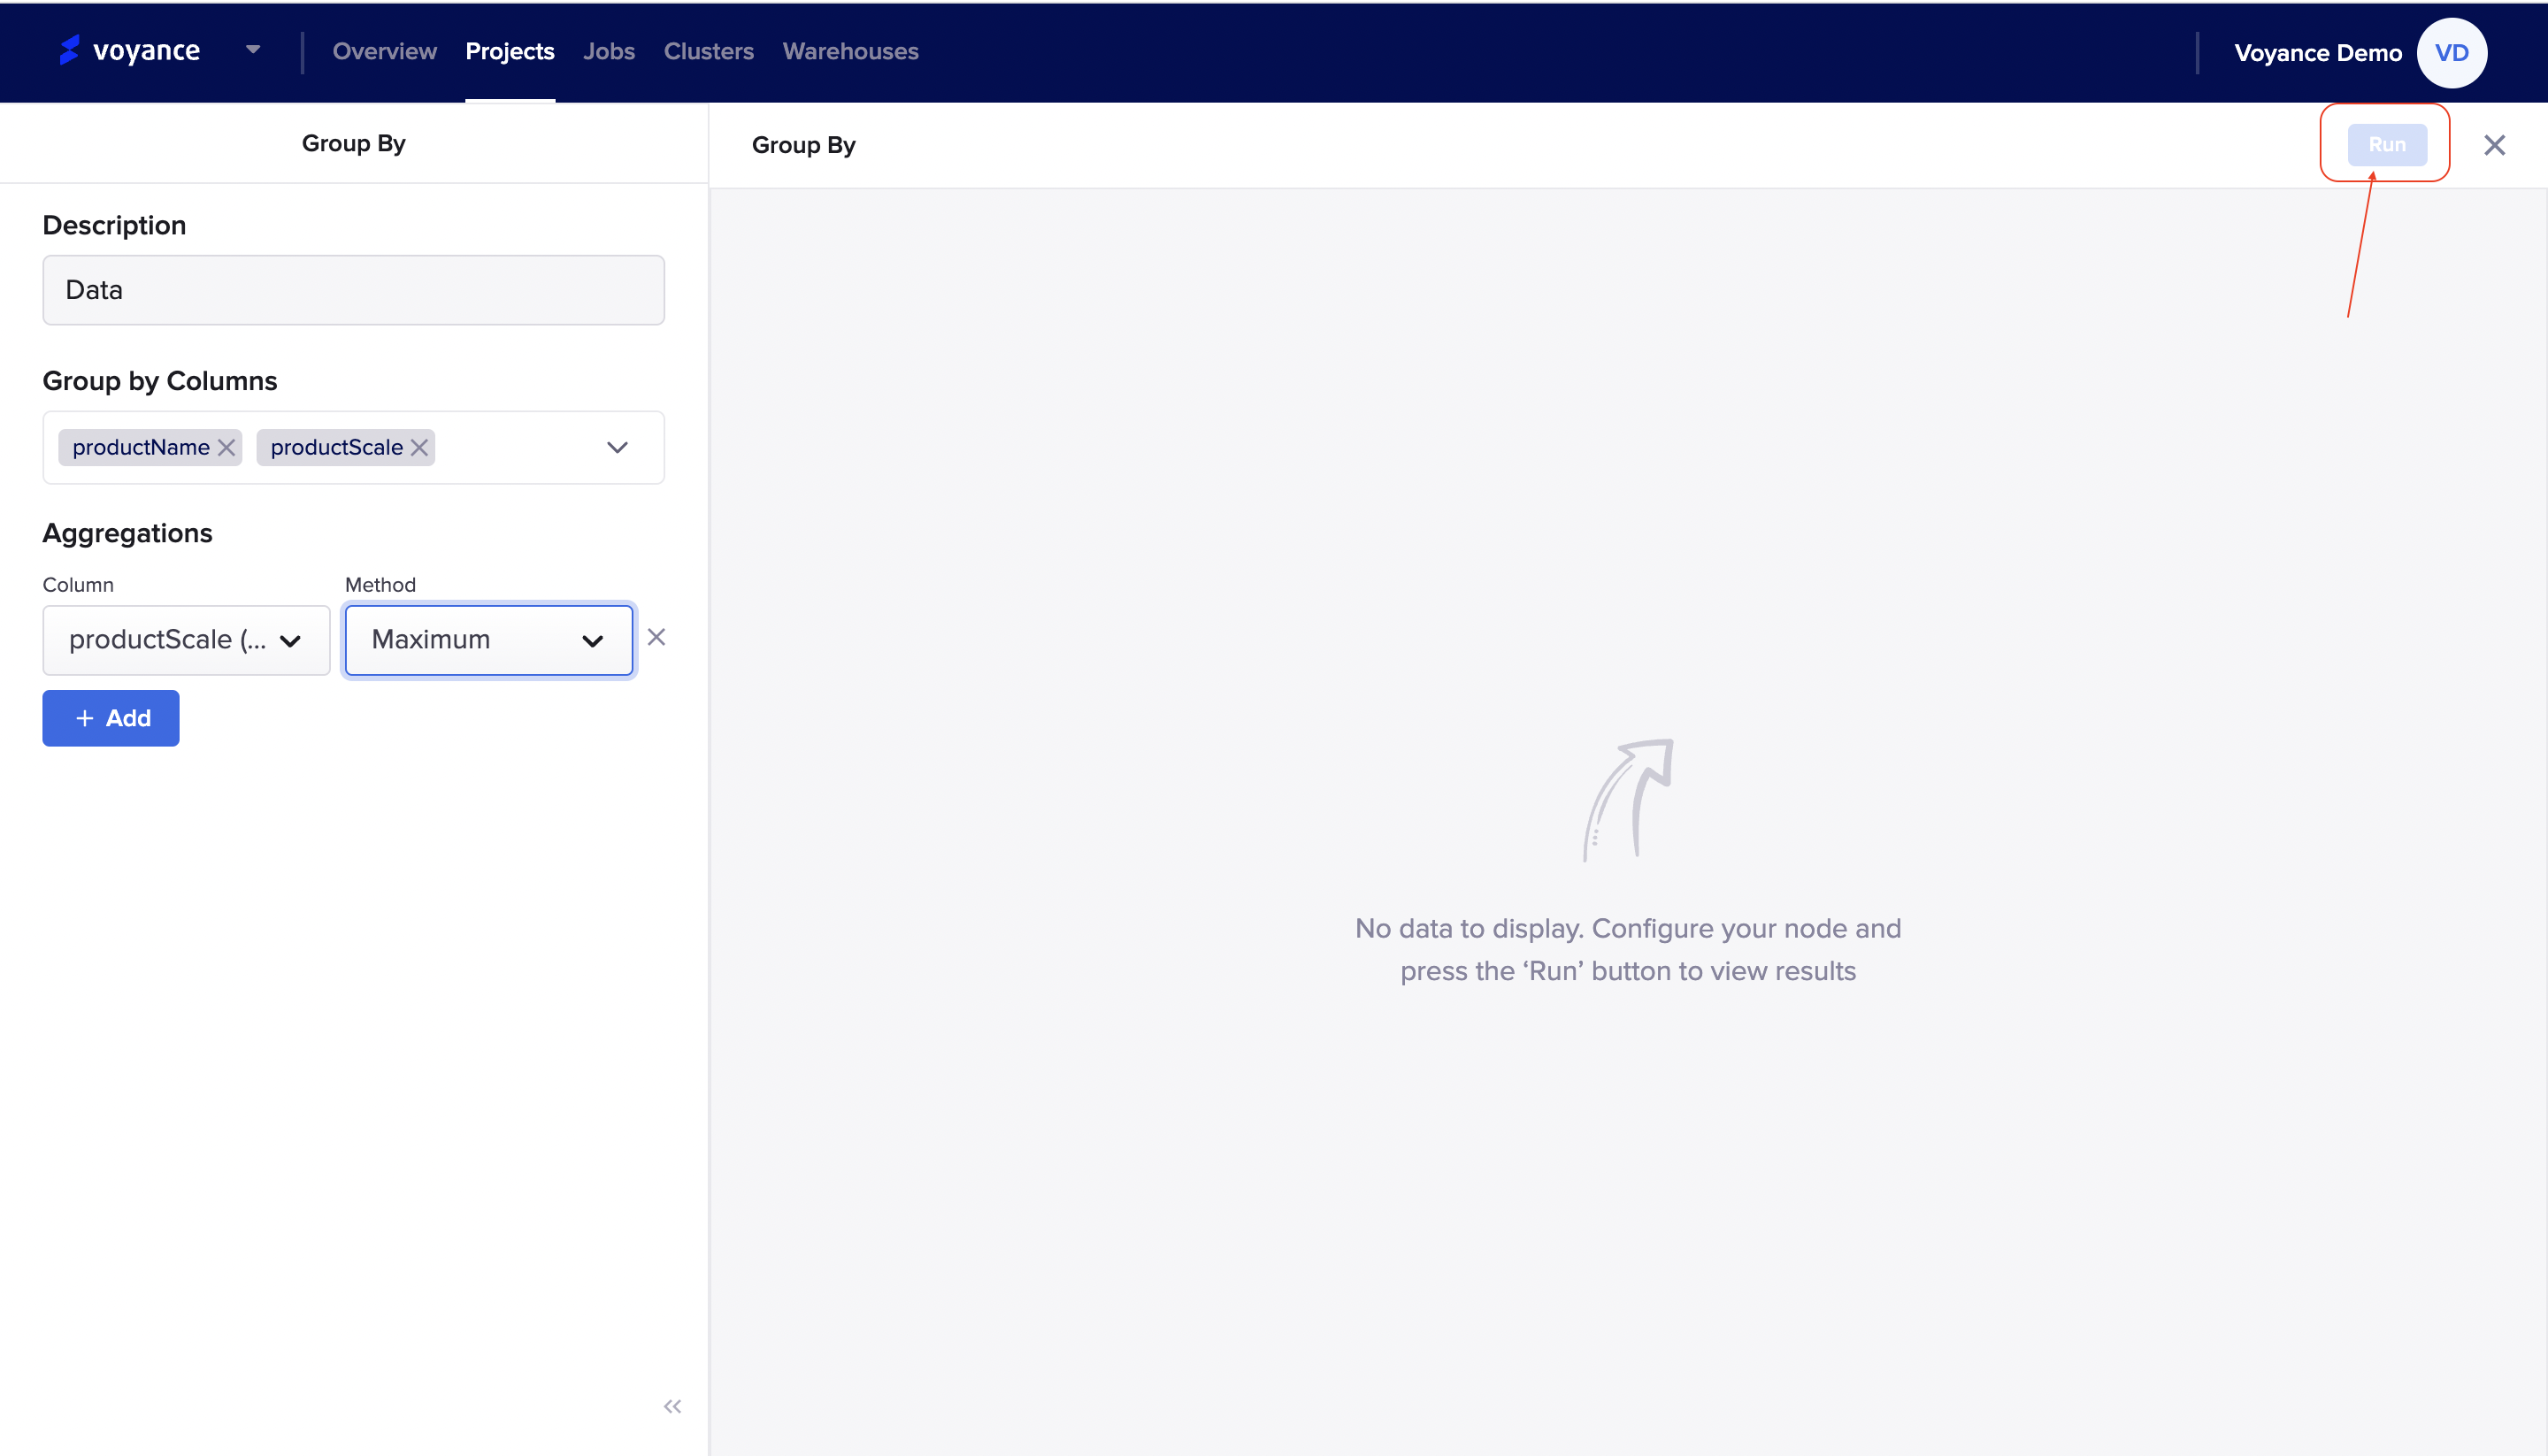
To view the result of your node's configuration, click on the "Run" tab at the top-right of the Group by page to analyze and view the result of the configuration.
Output
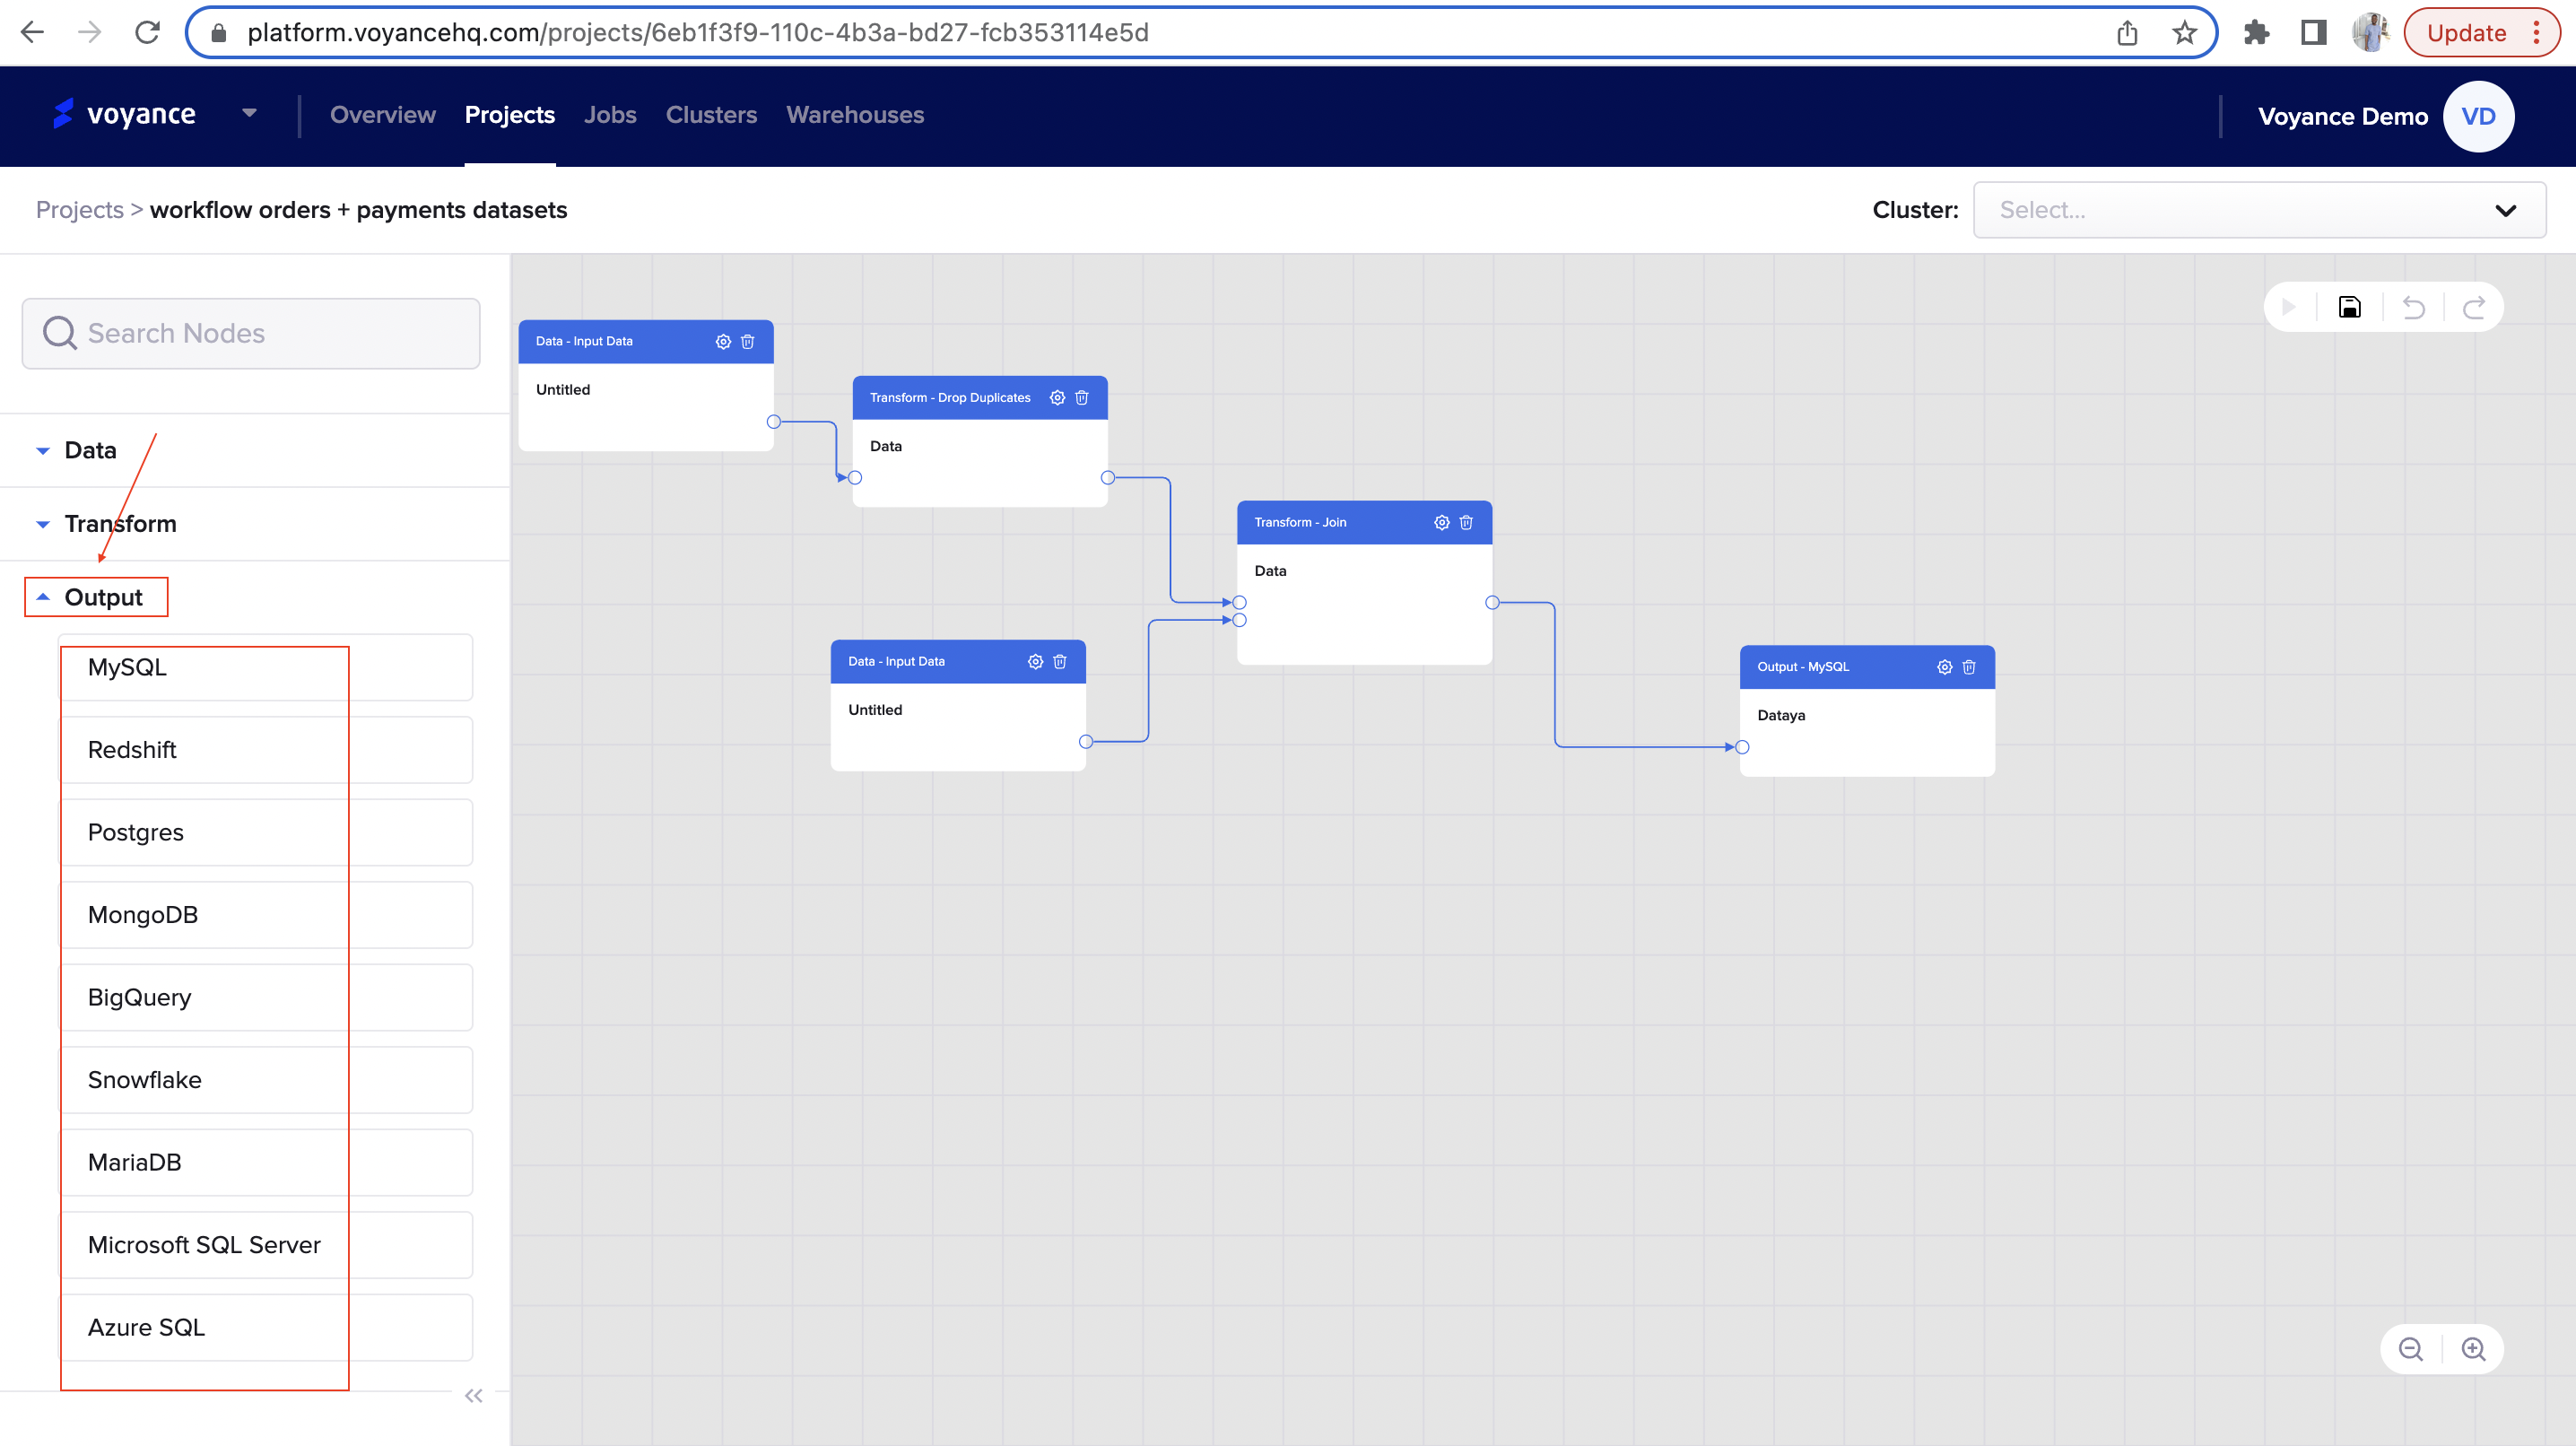
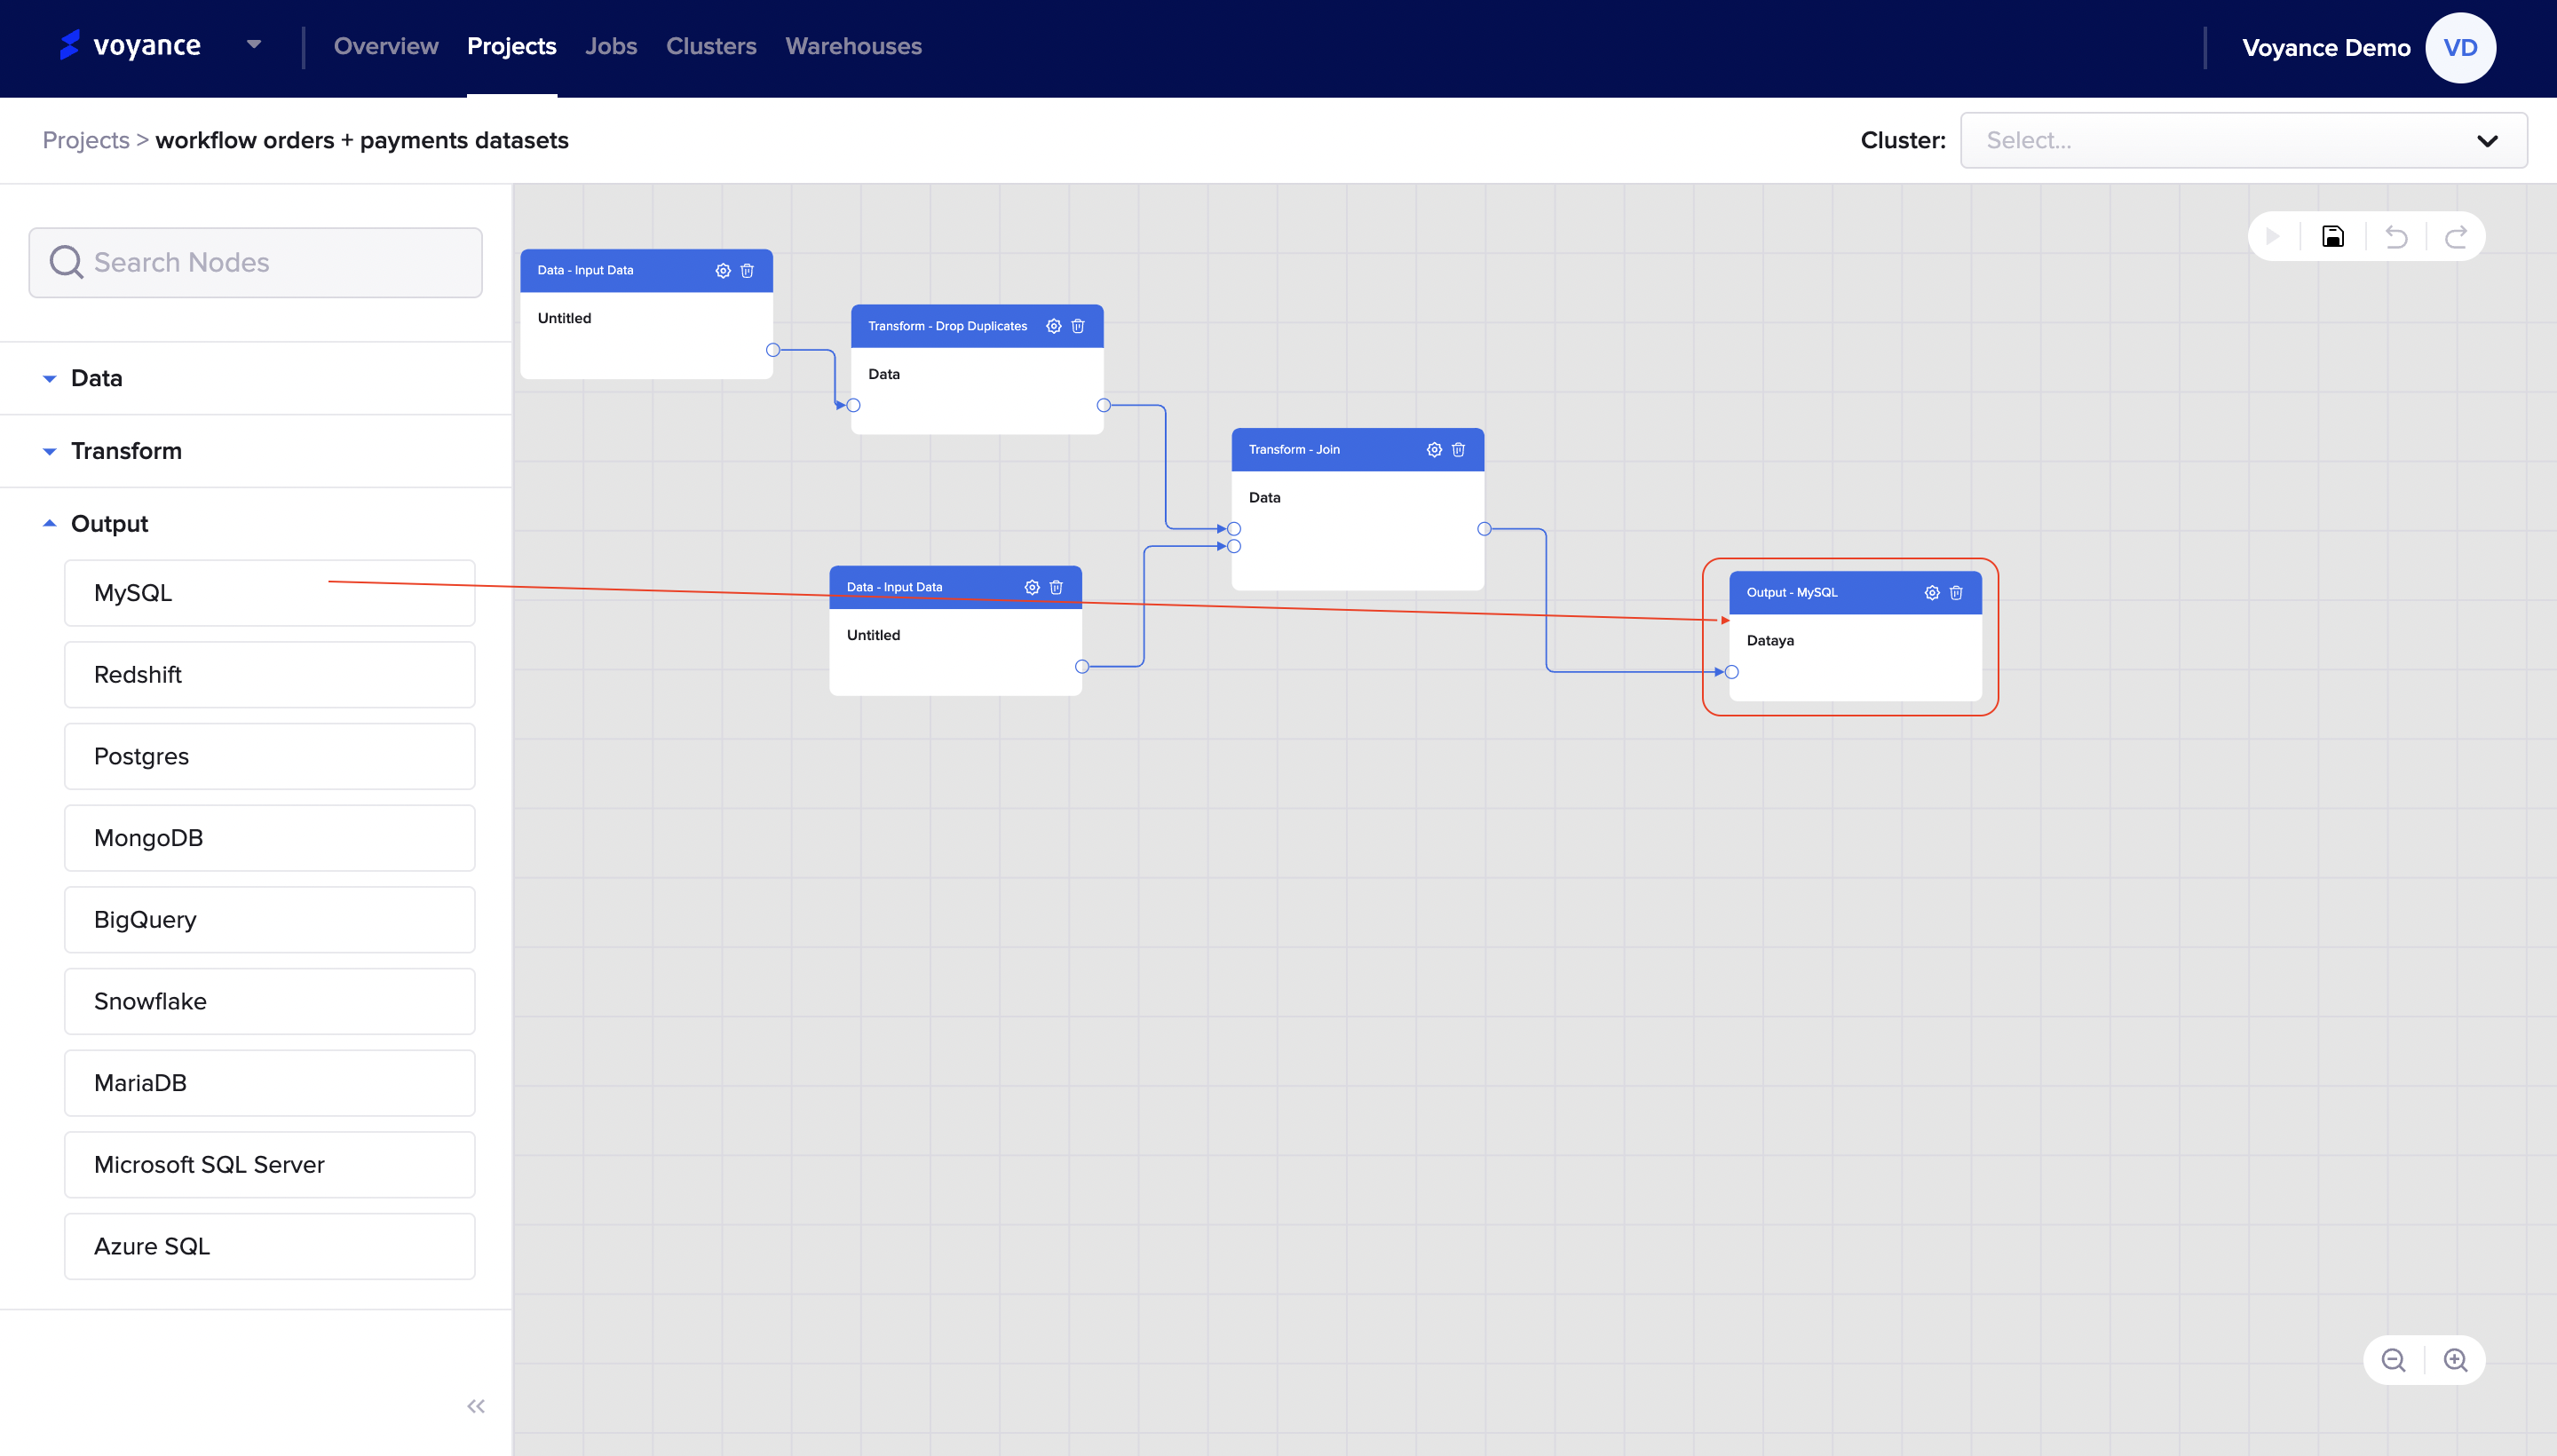
This section describes the processes of storing your data in the workflow. it entails the storage process of the workflow. In using the output, you have different Output functionalities which can be used for storage like *"MySQL, Redshift, Postgres, MongoDB, BigQuery, Snowflake, MariaDB, Microsoft SQL Server, Azure SQL.
To select any of the Output functionality, click on the "Output drop-down arrow", and a list of output functionalities that can be used to store your data for further analysis will be displayed. Learn how to store data using the different output tools.
###Output using MySQL
To store your data using My SQL functionality, click and drag "MySQL operator to my workflow to perform configuration for storing data.
Configure MySQL output
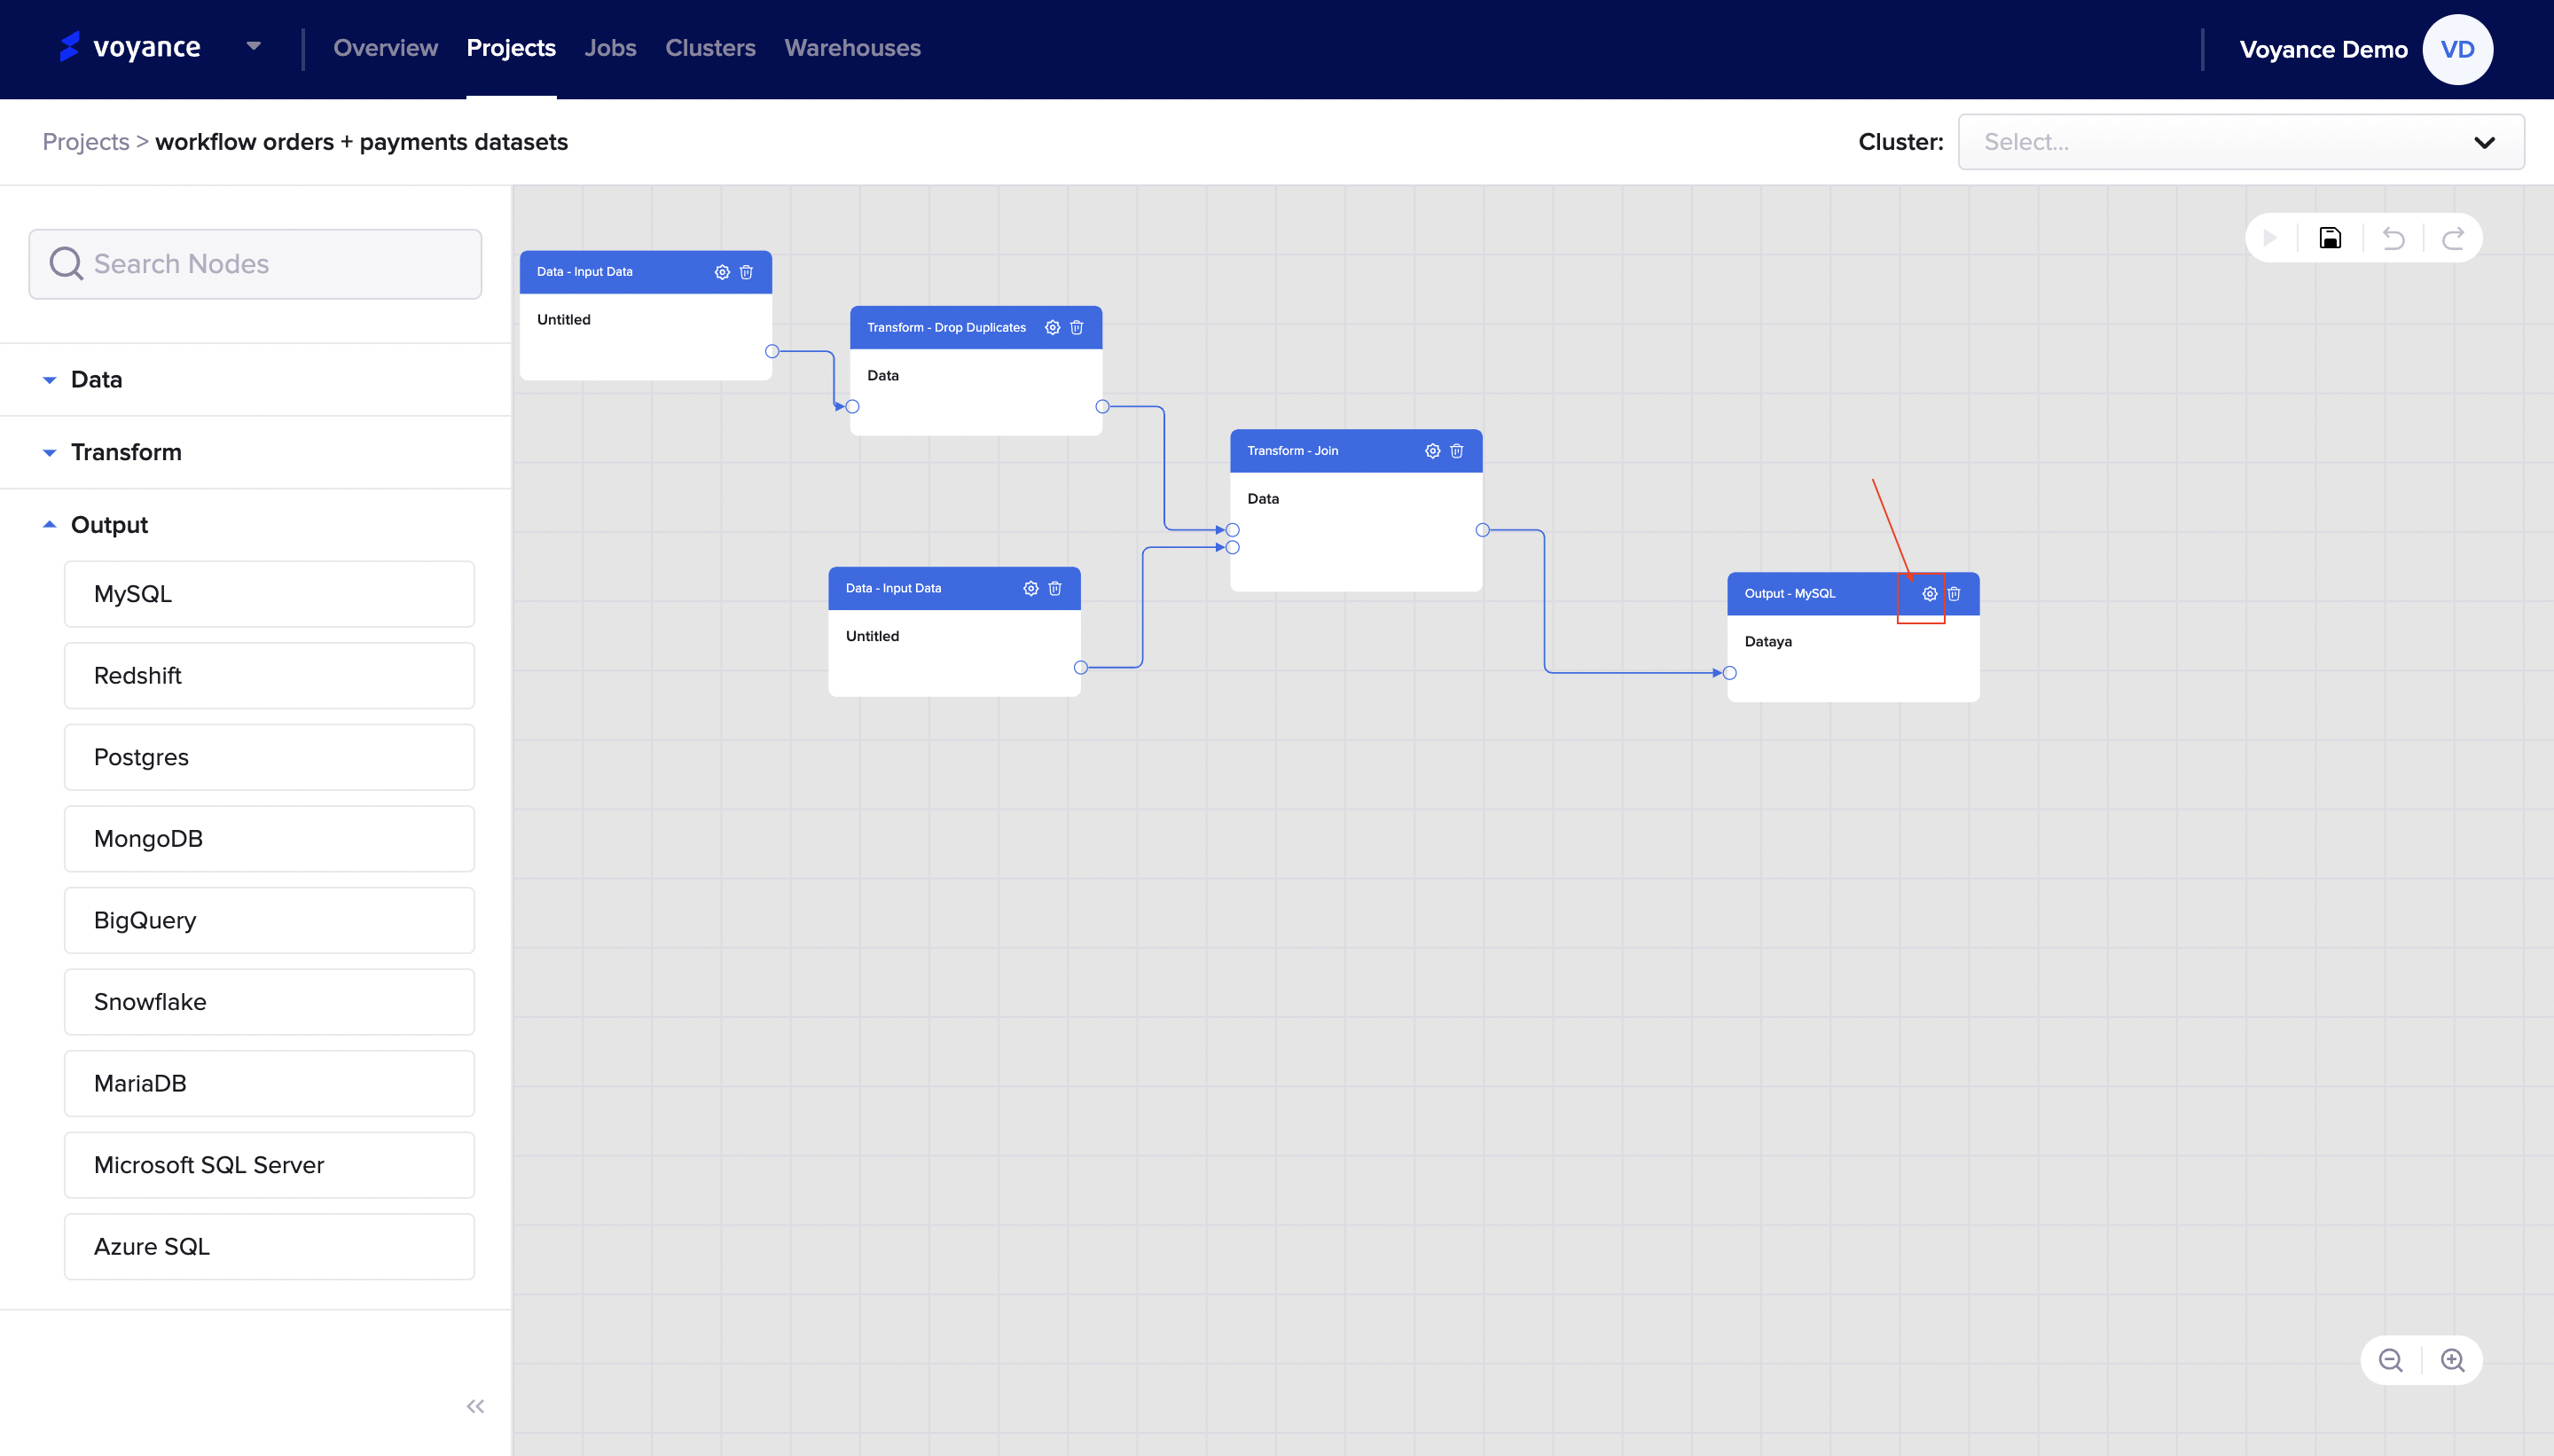
To edit the MySQL operator, click on the "settings icon at the top of the MySQL dialog box on the workflow.
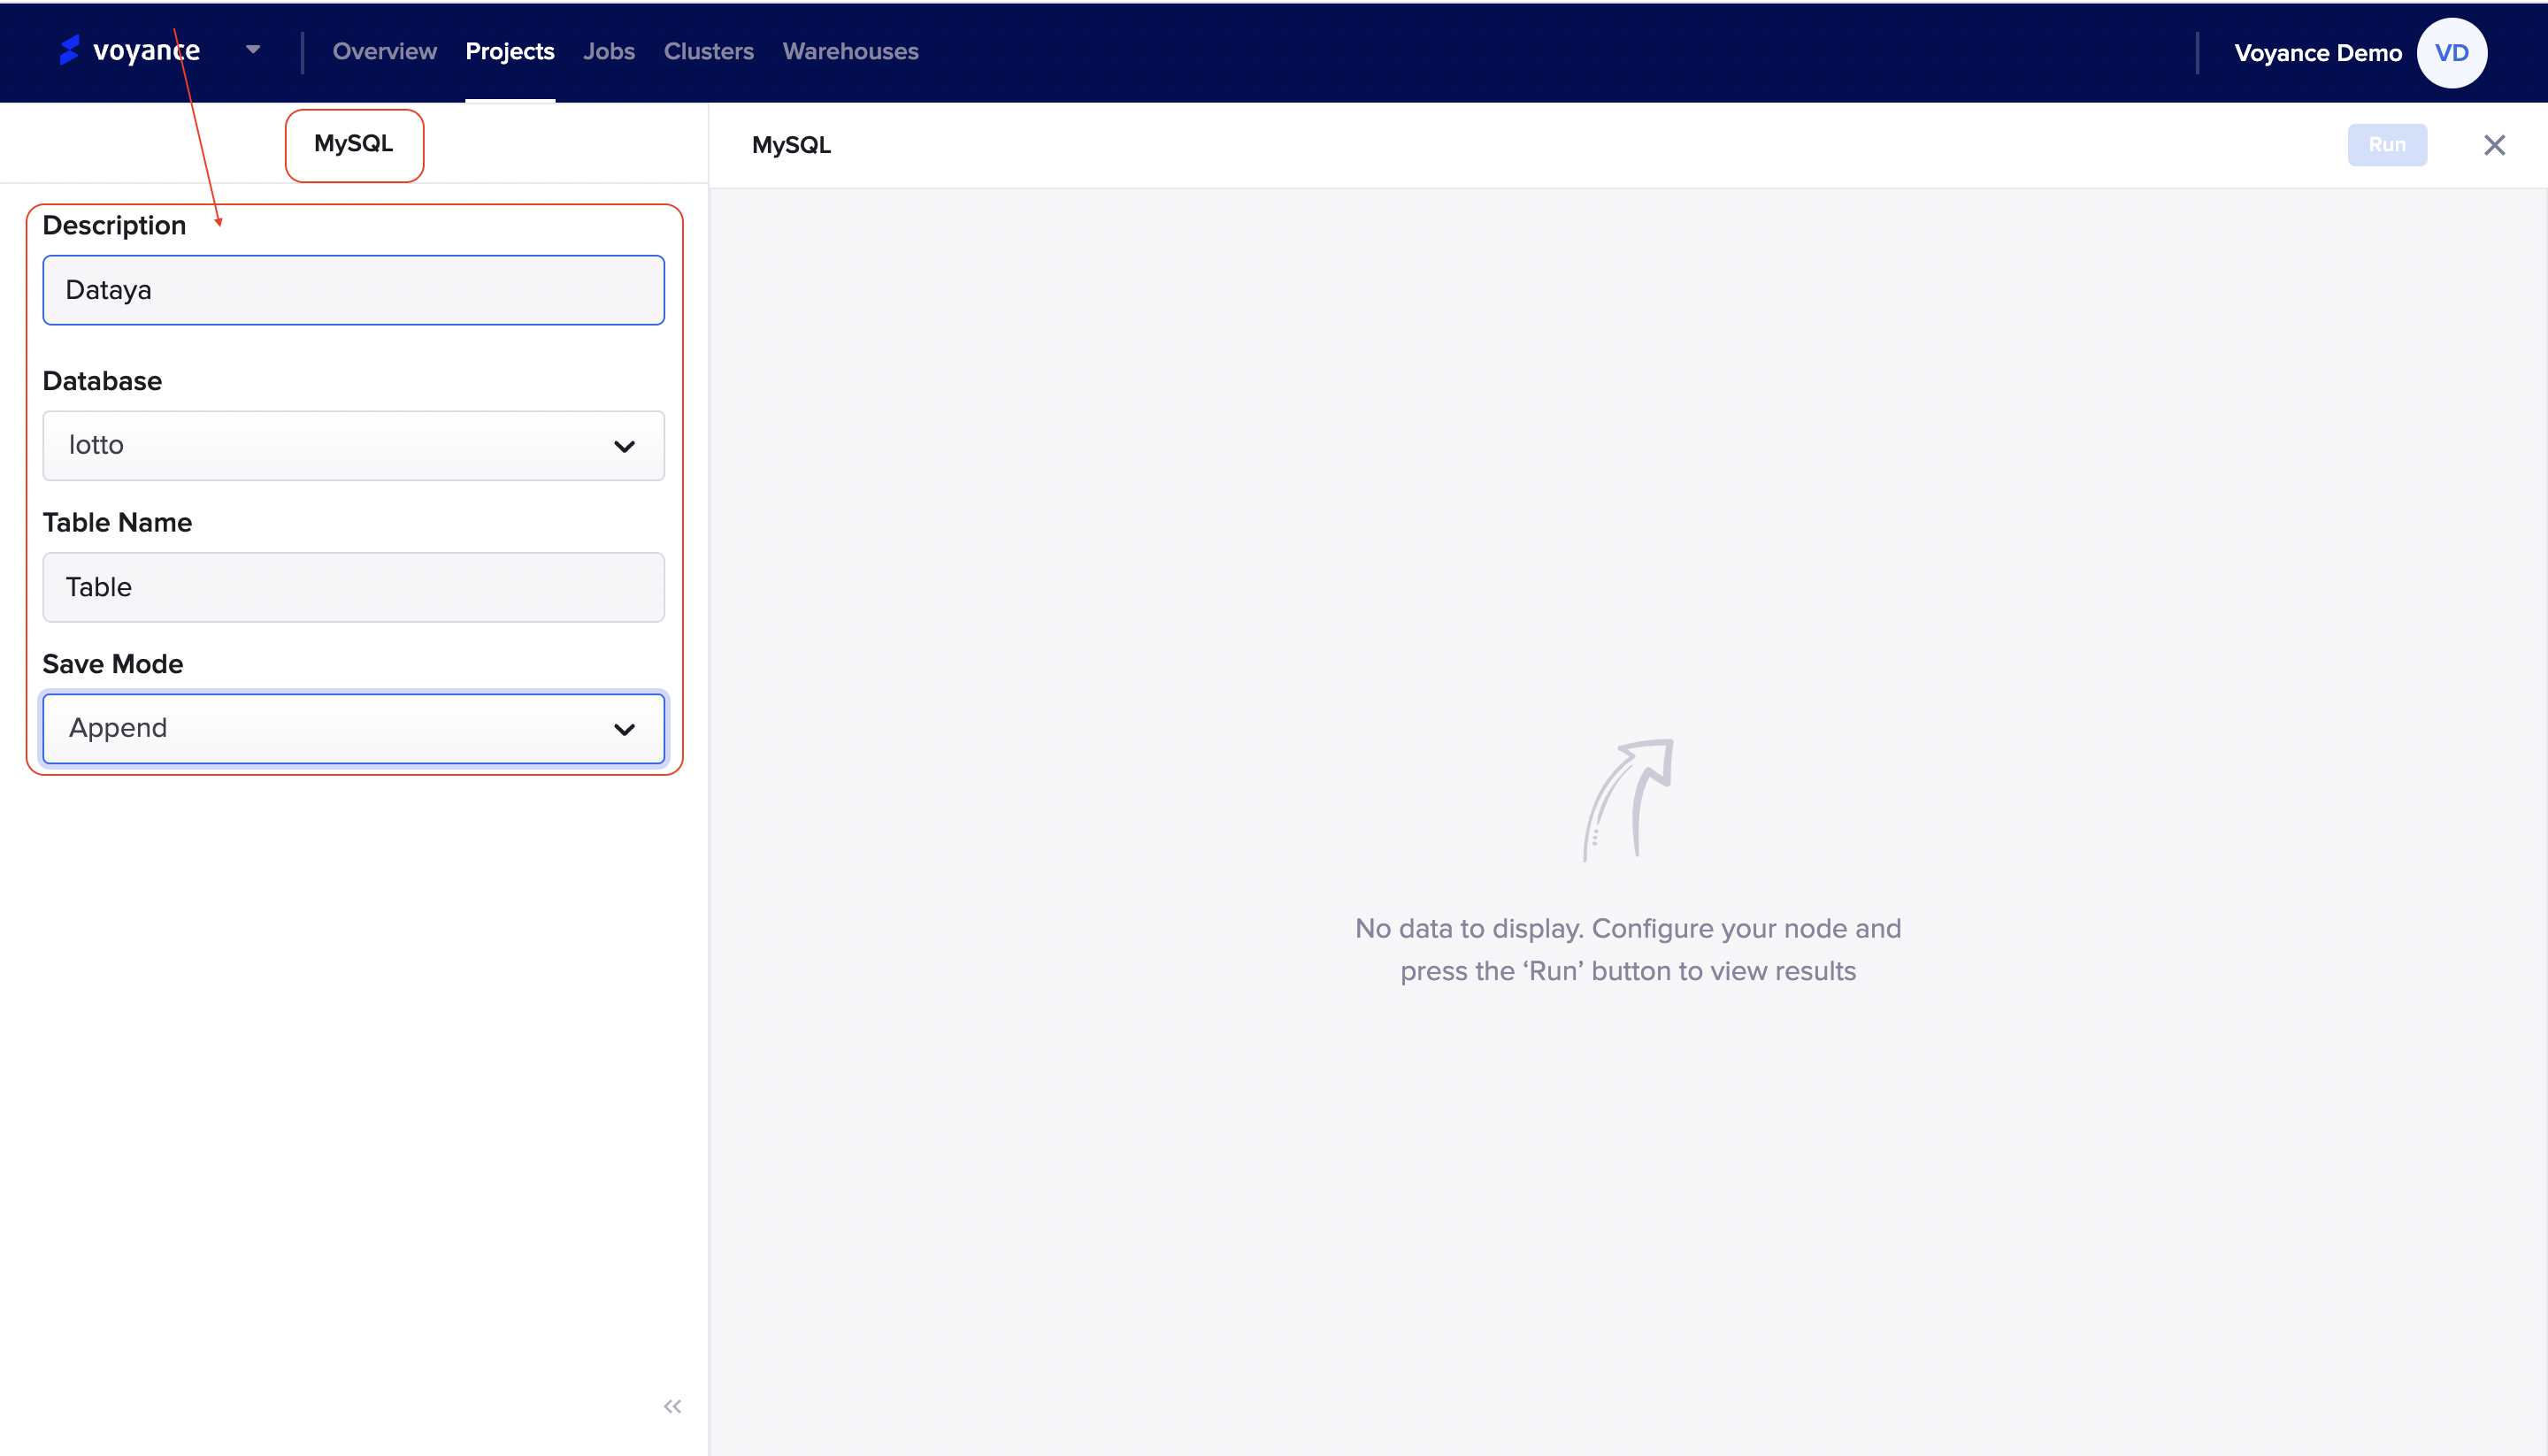
It redirects you to the MySQL page where you fill in the parameter to be able to configure your nodes and analyze the result of the nodes. The parameters in MySQL output include:
Description:Give a name or title to the MySQL page. it is optional and note that the name will be displayed on the MySQL dialog box of the workflow.
Database: Choose a database you want to use by clicking on the drop-down to select a database for the nodes.
Table Name: Give a name to the table
Save Mode: choose a save mode for your output. To select a save mode, click on the drop-down arrow to select a save mode for your data. There are some save mode options such as "Append, Overwrite, Error if exist, and, Ignore"
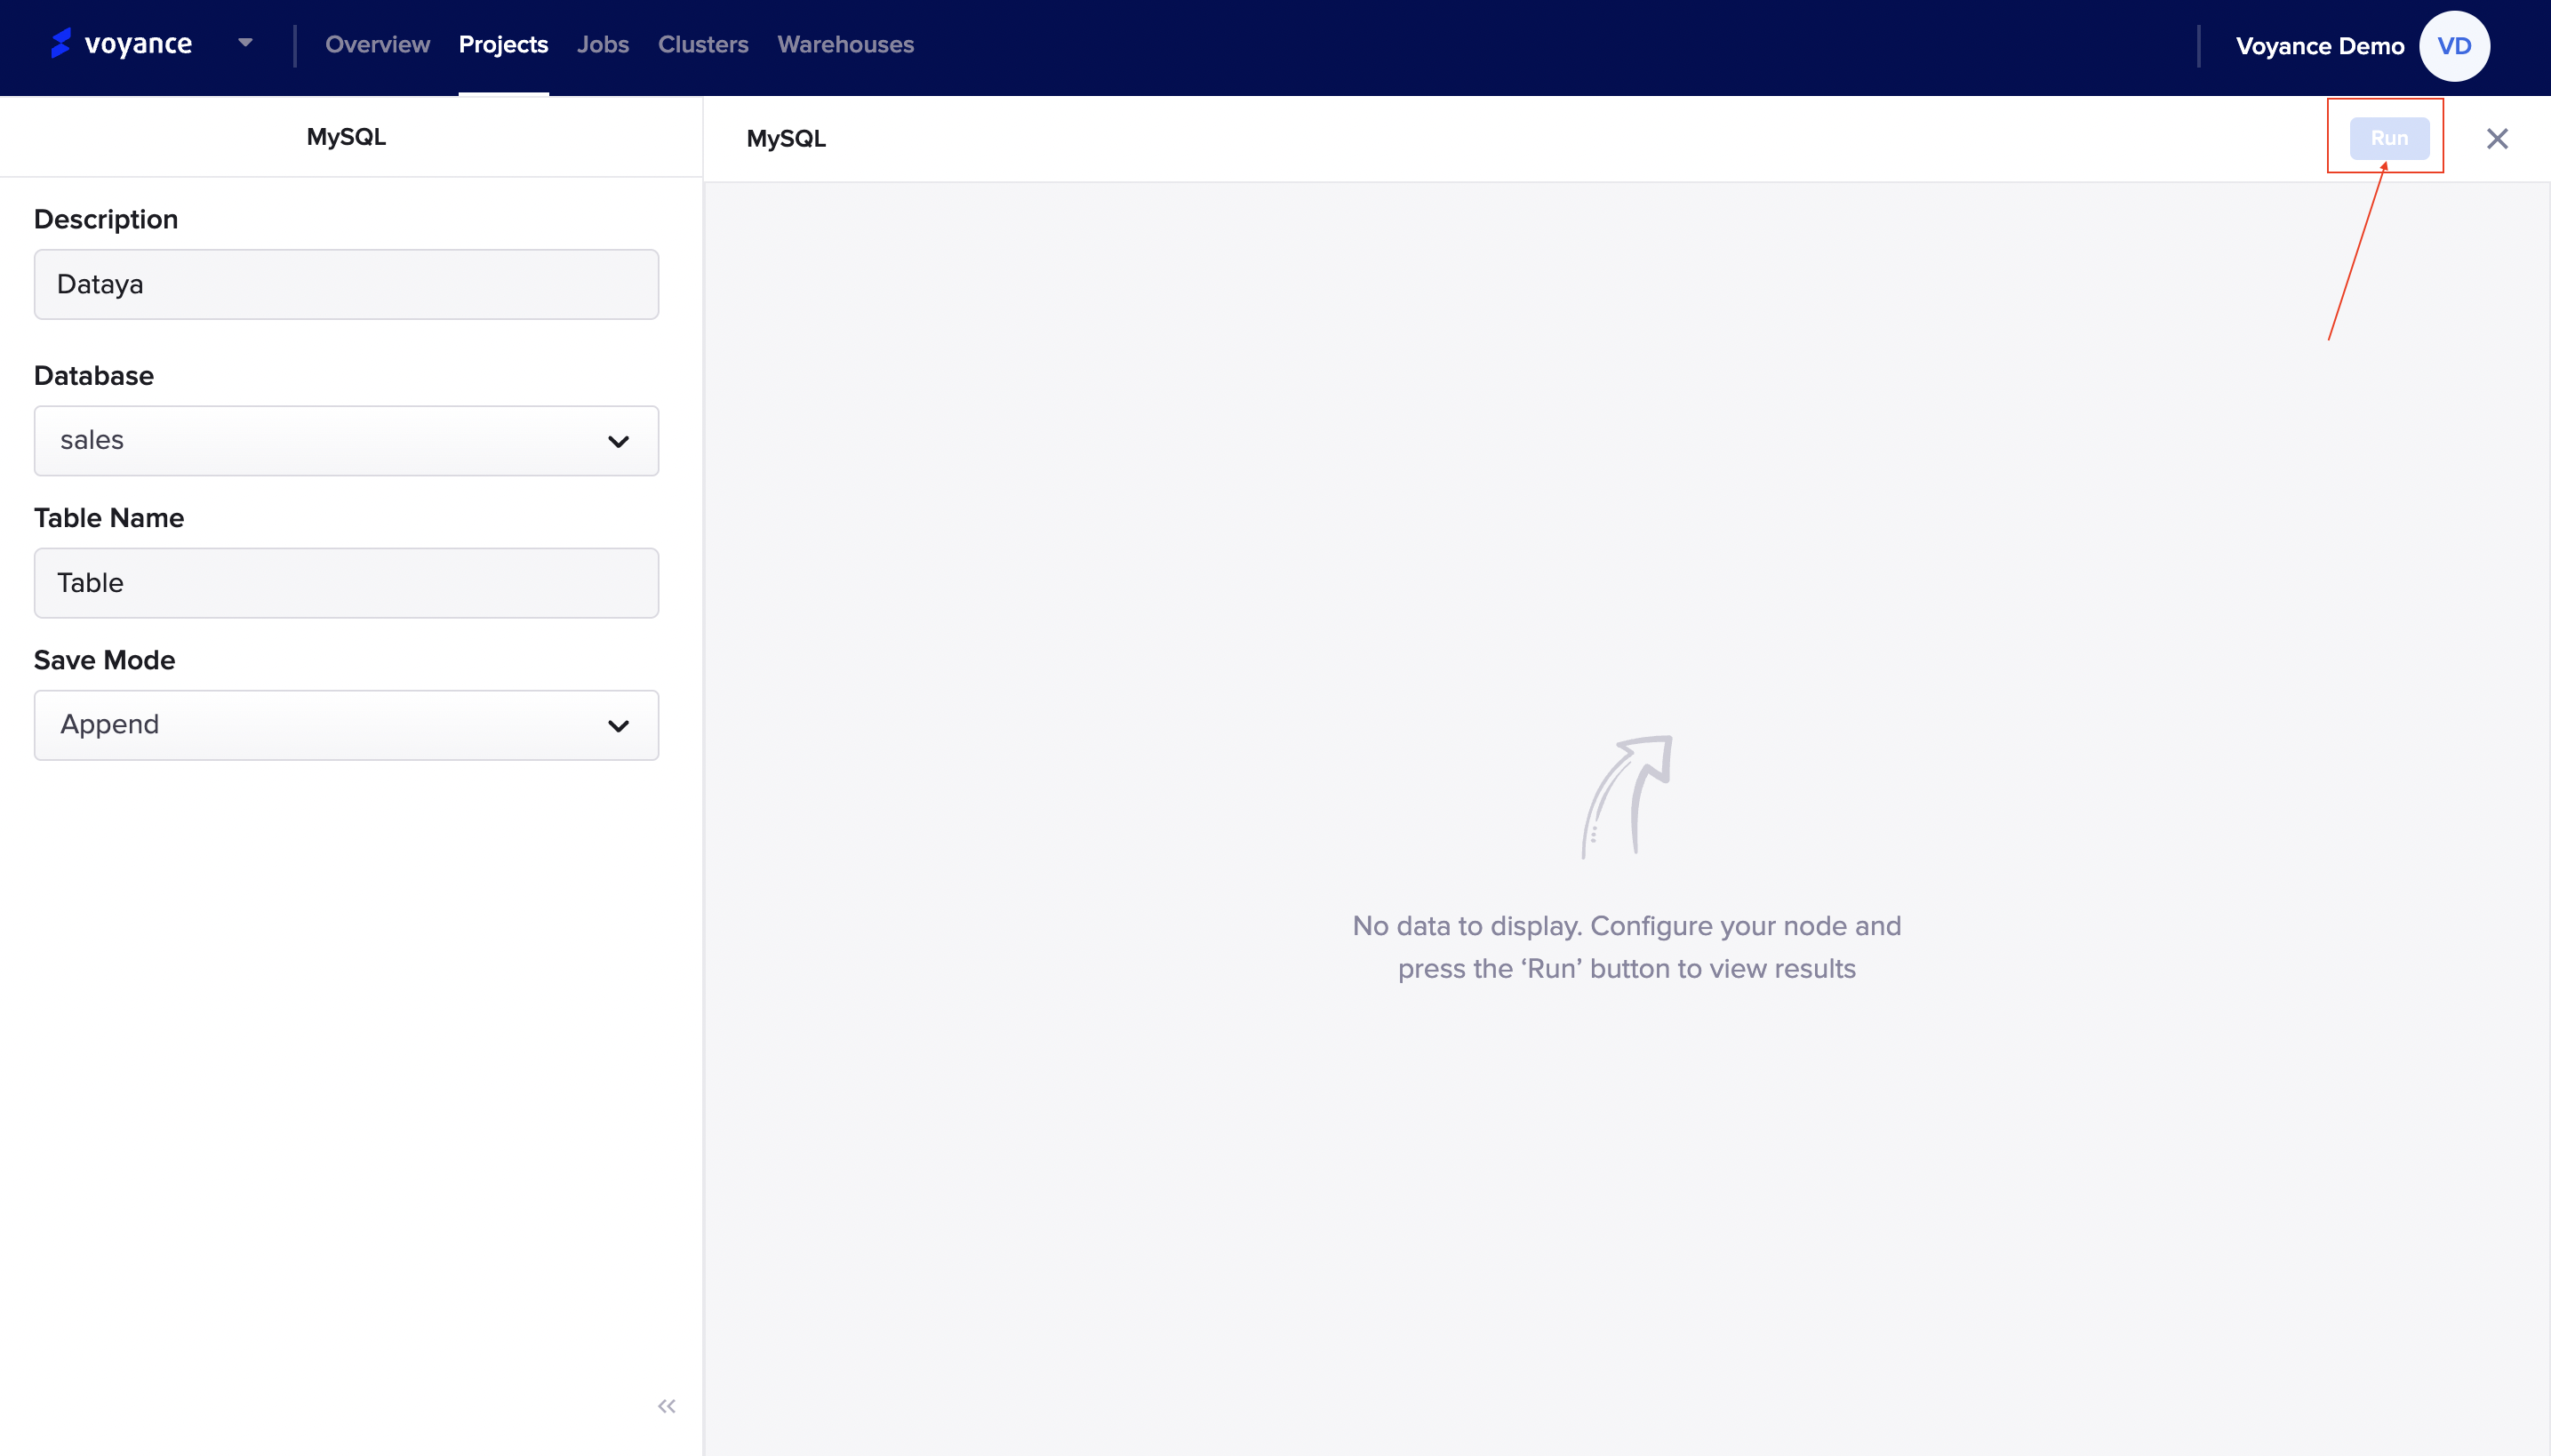
Run program
To view the result of your node's configuration, click on the "Run" tab at the top-right of the MySQL page to analyze and view the result of the configuration.
Note
The parameters used for the MySQL page for configuration are also the same for the other output operators or functionalities.
Output using Redshift
To store your data using the Redshift tools, click and drag the "Redshift operator to the workflow to perform configuration for storing your data
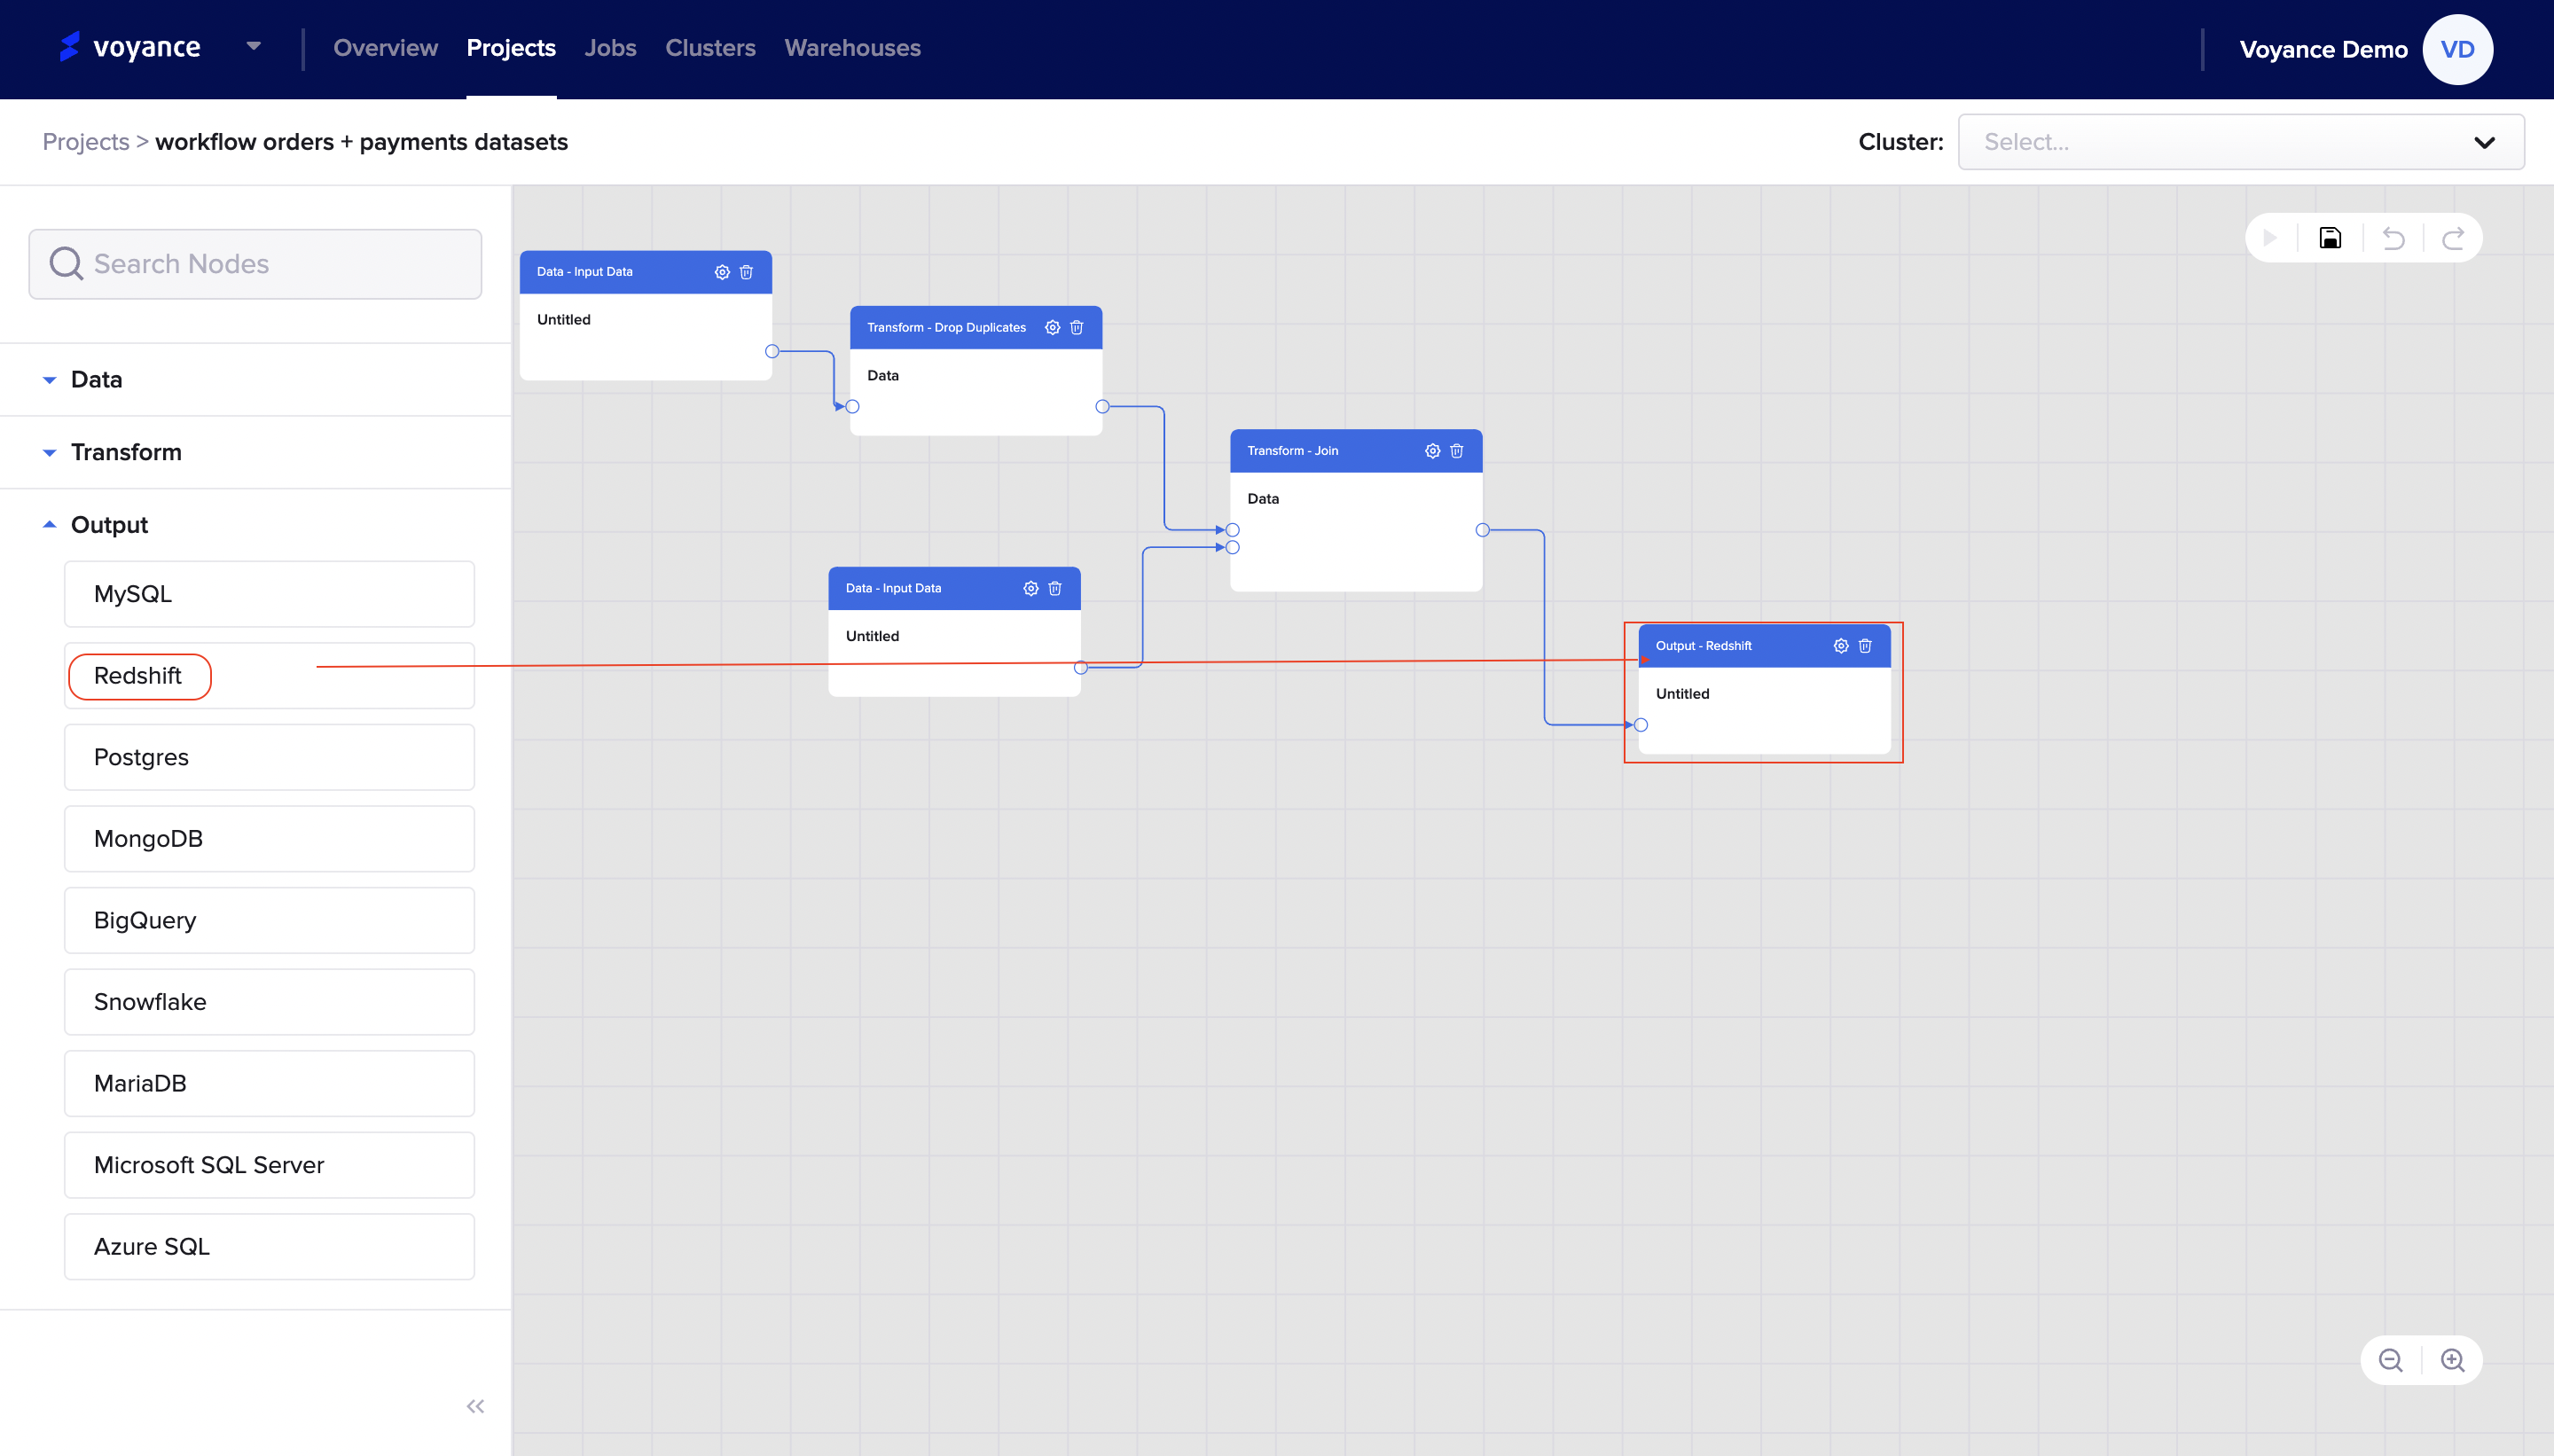
Configure the Redshift output
To edit the. Redshift operator for configuration, click on the setting icon at the top of the Redshift dialog box of the workflow.
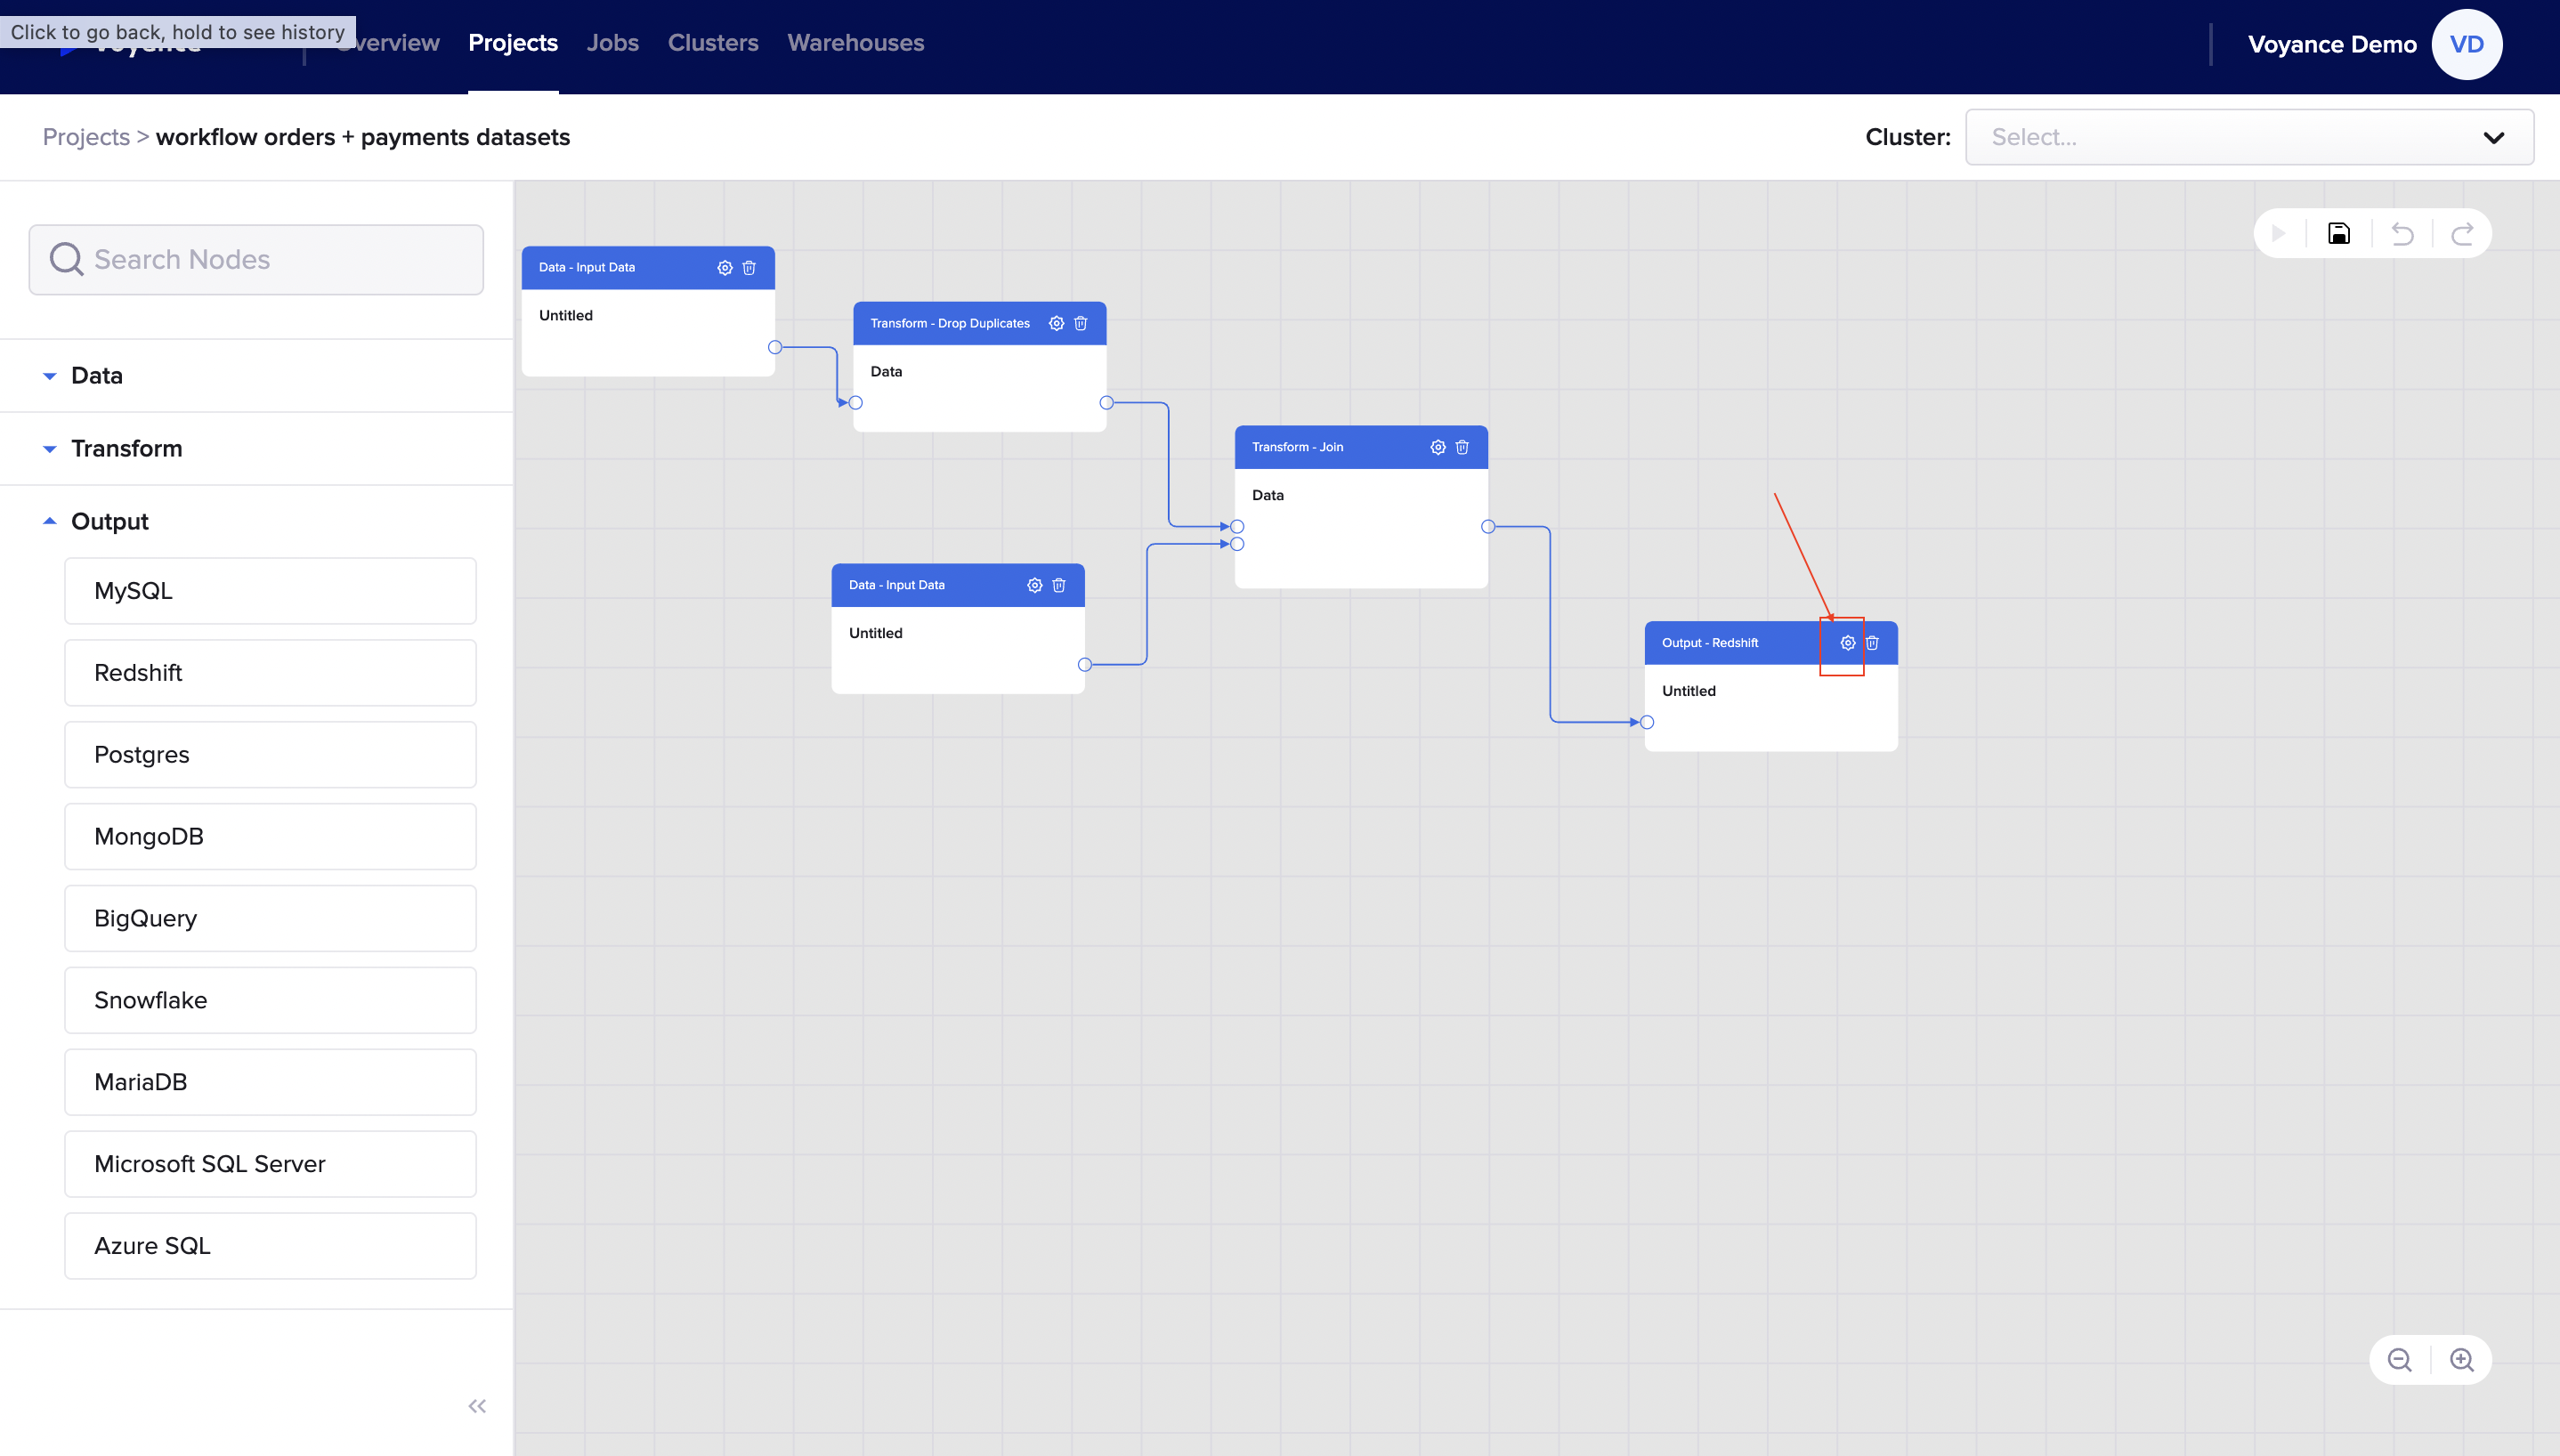
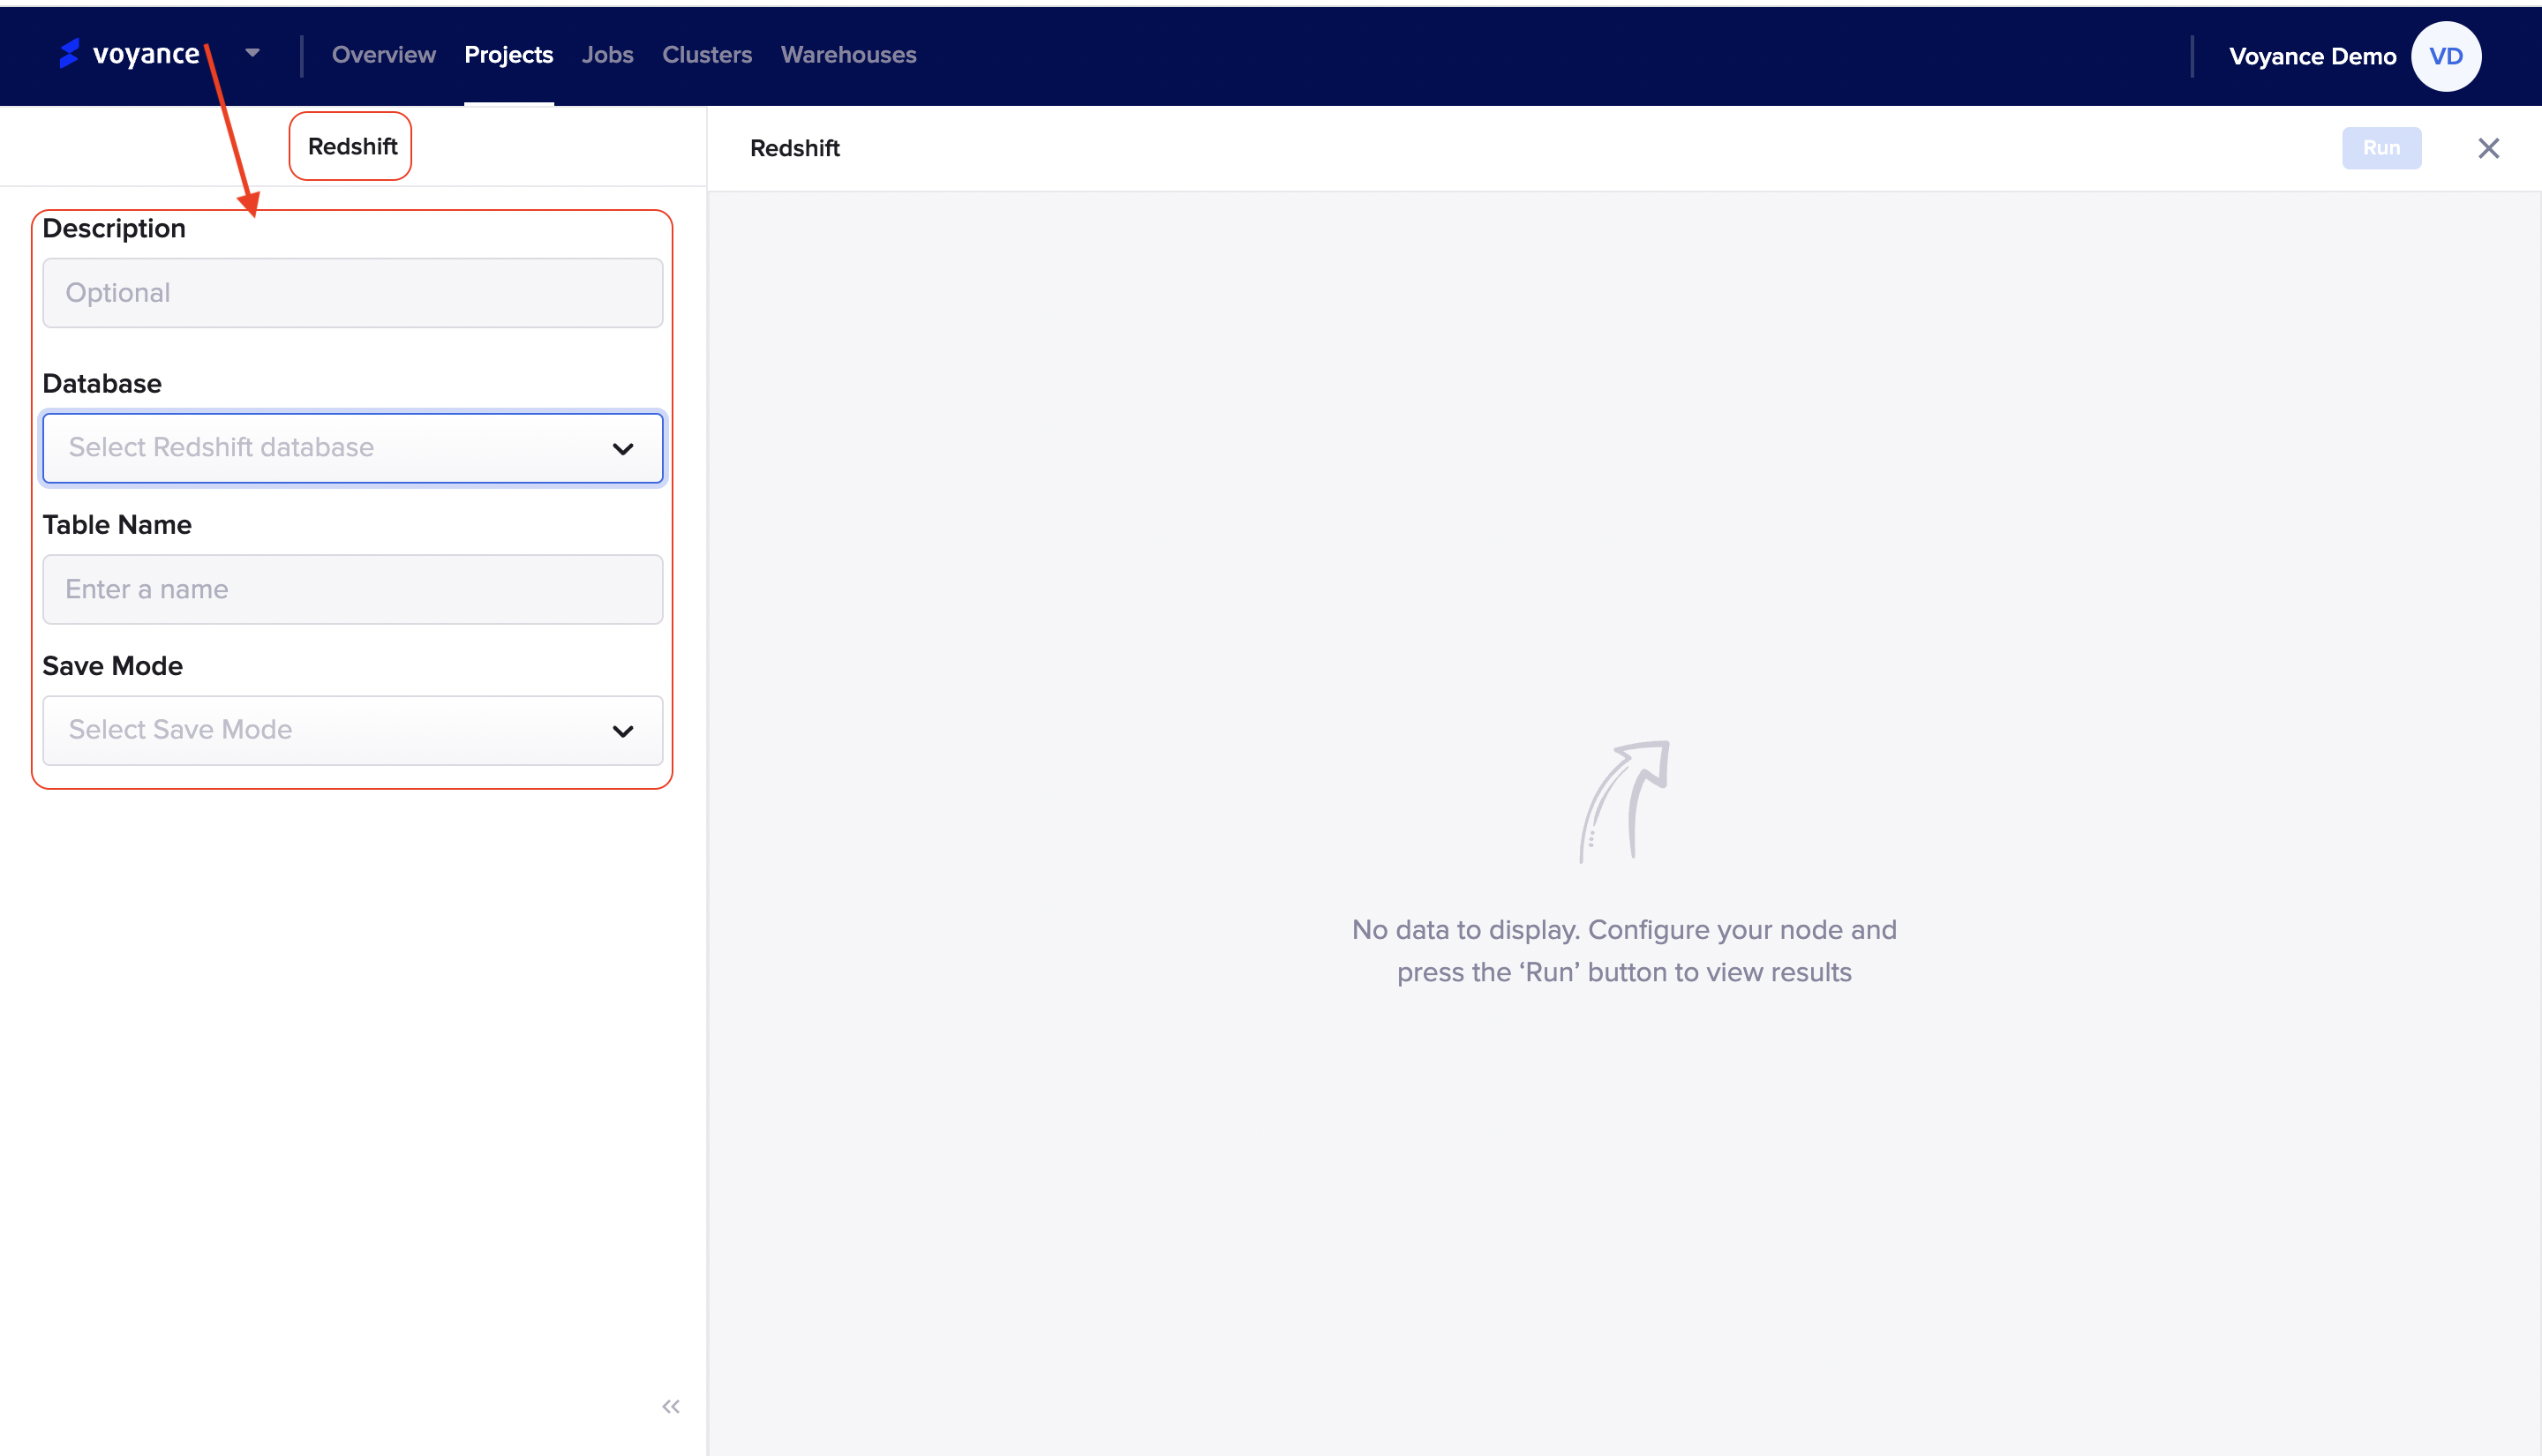
It redirects you to the Redshift page where you fill in the parameter to be able to configure your nodes and analyze the result of the nodes. The parameters in Redshift output include:
Description:Give a name or title to the Redshift page. it is optional and note that the name will be displayed on the Redshift dialog box of the workflow
Database: Choose a database you want to use by clicking on the drop-down to select a database for the nodes.
Table Name: Give a name to the table
Save Mode: choose a save mode for your output. To select a save mode, click on the drop-down arrow to select a save mode for your data. There are some save mode options such as "Append, Overwrite, Error if exist, and, Ignore".
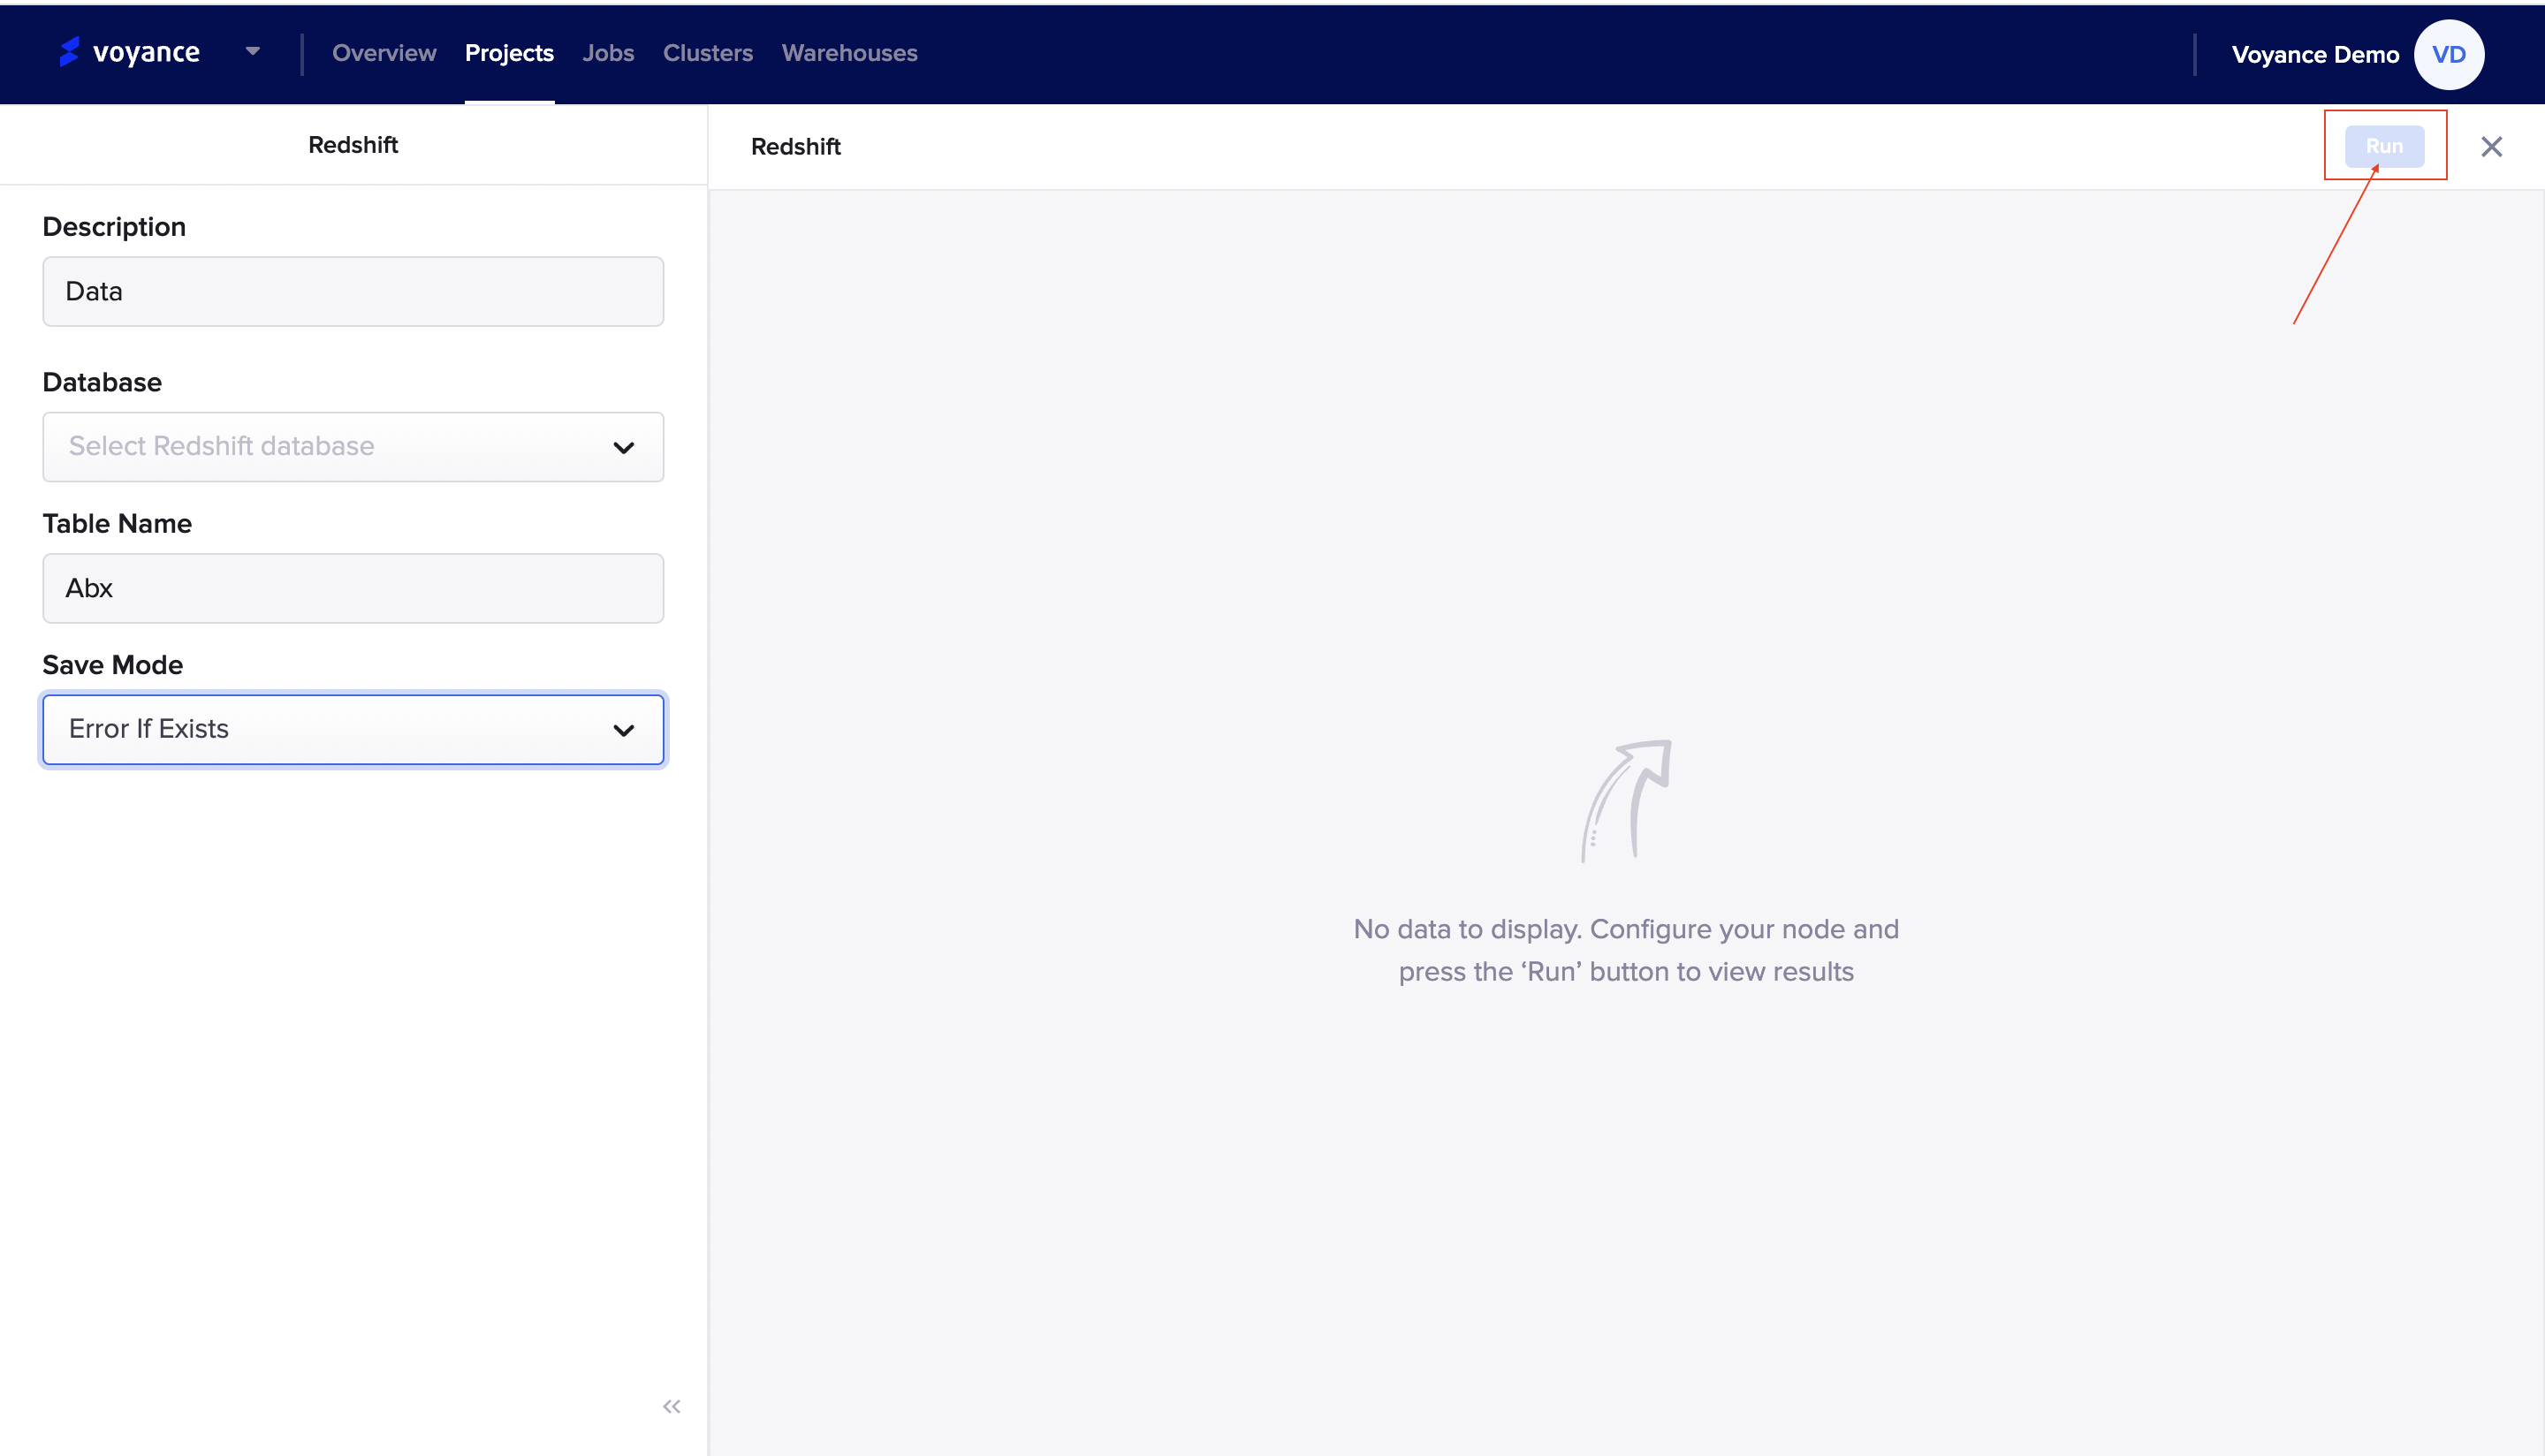
Run program
To view the result of your node's configuration, click on the "Run" tab at the top-right of the Redshift page to analyze and view the result of the configuration.
Output using Postgres
To use the Postgres for your storage output, click and drag the "Postgre operator to the workflow to perform node configuration for storage.
Configure the Postgre output
To configure your postgre output, click on the "settings icon" at the top of the postgre dialog box on the workflow.
It redirects you to the Postgre page where you fill in the parameter to be able to configure your nodes and analyze the result of the nodes. The parameters in Postgre output include:
Description:Give a name or title to the Postgre page. it is optional and note that the name will be displayed on the postgre dialog box of the workflow
Database: Choose a database you want to use by clicking on the drop-down to select a database for the nodes.
Table Name: Give a name to the table
Save Mode: choose a save mode for your output. To select a save mode, click on the drop-down arrow to select a save mode for your data. There are some save mode options such as "Append, Overwrite, Error if exist, and, Ignore".
Run program
To view the result of your node's configuration, click on the "Run" tab at the top-right of the Postgre page to analyze and view the result of the configuration.
Output using MongoDB
Configure the MongoDB output
To configure your MongoDB output, click on the "settings icon" at the top of the postgre dialog box on the workflow.
It redirects you to the MongoDB page where you fill in the parameter to be able to configure your nodes and analyze the result of the nodes. The parameters in MongoDB output include:
Description:Give a name or title to the MongoDB page. it is optional and note that the name will be displayed on the MongoDB dialog box of the workflow
Database: Choose a database you want to use by clicking on the drop-down to select a database for the nodes.
Table Name: Give a name to the table
Save Mode: choose a save mode for your output. To select a save mode, click on the drop-down arrow to select a save mode for your data. There are some save mode options such as "Append, Overwrite, Error if exist, and, Ignore".
Run program
To view the result of your node's configuration, click on the "Run" tab at the top-right of the MongoDB page to analyze and view the result of the configuration.
Output with BigQuery
Configure the Bigquery output
To perform nodes configuration on Bigquery output, click on the "settings icon" at the top of the Bigquery dialog box on the workflow.
It redirects you to the Bigquery page where you fill in the parameter to be able to configure your nodes and analyze the result of the nodes. The parameters in Bigquery output include:
Description:Give a name or title to the Bigquery page. it is optional and note that the name will be displayed on the Bigquery dialog box of the workflow
Database: Choose a database you want to use by clicking on the drop-down to select a database for the nodes.
Table Name: Give a name to the table
Save Mode: choose a save mode for your output. To select a save mode, click on the drop-down arrow to select a save mode for your data. There are some save mode options such as "Append, Overwrite, Error if exist, and, Ignore".
Run program
To view the result of your node's configuration, click on the "Run" tab at the top-right of the Bigquery page to analyze and view the result of the configuration.
Output using Snowflake
Configure the Snowflake output
To perform nodes configuration on Snowflake output, click on the "settings icon" at the top of the Bigquery dialog box on the workflow.
It redirects you to the Snowflake page where you fill in the parameter to be able to configure your nodes and analyze the result of the nodes. The parameters in Snowflake output include:
Description:Give a name or title to the Snowflake page. it is optional and note that the name will be displayed on the Snowflake dialog box of the workflow
Database: Choose a database you want to use by clicking on the drop-down to select a database for the nodes.
Table Name: Give a name to the table
Save Mode: choose a save mode for your output. To select a save mode, click on the drop-down arrow to select a save mode for your data. There are some save mode options such as "Append, Overwrite, Error if exist, and, Ignore"
Run program
To view the result of your node's configuration, click on the "Run" tab at the top-right of the Snowflake page to analyze and view the result of the configuration.
Output with MariaDB
Configure the MariaDB output
To perform nodes configuration on MariaDB output, click on the "settings icon" at the top of the MariaDB dialog box on the workflow.
It redirects you to the MariaDB page where you fill in the parameter to be able to configure your nodes and analyze the result of the nodes. The parameters in MariaDB output include:
Description:Give a name or title to the MariaDB page. it is optional and note that the name will be displayed on the Snowflake dialog box of the workflow
Database: Choose a database you want to use by clicking on the drop-down to select a database for the nodes.
Table Name: Give a name to the table
Save Mode: choose a save mode for your output. To select a save mode, click on the drop-down arrow to select a save mode for your data. There are some save mode options such as "Append, Overwrite, Error if exist, and, Ignore"
Updated over 3 years ago
